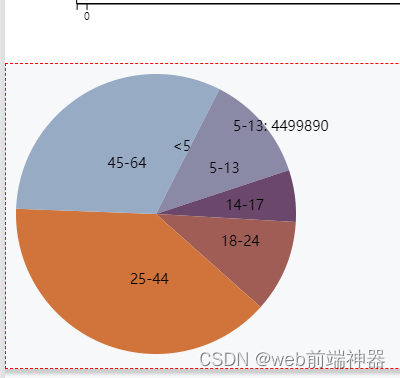
代码以及注释如下:
const width = 300; // 定义圆的宽度
const height = 300; // 定义圆的高度
const radius = Math.min(width, height) / 2; // 算出半径
const color = d3.scaleOrdinal()
.range(["#98abc5", "#8a89a6", "#6b486b", "#a05d56", "#d0743c"]); // 配置颜色
const arc = d3.arc()
.outerRadius(radius - 10) // 外圆半径
.innerRadius(0)
; // 内圆半径,如果为零则为实心圆
const pie = d3.pie() // 定义饼图
.sort(null)
.value(d => d.population); // 通过以下data数据中的population来分配饼图所占空间
const svg = d3.select("#gb08fe") // 添加一个svg图
.append("svg")
.attr("width", width)
.attr("height", height)
.append("g")
.attr("transform", `translate(${width / 2}, ${height / 2})`);
const data = [{ // 创建数据
age: "<5",
population: 2704659
},
{
age: "5-13",
population: 4499890
},
{
age: "14-17",
population: 2159981
},
{
age: "18-24",
population: 3853788
},
{
age: "25-44",
population: 14106543
},
{
age: "45-64",
population: 8819342
},
];
const g = svg.selectAll(".arc") // 选择或创建类名为arc的元素
.data(pie(data)) // 调用饼图并添加数据绑定
.enter().append("g") // 筛入到元素中并添加g标签
.attr("class", "arc"); // 设置样式名称为arc
// 这里的g则表示每一个标签g元素
g.append("path") // 添加path来绘制饼图
.attr("d", arc) // 绘制路径d,路径为src
.style("fill", d => color(d.data.age)); // 路径d的填充色
g.append("text") // 添加文本
.attr("transform", d => `translate(${arc.centroid(d)})`)
.attr("dy", ".35em")
.text(d => d.data.age);
const tooltip = d3.select("#gb08fe")
.append('div')
.attr('class', 'tooltip');
// 注意:这里是g不是svg否则后续监听之后的d的值会获取不到。因为以上g.data()才是将数据绑定到元素中
g.on('mouseenter', (event,d) => { // 这里的d.data才是数组里的每条数据
tooltip
.style('opacity', 1)
.html(`
<span>${d.data.age}: ${d.data.population}</span>
`)
})
.on('mousemove', (event, d) => {
tooltip
.style('left', `${event.pageX + 20}px`)
.style('top', `${event.pageY}px`)
.style('position', 'absolute');
})
.on('mouseleave', () => {
tooltip
.style('opacity', 0);
});
g.on('click',(event,d)=>{ // 添加点击事件
alert(d.data.age)
})


![[Openwrt]procd实现hotplug机制介绍](https://img-blog.csdnimg.cn/img_convert/2bf4f636d1c52333ea30e498301762e9.png)
