文章目录
- 方法1:在MobaXterm的终端输入指令
- 方法2:在Pycharm中运行
前提概要,需要在本地Windows端显示点云的3d可视化界面
对于点云的3d可视化一般有两种方法,open3d显示或者是mayavi显示。这两个库都可以使用pip install来实现安装。不过,通过测试open3d各种方法都无法实现在本地显示点云可视化窗口,所以下面是利用mayavi来显示。
安装:
pip install open3d
pip install mayavi
ps:之前使用mayavi需要使用python=3.7的版本,不然会出现一些问题,不过现在我用的是python=3.9的版本同样可以正常使用。下面分别在终端或者是Pycharm中进行可视化。
方法1:在MobaXterm的终端输入指令
# 利用mayavi来显示点云可视化结果
pip uninstall open3d
pip install mayavi
python demo.py --cfg_file cfgs/kitti_models/pv_rcnn.yaml --ckpt ckpts/kitti_ckpts/pv_rcnn_8369.pth --data_path ../data/data_test_dir/000008.bin
方法2:在Pycharm中运行
配置config:
parser = argparse.ArgumentParser(description='arg parser')
parser.add_argument('--cfg_file', type=str, default='cfgs/kitti_models/pv_rcnn.yaml',
                    help='specify the config for demo')
parser.add_argument('--data_path', type=str, default='../data/data_test_dir/000008.bin',
                    help='specify the point cloud data file or directory')
parser.add_argument('--ckpt', type=str, default='ckpts/kitti_ckpts/pv_rcnn_8369.pth',
                    help='specify the pretrained model')
parser.add_argument('--ext', type=str, default='.bin',
                    help='specify the extension of your point cloud data file')
在mobaxterm中输入:echo $DISPLAY,我这边显示的结果是:localhost:13.0。将显示的内容配置在Pycharm中,如下所示即可。ps:需要注意这个localhost:13.0是后续是可能改变的,如果出现了无法显示的情况可能就是localhost改变了端口,需要再重新查一次。

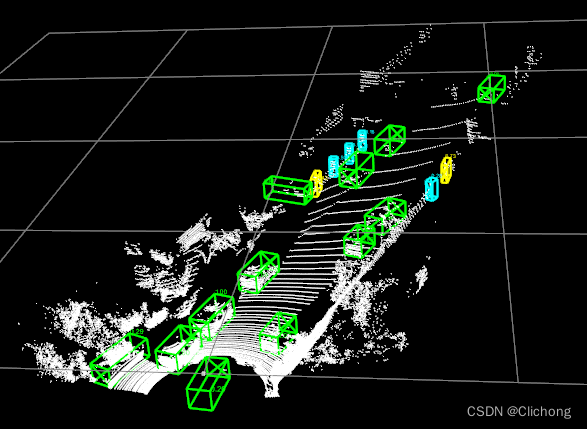
随后即可显示点云的可视化效果:
参考资料:Pycharm使用ssh远程python环境并在本地可视化open3d
