使用 OpenCV 从彩色图像创建铅笔素描图像
这个项目是我为 LetsGrowMore 的数据科学实习生创建的任务。
LetsGrowMore :https://letsgrowmore.in/vip/
目录
什么是 OpenCV?
第 1 步:读取图像
第 2 步:将图像转换为灰度
第 3 步:将灰度图像转换为反转灰度
第 4 步:模糊负片图像
第 5 步:反转模糊图像
第 6 步:将灰度与倒置模糊图像混合
第 7 步:使用 Matplotlib 将其与原始图像一起显示
第 8 步:保存图片
我学到了什么
接下来要尝试的事情
参考
什么是 OpenCV?
OpenCV (Open Source Computer Vision Library)是一个开源的计算机视觉和机器学习软件库。
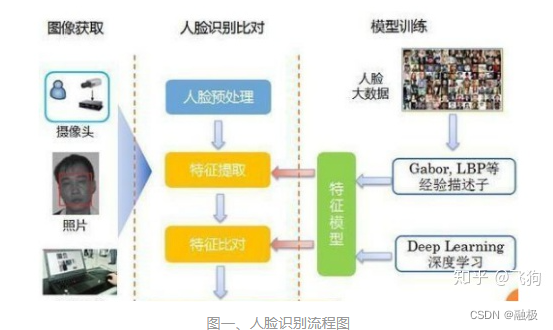
它提供了广泛的功能,包括对象检测、人脸识别和跟踪。
在这里,我们将使用 Open CV 将彩色图像转换为铅笔素描。
在这里,我使用 Google Colab 作为我的 IDE。
第 1 步:读取图像
import cv2
import matplotlib.pyplot as plt

#imported cv2_imshow specific for google colab
from google.colab.patches import cv2_imshow

#to read the image
image= cv2.imread('desktop.png')

#to display the image
cv2_imshow(image)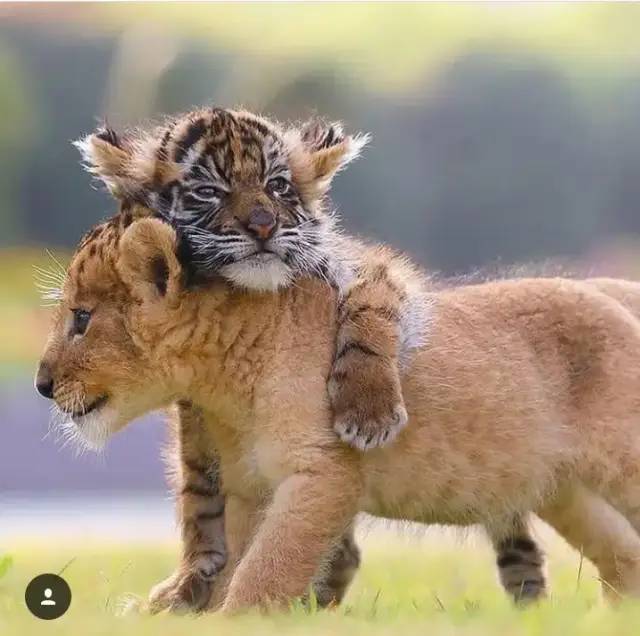
OpenCV使用BGR配色方案,所以这里不用改颜色。但是当我们使用 Matplotlib 时,我们需要转换,因为它使用RGB配色方案
第 2 步:将图像转换为灰度
#converting the image to grayscale
gray= cv2.cvtColor(im,cv2.COLOR_BGR2GRAY)
cv2_imshow(gray)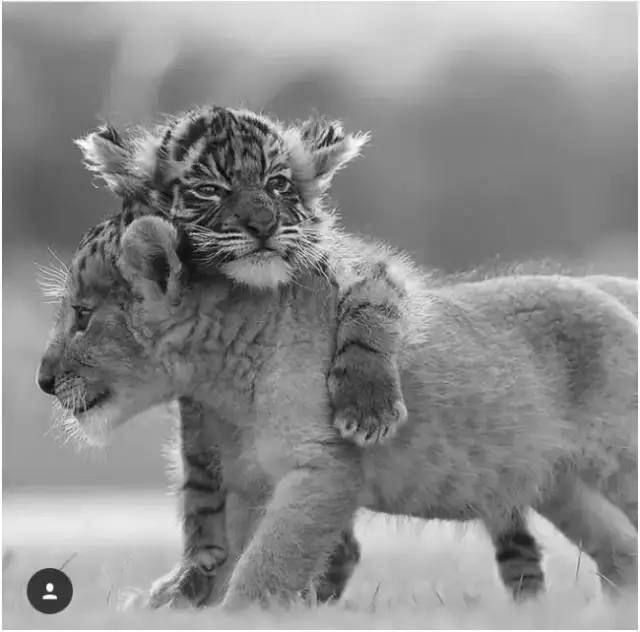
第 3 步:将灰度图像转换为反转灰度
反转灰度图像也称为负像。这样做是为了增强图像的细节。
#converting image to inverted grayscale

inv_gray= 255-gray
cv2_imshow(inv_gray)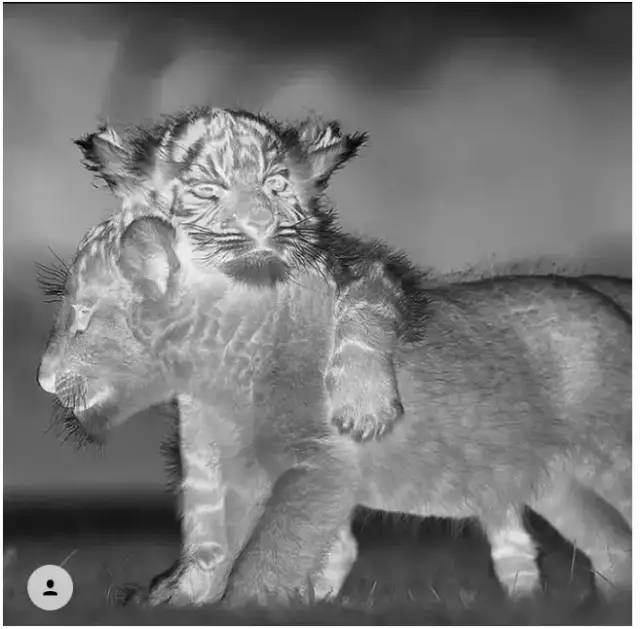
第 4 步:模糊负片图像
使用反复试验找到内核大小;对于较大的图像,内核大小应该更大。
对于较小的图像,它应该是小数字,如 3x3 或 5x5。在小图像中赋予大内核值将删除图像的实际结构。
blur_img=cv2.GaussianBlur(inv_gray,(101,101),0)
cv2_imshow(blur_img)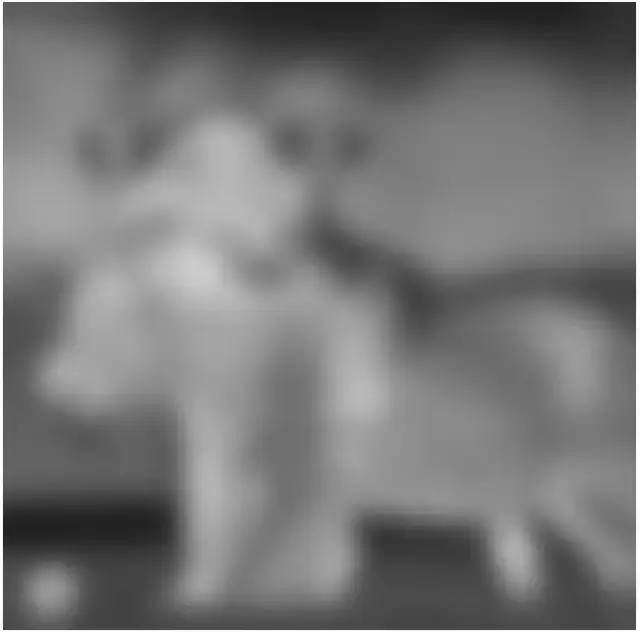
第 5 步:反转模糊图像
#inverting the blurred image

inv_blur=255-blur_img
cv2_imshow(inv_blur)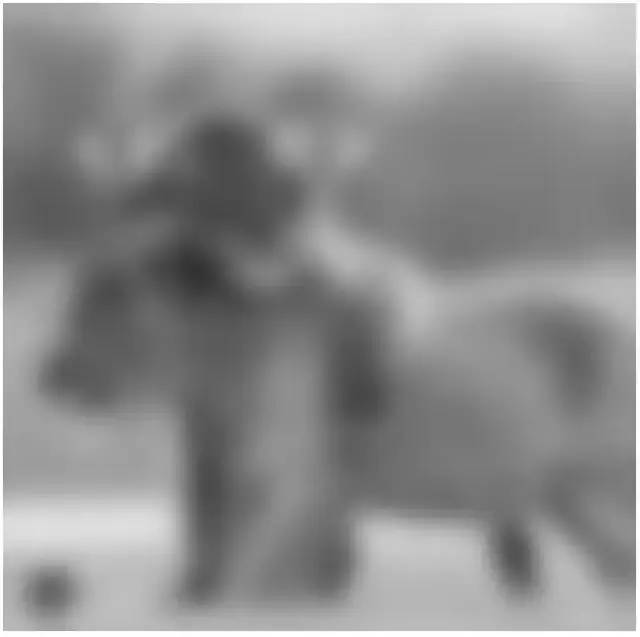
第 6 步:将灰度与倒置模糊图像混合
为了完成我们的铅笔素描,我们需要混合灰度和倒置模糊图像。
我们将使用CV2 divide方法来执行该操作
CV2 divide:两个数组或标量除以数组的每个元素。
sketch_img= cv2.divide(gray,inv_blur,scale=255.0)
cv2_imshow(sketch_img)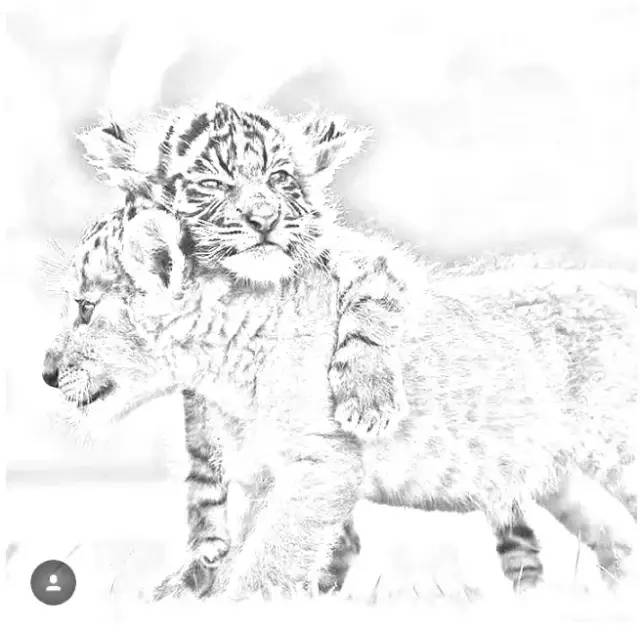
我们做到了!!
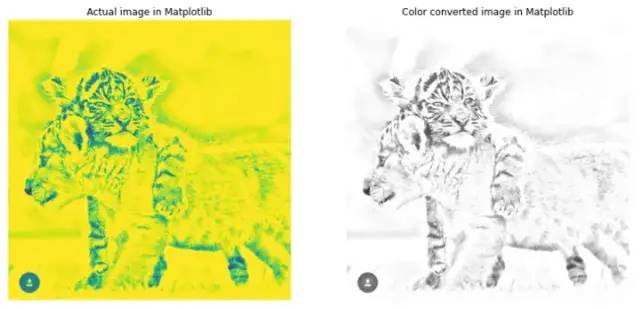
第 7 步:使用 Matplotlib 将其与原始图像一起显示
正如我已经提到的,由于我们在这里使用 Matplotlib 并排显示图像,因此我们需要转换原始图像和素描图像。
这是因为,OpenCV 使用BGR配色方案,而 matplotlib 使用RGB配色方案。素描图片也一样。
plt.figure(figsize=(14,7))

plt.subplot(1,2,1)
plt.title('Actual image in Matplotlib')
plt.imshow(image)
plt.axis('off')

plt.subplot(1,2,2)
plt.title('Color converted image in Matplotlib')
im = cv2.cvtColor(image, cv2.COLOR_BGR2RGB)
plt.imshow(im)
plt.axis('off')
plt.show()


plt.figure(figsize=(14,7))
plt.subplot(1,2,1)
plt.title('Actual image in Matplotlib')
plt.imshow(sketch_img)
plt.axis('off')

plt.subplot(1,2,2)
plt.title('Color converted image in Matplotlib')
rgb_sketch=cv2.cvtColor(sketch_img, cv2.COLOR_BGR2RGB)
plt.imshow(rgb_sketch)
plt.axis('off')
plt.show()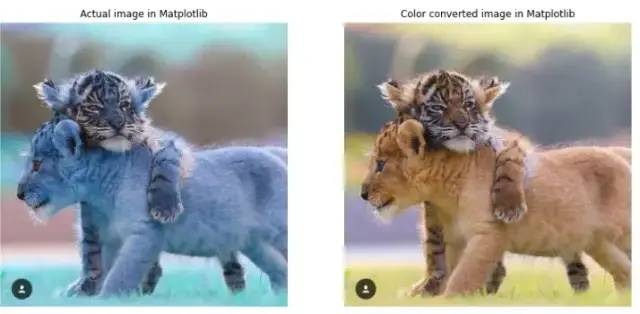
#displaying original image and pencil sketch image side by side

plt.figure(figsize=(14,7))

plt.subplot(1,2,1)
plt.imshow(im)
plt.axis('off')

plt.subplot(1,2,2)
plt.imshow(rgb_sketch)
plt.axis('off')
plt.show()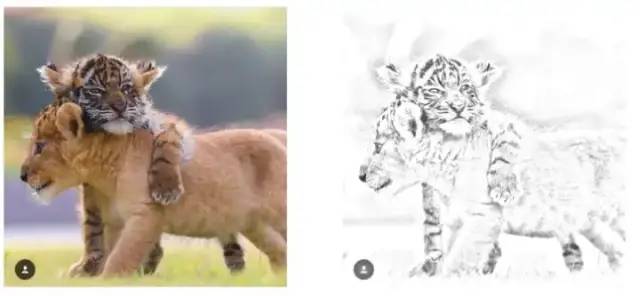
第 8 步:保存图片
终于我们到了最后一步。保存图片。imwrite用于保存图片。
# saving the picture

# Filename
filename = 'sketch.png'

cv2.imwrite(filename, sketch_img)
你可以在这里查看我的 GitHub 代码!!
https://github.com/Kavya2099/LGMVIP-DataScience/tree/main/Task%201
学到了什么
OpenCV 是初学者计算机视觉知识的重要来源
Matplotlib 始终将图像显示为 BGR ,openCV 以 RGB 配色方案显示图像
应根据图像大小使用高斯模糊中的内核大小。如果图像尺寸较大,则内核尺寸应具有较高的值
接下来要尝试的事情!
铅笔同时绘制多个图像
在模糊图像中尝试中值模糊而不是高斯模糊
在 Numpy 中使用 concat 方法并排显示图像而不是 Matplotlib
参考
https://towardsdatascience.com/generate-pencil-sketch-from-photo-in-python-7c56802d8acb
https://stackoverflow.com/questions/19580102/inverting-image-in-python-with-opencv
https://www.askpython.com/python/examples/images-to-pencil-sketch
https://pyimagesearch.com/2021/04/28/opencv-smoothing-and-blurring/#:~:text=To%20average%20blur%20an%20image,image%20with%20increasing%20sizes%20kernels
☆ END ☆
如果看到这里,说明你喜欢这篇文章,请转发、点赞。微信搜索「uncle_pn」,欢迎添加小编微信「 woshicver」,每日朋友圈更新一篇高质量博文。
↓扫描二维码添加小编↓