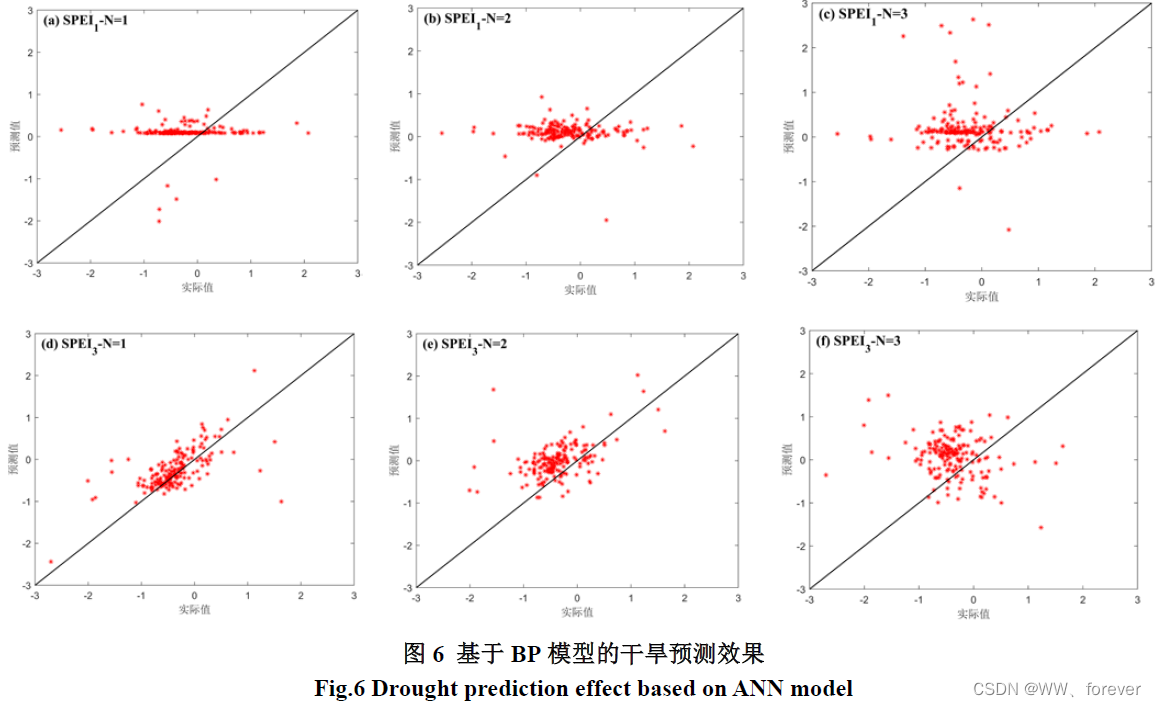
本案例采用SPEI干旱指数,构建ANN和BP神经网络预测模型,并开展1~3个月预见期的干旱预测,对比分析干旱预测模型的适用性,为流域干旱预警和管理提供技术依据。
干旱预测
1 干旱预测方法
1.1 统计学干旱预测
根据历史降水或气温等时间序列建立预测对象与预测因子间统计关系的干旱预测,称之为统计学干旱预测。此类方法的本质是基于历史气象、水文资料的内在统计关系,建立预测对象与预测因子之间的函数关系以对未来干旱进行预测。
常用的统计学干旱预测方法有:
- 回归分析
- 时间序列分析
- 灰色系统
- 马尔科夫链
- 神经网络
- 支持向量机等
1.2 动力学干旱预测
第二类是基于全球或区域气候模式,经过偏差校正和降尺度处理后得到未来气候变化趋势,然后结合干旱指数对未来干旱状况进行预测。其中,在预测农业干旱和水文干旱时需要驱动水文模型,常用的模型有可变下渗容量模型(Variable Infiltration Capacity, VIC)、 SWAT(Soil and Water Assessment Tool)模型以及新安江模型等。这类干旱预测方法称之为动力学干旱预测。
2 案例
2.1 基于人工神经网络的干旱预测
采用SPEI干旱指数,构建ANN和BP神经网络预测模型,并开展1~3个月预见期的干旱预测,对比分析干旱预测模型的适用性,为流域干旱预警和管理提供技术依据。技术路线如图1所示。

2.1.1 模型构建

2.1.2 不同时间尺度的SPEI

2.1.3 模型预测结果

2.1.4 MATLAB相关代码
SPEI计算代码:
clc
close all
clear
%% 导入降水和气温数据
yearStart =1960;
yearEnd = 2020;
N_day = datenum(2020,12,31)-datenum(1960,1,1)+1;
ii = datenum('01-Jan-1960');
jj = datenum('31-Dec-2020');

%% 计算潜在蒸散发PET
% 方法1:Thornthwaite法
PET = GetPE_Thornthwaite( DataMonthMean{3,1} , DataMonthMean{2,1});

%% 计算1960-2020年各月SPEI指数
SPEI1= GetSPEI( P(:) , PET(:) , 1 );
SPEI3 = GetSPEI( P(:) , PET(:)  , 3 );
SPEI6 = GetSPEI( P(:) , PET(:)  , 6 );
SPEI12 = GetSPEI( P(:) , PET(:)  , 12 );

%% 绘制各尺度SPEI值
figure(2)
SPEI1Plot = SPEI1(end-720+1:end,1);
subplot(4,1,1)
hold on;box on;
n1=find(SPEI1Plot>=0); %找出大于或等于0的元素的序号
n2=find(SPEI1Plot<0);  %找出小于0的元素的序号
h(1) = bar(n1,SPEI1Plot(n1),1,'FaceColor',[0.2902 0.4392 0.5451],'EdgeColor',[0.2902 0.4392 0.5451],'FaceAlpha',0.8); % [0.2902 0.4392 0.5451] 'b'
h(2) = bar(n2,SPEI1Plot(n2),1,'FaceColor',[0.6471 0.1647 0.1647],'EdgeColor',[0.6471 0.1647 0.1647],'FaceAlpha',0.8); % [0.6471 0.1647 0.1647] 'r'
set(gca, 'XTick', [1:10*12:60*12],'XTickLabel',{'1961','1971','1981','1991','2001','2011'})
text( 'string',"(a) SPEI_1", 'Units','normalized','position',[0.02,0.75],  'FontSize',14,'FontWeight','Bold','FontName','Times New Roman');
set(gca,'FontSize',12,'Fontname', 'Times New Roman');

SPEI3Plot = SPEI3(end-720+1:end,1);
subplot(4,1,2)
hold on;box on;
n3=find(SPEI3Plot>=0); %找出大于或等于0的元素的序号
n4=find(SPEI3Plot<0);  %找出小于0的元素的序号
h(3) = bar(n3,SPEI3Plot(n3),1,'FaceColor',[0.2902 0.4392 0.5451],'EdgeColor',[0.2902 0.4392 0.5451],'FaceAlpha',0.8); % [0.2902 0.4392 0.5451] 'b'
h(4) = bar(n4,SPEI3Plot(n4),1,'FaceColor',[0.6471 0.1647 0.1647],'EdgeColor',[0.6471 0.1647 0.1647],'FaceAlpha',0.8); % [0.6471 0.1647 0.1647] 'r'
set(gca, 'XTick', [1:10*12:60*12],'XTickLabel',{'1961','1971','1981','1991','2001','2011'})
text( 'string',"(b) SPEI_3", 'Units','normalized','position',[0.02,0.75],  'FontSize',14,'FontWeight','Bold','FontName','Times New Roman');
set(gca,'FontSize',12,'Fontname', 'Times New Roman');

SPEI6Plot = SPEI6(end-720+1:end,1);
subplot(4,1,3)
hold on;box on;
n5=find(SPEI6Plot>=0); %找出大于或等于0的元素的序号
n6=find(SPEI6Plot<0);  %找出小于0的元素的序号
h(5) = bar(n5,SPEI6Plot(n5),1,'FaceColor',[0.2902 0.4392 0.5451],'EdgeColor',[0.2902 0.4392 0.5451],'FaceAlpha',0.8); % [0.2902 0.4392 0.5451] 'b'
h(6) = bar(n6,SPEI6Plot(n6),1,'FaceColor',[0.6471 0.1647 0.1647],'EdgeColor',[0.6471 0.1647 0.1647],'FaceAlpha',0.8); % [0.6471 0.1647 0.1647] 'r'
set(gca, 'XTick', [1:10*12:60*12],'XTickLabel',{'1961','1971','1981','1991','2001','2011'})
text( 'string',"(c) SPEI_6", 'Units','normalized','position',[0.02,0.75],  'FontSize',14,'FontWeight','Bold','FontName','Times New Roman');
set(gca,'FontSize',12,'Fontname', 'Times New Roman');

SPEI12Plot = SPEI12(end-720+1:end,1);
subplot(4,1,4)
hold on;box on;
n7=find(SPEI12Plot>=0); %找出大于或等于0的元素的序号
n8=find(SPEI12Plot<0);  %找出小于0的元素的序号
h(7) = bar(n7,SPEI12Plot(n7),1,'FaceColor',[0.2902 0.4392 0.5451],'EdgeColor',[0.2902 0.4392 0.5451],'FaceAlpha',0.8); % [0.2902 0.4392 0.5451] 'b'
h(8) = bar(n8,SPEI12Plot(n8),1,'FaceColor',[0.6471 0.1647 0.1647],'EdgeColor',[0.6471 0.1647 0.1647],'FaceAlpha',0.8); % [0.6471 0.1647 0.1647] 'r'
set(gca, 'XTick', [1:10*12:60*12],'XTickLabel',{'1961','1971','1981','1991','2001','2011'})
text( 'string',"(d) SPEI_1_2", 'Units','normalized','position',[0.02,0.75],  'FontSize',14,'FontWeight','Bold','FontName','Times New Roman');
set(gca,'FontSize',12,'Fontname', 'Times New Roman');

function ET = GetPE_Thornthwaite( T ,N)
% 形式二:《五种潜在蒸散发公式在汉江流域的应用》
%------------------------------------------------------
% T为月均温度
% u为每月天数
% I为热量指数
% N为月均日照时间
% k为经验系数
k = 16;
monthAmount_Common = [31 28 31 30 31 30 31 31 30 31 30 31 ];      % 平年
monthofYear = length(monthAmount_Common);

T = max(0,T);
% 输入序列为矩阵形式
if size(T)==size(N)
    Nmonth = size(T,1)*size(T,2);
    Nyear = size(T,1);
else
    error("月均温度序列长度同月均日照时间序列长度不相等!");
end

% 计算各年份热量指数I
I = zeros(Nyear,1);
a = zeros(Nyear,1);
ET = zeros(Nyear,monthofYear);
for iyear=1:Nyear
    I(iyear) = sum(0.09*T(iyear,:).^1.5) ;
    a(iyear) = 0.016*I(iyear) +0.5;
    for imonth=1:monthofYear
        ET(iyear,imonth) = k*(10*T(iyear,imonth)/I(iyear))^a(iyear)*monthAmount_Common(imonth)*N(iyear,imonth)/360;
    end
end

%{
% 输入序列为向量形式
if length(T)==length(N)
    if rem(T,12)==0
        Nmonth = length(T);
        Nyear = T/12;
    else
        error("温度序列T并未整年数据!");
    end
else
    error("月均温度序列长度同月均日照时间序列长度不相等!");
end
%}

end


% 函数2:GetSPEI用于计算各尺度SPEI值
%-----------------------------------------------------------------------------------
% (1) Computes accumulated precipitation-ET data for the specific time scale
% (2) Computes drought indicators (SPEI)
function SPEI = GetSPEI( P , PET , scale )
% SPEI(不考虑闰年)常采用Log-logistic概率分布函数拟合降水与蒸散的差值系列
% P     降水          precipitation
% PET 潜在蒸散发 potential evapotranspiration (mm/day)
% 注:降水和蒸散发均为日尺度数据
%  scale (事件尺度): 1,3,6,12,48  月尺度

monthOfYear = 12;
if length(P)==length(PET)
else
    printf("降水和潜在蒸散发的数据长度不等!")
end

% 1) Computes accumulated precipitation-ET data for the specific time scale 计算水分亏缺量D
Data = P -PET;

A1=[];          % 初始化
for is=1:scale
    A1=[A1,Data(is:length(Data)-scale+is)];    % 按时间尺度列出数据
end
XS=sum(A1,2);        % 对A1的每行分别求和

Nlength = length(XS);
SPEI = zeros(Nlength,2);

for is=1:monthOfYear
    tind = is:monthOfYear:length(XS);
    Xn = XS(tind);                   % 对应序数
    Xnsort = sort(Xn);
    beta = GetBeta(Xnsort,length(Xnsort),0,0,0);
    par=logLogisticFit(beta);
    Gam_xs = logLogisticCDF(Xn,par);

% 2) Computes drought indicators (SPEI) 计算SPEI
    SPEI(tind,2) =  norminv( real(Gam_xs) );
    % SPEI(tind,1) = real( norminv( real(Gam_xs)) );
    SPEI(tind,1) = real( Normalize( Gam_xs) );
end

end
% ============================ SPEI 调用函数开始 ============================
% 函数1:利用矩法计算三参数Log-logistic的参数
% -------------------------------------------------------------------------------
function beta = GetBeta(series,n,A,B,isBeta)
acum=zeros(3,1);
if A==0&&B==0
    for i=1:n
        acum(1) = acum(1) + series(i);
        if isBeta==0              % compute alpha PWMs
            acum(2) = acum(2) + series(i) * (n-i) / (n-1);
            acum(3) = acum(3) + (series(i) * (n-i) * (n-i-1) / (n-1) / (n-2));
        elseif isBeta==1        % compute beta PWMs
            acum(2) = acum(2) + series(i) * (i-1) / (n-1);
            acum(3) = acum(3) + (series(i) * (i-1) * (i-2) / (n-1) / (n-2));
        end
    end
elseif A==-0.35&&B==0                 %use plotting-position (biased) estimator
    for i=1:n
        F = (i+A) / (n+B);
        acum(1) = acum(1)+series(i);
        if isBeta==0            % compute alpha PWMs
            acum(2) = acum(2)+series(i)*(1-F);
            acum(3) = acum(3)+series(i)*(1-F)*(1-F);
        elseif isBeta==1     %  compute beta PWMs
            acum(2) = acum(2)+series(i)*(F);
            acum(3) = acum(3)+series(i)*(F)*(F);
        end
    end
else
    for i=1:n
       %F = (i+A) / (n+B);
       acum(1) = acum(1)+series(i)*nchoosek(n-i,0)/nchoosek(n-1,0);
       acum(2) = acum(2)+series(i)*nchoosek(n-i,1)/nchoosek(n-1,1);
       acum(3) = acum(3)+series(i)*nchoosek(n-i,2)/nchoosek(n-1,2);
     end
end
beta(1) = acum(1) / n;
beta(2) = acum(2) / n;
beta(3) = acum(3) / n;
end

% 函数2:利用矩法计算三参数Log-logistic的参数
% -------------------------------------------------------------------------------
function logLogisticParams=logLogisticFit(beta)

% estimate gamma parameter 形状参数β
logLogisticParams(3) = (2*beta(2)-beta(1)) / (6*beta(2)-beta(1)-6*beta(3));

g1 = exp(gammaLn(1+1/logLogisticParams(3)));
g2 = exp(gammaLn(1-1/logLogisticParams(3)));

% estimate alpha parameter 尺度参数α
logLogisticParams(2) = (beta(1)-2*beta(2))*logLogisticParams(3) / (g1*g2);

% estimate beta parameter 源参数γ
logLogisticParams(1) = beta(1) - logLogisticParams(2)*g1*g2;
end

% 函数3:利用三参数Log-logistic的参数,计算累积概率分布CDF
% -------------------------------------------------------------------------------
function M=logLogisticCDF(value,params)
% logLogistic分布
    M=1./(1+(params(2)./(value-params(1))).^params(3));
end

% 函数4:求gammaΓ分布
% -------------------------------------------------------------------------------
function z=gammaLn(xx)
cof=[76.18009172947146,-86.50532032941677,24.01409824083091,-1.231739572450155,0.1208650973866179e-2,-0.5395179384953e-5];
y = xx;
x = xx;
tmp = x + 5.5;
tmp = tmp-(x+0.5) * log(tmp);
ser = 1.000000000190015;
for j=1:6
    y=y+1;
    ser=ser+cof(j)/y;
end
z=-tmp+log(2.5066282746310005*ser/x);
end

% 函数5:standardGaussianInvCDF通过变换,将累计概率密度CDF转化为标准正态分布
% -------------------------------------------------------------------------------
function resul = Normalize(prob)
% X 输入序列概率值
n = length(prob);      % 序列长度

% 常数
C= [2.515517,0.802853,0.010328];
d= [0,1.432788,0.189269,0.001308];

resul =zeros(n,1);
for in=1:n
    if prob(in)<=0.5
        W = sqrt(-2*log(prob(in)));
    else
        W =sqrt(-2*log(1-prob(in)));
    end
    WW = W*W;
    WWW = WW*W;
    resul(in) = W - (C(1) + C(2)*W + C(3)*WW) / (1 + d(2)*W + d(3)*WW + d(4)*WWW);

    if prob(in)<0.5
        resul(in) = -resul(in);
    end
end

end
% ============================ SPEI 调用参数结束 ============================
BP神经网络分析代码:
clc
close all
clear
%% 导入数据
% 原始数据
load('dataTrainOutput.mat')
load('dataTrainInput.mat')
load('dataTestOutput.mat')
load('dataTestInput.mat')

% 预见期 N
N = [1 2 3];
trainLength = length(dataTrainOutput{1,1});
testLength = length(dataTestOutput{1,1});

%% 利用BP神经网络进行预测
% 第一组 SPEI1 N=1
input_train = dataTrainInput{1,1}(:,1:10)';
output_train = dataTrainOutput{1,1}(:,1)';
input_test = dataTestInput{1,1}(:,1:10)';
output_test = dataTestOutput{1,1}(:,1)';
% 训练数据归一化
[inputn,inputps] = mapminmax(input_train);
[outputn,outputps] = mapminmax(output_train);
% 构建BP神经网络
net=newff(inputn,outputn,5);
% 网络参数配置
net.trainParam.epochs=1000;
net.trainParam.lr=0.05;
net.trainParam.goal=0.00004;
net.divideFcn = '';
% 训练
net=train(net,inputn,outputn);
% 预测数据归一化:各个维度的数据在-1到1之间,均值为0
inputn_test=mapminmax('apply',input_test,inputps);
% BP神经网络预测输出
an=sim(net,inputn_test);
% 输出结果反归一化
BPoutput1=mapminmax('reverse',an,outputps);

% 构建BP神经网络
net=newff(inputn,outputn,4);
% 网络参数配置
net.trainParam.epochs=500;
net.trainParam.lr=0.05;
net.trainParam.goal=0.00004;
net.divideFcn = '';
% 训练
net=train(net,inputn,outputn);
% 预测数据归一化:各个维度的数据在-1到1之间,均值为0
inputn_test=mapminmax('apply',input_test,inputps);
% BP神经网络预测输出
an=sim(net,inputn_test);
% 输出结果反归一化
BPoutput11=mapminmax('reverse',an,outputps);

% 结果整理
figure(1)
hold on;box on;
h(1) = plot(output_test,'-o','linewidth',1.5,'markersize',5,'color',[106 90 205]/255);
h(2) = plot(BPoutput11,'k-+','linewidth',1.5,'markersize',5);
h(3) = plot(BPoutput1,'r-*','linewidth',1.5,'markersize',2);
hl = legend(h([1 2 3]),"实际值","ANN","BP");
set(hl,'Box','off','Location','northeast','NumColumns',3);
xlabel("时间(年.月)")
ylabel("SPEI_1")
set(gca,'ylim',[-4 3 ]);
set(gca, 'XTick', [ 6, 66, 126, 174],'XTickLabel',{'2006.6','2011.6','2016.6','2020.6'})
text( 'string',"(a) SPEI_1-N=1", 'Units','normalized','position',[0.02,0.95],  'FontSize',14,'FontWeight','Bold','FontName','Times New Roman');
%set(gca,'FontSize',12,'Fontname', 'Times New Roman');

% 计算相应指标
R2(1,1) = GetR2(output_test,BPoutput11);
R2(1,2) = GetR2(output_test,BPoutput1);
RMSE(1,1) =GetRMSE(output_test,BPoutput11);
RMSE(1,2) =GetRMSE(output_test,BPoutput1);

figure(2)
hold on;box on;
plot(output_test,BPoutput11,'r*','markersize',5);
plot([-3 3],[-3 3],'k-','linewidth',1)
axis([-3 3 -3 3]);
xlabel("实际值")
ylabel("预测值")
text( 'string',"(a) SPEI_1-N=1", 'Units','normalized','position',[0.02,0.95],  'FontSize',14,'FontWeight','Bold','FontName','Times New Roman');

figure(3)
hold on;box on;
plot(output_test,BPoutput1,'k+','markersize',5);
plot([-3 3],[-3 3],'k-','linewidth',1)
axis([-3 3 -3 3]);
xlabel("实际值")
ylabel("预测值")
text( 'string',"(a) SPEI_1-N=1", 'Units','normalized','position',[0.02,0.95],  'FontSize',14,'FontWeight','Bold','FontName','Times New Roman');

%% 调用函数
% 计算决定系数R2
function Result = GetR2(X,Y)

if length(X)==length(Y)
    n = length(X);
else
    error("输入X和Y序列不等!")
end
S1 = ( n*sum( X.*Y)-sum(X)*sum(Y))^2;
S2 = (n-1)*sum(X.^2);
S3 = (n-1)*sum(Y.^2);
Result = S1/S2/S3;

end

% 计算均方根误差RSME
function Result = GetRMSE(X,Y)

if length(X)==length(Y)
    n = length(X);
else
    error("输入X和Y序列不等!")
end
Result = sqrt( sum( (X-Y).^2 )/n);

end
参考
1.博士论文-D2022-气候变化下长江流域未来径流与旱涝变化特征研究-岳艳琳


