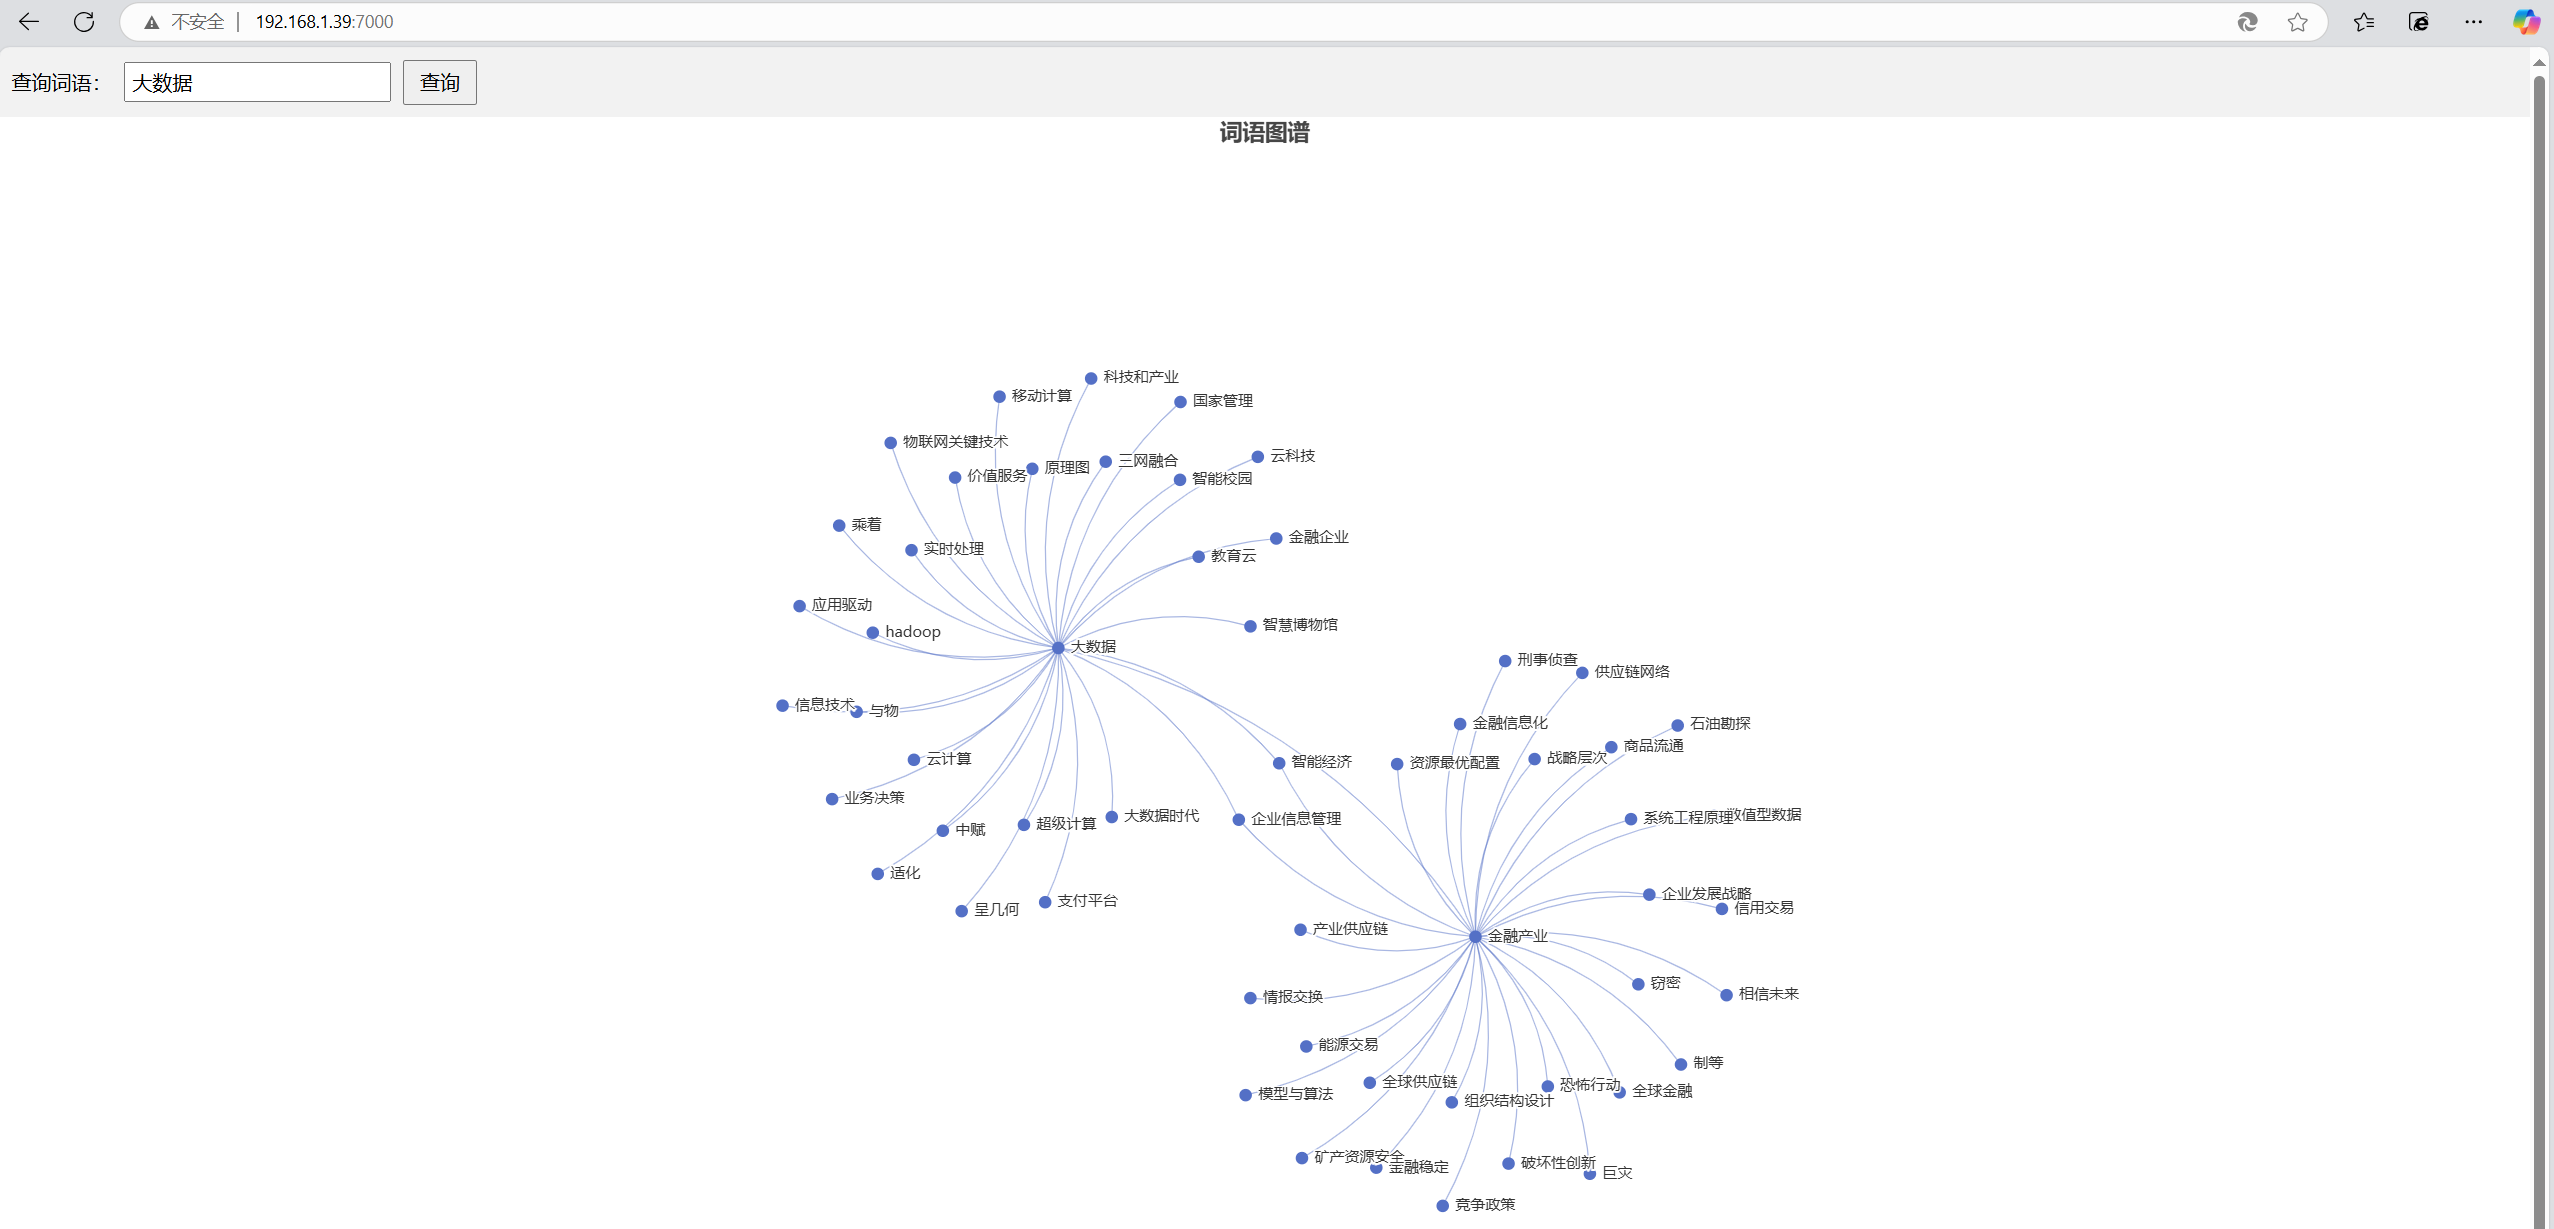
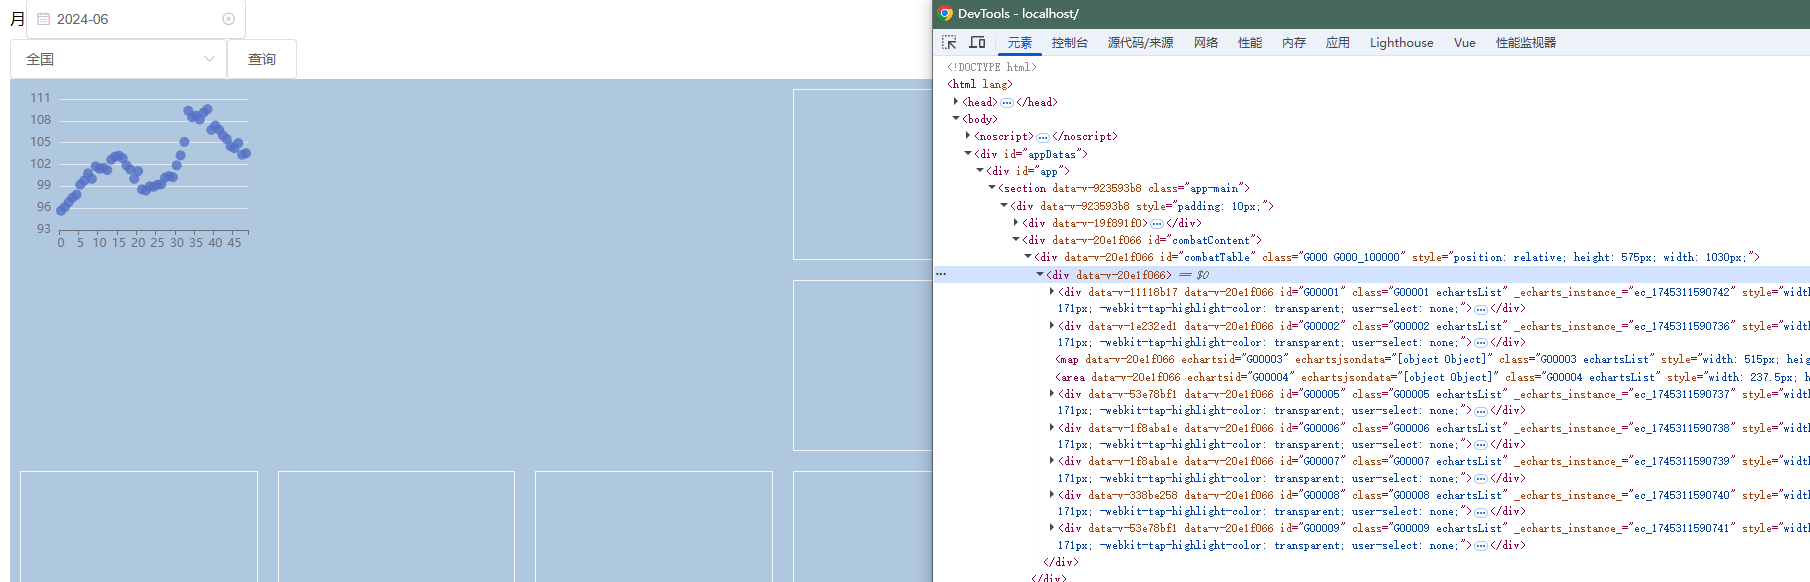
实现结果
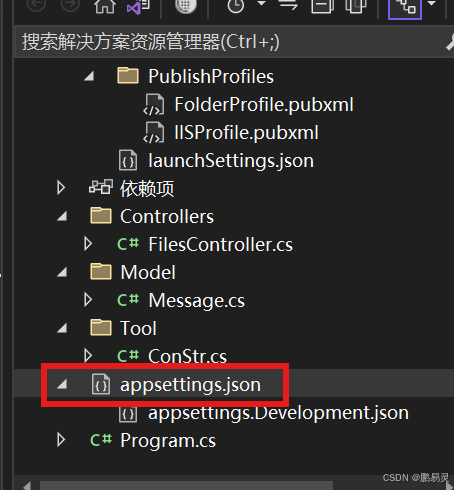
项目结构
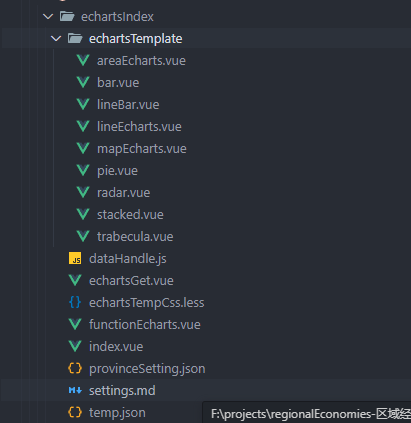
根据我的目录和代码 复制到项目中
echartsTemplate-echarts图形
pie实例
<template>
	<div :id="echartsId"></div>
</template>
<script>
export default {
	name: '',
	components: {},
	mixins: [],
	props: ['echartsId', 'echartsJsonData'],
	data() {
		return {};
	},
	computed: {},
	watch: {
		echartsJsonData: {
			handler(to) {
				// console.log(to, 'to');

				if (to) {
					let _this = this;
					this.$nextTick(() => {
						_this.getEcharts();
					});
				}
			},
			immediate: true,
		},
	},
	mounted() {},
	methods: {
		getEcharts() {
			const pieCharts = this.$echarts.init(
				document.querySelector('#' + this.echartsId)
			);
			let chartData = [
				95.65, 96.15, 96.82, 97.45, 97.85, 99.23, 99.79, 100.77, 100.03,
				101.75, 101.42, 101.54, 101.24, 102.65, 103.08, 103.22, 102.87,
				101.86, 101.3, 100.04, 101.08, 98.58, 98.42, 99, 98.94, 99.21,
				99.29, 100.2, 100.41, 100.26, 101.88, 103.26, 105.1, 109.39,
				108.48, 108.71, 108.18, 109.15, 109.6, 106.76, 107.35, 106.77,
				105.99, 105.48, 104.52, 104.25, 104.94, 103.35, 103.55,
			];
			const xData = Array.from(
				{ length: chartData.length },
				(_, index) => index
			);
			let options = {
				tooltip: {
					trigger: 'axis',
					axisPointer: {
						type: 'cross',
					},
				},
				grid: {
					top: 10,
					left: 10,
					bottom: 10,
					right: 10,
					containLabel: true,
				},
				xAxis: {
					type: 'category',
					data: xData,
				},
				yAxis: {
					scale: true,
				},
				series: [
					{
						symbolSize: 10,
						data: xData.map((x, i) => [x, chartData[i]]),
						type: 'scatter',
					},
				],
			};
			// 渲染 echarts
			pieCharts.setOption(options, true);
			pieCharts.resize();
		},
	},
};
</script>
<style lang="" scoped></style>
dataHandle.js-数据处理方法
export const handleSlpmle = (data) => {
	// console.log(data);
	return data;
};
echartsGet.vue-模板调用,图形模板根据配置文件调用
<template>
	<div>
		<!-- 如果echartsJsonSet useFlag等于true的话那就是省份的特殊样式-->
		<div
			v-if="echartsJsonSet"
			style="position: relative"
			:style="{
				height: echartsJsonSet.height,
				width: echartsJsonSet.width,
			}"
			id="combatTable"
			:class="
				echartsJsonSet.useFlag
					? `${echartsJsonSet.tempId} ${echartsJsonSet.tempId}_${echartsJsonSet.value}`
					: `${echartsJsonSet.tempId}`
			"
		>
			<!-- 使用 component 标签配合 is 属性 -->
			<div v-if="echartsJsonSet">
				<component
					v-for="(item, index) in echartsJsonSet.echartsList"
					:key="index"
					:is="item.type"
					:echartsId="item.tempName"
					:echartsJsonData="item"
					:style="{
						width: item.width,
						height: item.height,
					}"
					:class="`${item.tempName} echartsList`"
				></component>
			</div>
		</div>
	</div>
</template>
<script>
import pie from './echartsTemplate/pie.vue';
import areaEcharts from './echartsTemplate/areaEcharts.vue';
import bar from './echartsTemplate/bar.vue';
import lineBar from './echartsTemplate/lineBar.vue';
import lineEcharts from './echartsTemplate/lineEcharts.vue';
import mapEcharts from './echartsTemplate/mapEcharts.vue';
import radar from './echartsTemplate/radar.vue';
import stacked from './echartsTemplate/stacked.vue';
import trabecula from './echartsTemplate/trabecula.vue';
export default {
	name: '',
	components: {
		pie,
		areaEcharts,
		bar,
		lineBar,
		lineEcharts,
		mapEcharts,
		radar,
		stacked,
		trabecula,
	},
	mixins: [],
	// 'echartsJson'标准模板,默认值 'areaEchartsJson'地区模板,如果某个地区的某个图需要特殊方式显示
	props: ['echartsJson'],
	data() {
		return { echartsJsonSet: null };
	},
	computed: {},
	watch: {
		echartsJson: {
			handler(to) {
				if (to) {
					console.log(to, 'ttotooto');

					this.echartsJsonSet = to;
				}
			},
			immediate: true,
		},
	},
	mounted() {},
	methods: {},
};
</script>
<style lang="" scoped></style>
echartsTempCss.less模板css,根据规则生成的class名
.G000 {
	background: rgba(175, 199, 223);
	.echartsList {
		position: absolute;
	}
	.G00001 {
		top: 10px;
		left: 10px;
	}
	.G00002 {
		top:201px;
		left: 10px;
	}
	.G00003 {
		top: 10px;
		left: 267.5px;
	}
	.G00004 {
		top: 392px;
		left: 10px;
		border: 1px solid rgb(245, 246, 247);
	}
	.G00005 {
		top: 392px;
		left: 267.5px;
		border: 1px solid rgb(245, 246, 247);
	}
	.G00006 {
		top: 392px;
		left: 525px;
		border: 1px solid rgb(245, 246, 247);
	}
	.G00007 {
		top: 10px;
		left: 782.5px;
		border: 1px solid rgb(245, 246, 247);
	}
	.G00008 {
		top:201px;
		left: 782.5px;
		border: 1px solid rgb(245, 246, 247);
	}
	.G00009 {
		top: 392px;
		left: 782.5px;
		border: 1px solid rgb(245, 246, 247);
	}
}
functionEcharts.vue-操作按钮
<template>
	<div>
		<div class="block">
			<span class="demonstration">月</span>
			<el-date-picker
				v-model="timeValue"
				type="month"
				placeholder="选择月"
			>
			</el-date-picker>
		</div>
		<el-select v-model="selectValue" placeholder="请选择">
			<el-option
				v-for="item in option"
				:key="item.value"
				:label="item.label"
				:value="item.value"
			>
			</el-option>
		</el-select>
		<el-button @click="query">查询</el-button>
		<!-- <div @click="generateAndDownloadReport">下载</div> -->
	</div>
</template>
<script>
import html2canvas from 'html2canvas';
import provinceSetting from './provinceSetting.json';
export default {
	name: '',
	components: {},
	mixins: [],
	props: {},
	data() {
		return {
			selectValue: '100000',
			timeValue: '2024-06',
			option: provinceSetting,
		};
	},
	computed: {},
	watch: {},
	mounted() {},
	methods: {
		query() {
			this.$eventBus.$emit('realDatas', {
				time: this.formatDate(this.timeValue),
				province: this.selectValue,
			});
		},
		formatDate(dateString) {
			try {
				const date = new Date(dateString);
				return [
					date.getFullYear(),
					(date.getMonth() + 1).toString().padStart(2, '0'),
				].join('');
			} catch (e) {
				return '格式错误';
			}
		},
		generateAndDownloadReport() {
			try {
				const targetElement = document.getElementById('combatContent');

				html2canvas(targetElement, {
					scale: 1, // 提高分辨率
					backgroundColor: '#ffffff', // 背景色(可自定义)
					useCORS: true, // 如果有加载图片或图标
				}).then((canvas) => {
					// 生成图片链接
					const link = document.createElement('a');
					link.download = 'combat-report.png';
					link.href = canvas.toDataURL('image/png', 0.0);

					// 下载图片
					document.body.appendChild(link);
					link.click();
					document.body.removeChild(link);
				});
			} catch (error) {
				console.error('生成报告失败:', error);
				alert('下载失败:' + error.message);
			}
		},
	},
};
</script>
<style lang="" scoped></style>
index.vue-入口页面
<template>
	<div style="padding: 10px">
		<paramEcharts v-if="functionFlag"></paramEcharts>
		<echartsGet id="combatContent" :echartsJson="echartsJson"></echartsGet>
	</div>
</template>
<script>
import echartsTempJson from './temp.json';
import provinceSetting from './provinceSetting.json';
import paramEcharts from './functionEcharts.vue';
import echartsGet from './echartsGet.vue';
import { handleSlpmle } from './dataHandle.js';

export default {
	name: '',
	components: { echartsGet, paramEcharts },
	mixins: [],
	props: {},
	data() {
		return {
			functionFlag: true,
			echartsJson: null,
			// echartsTempJson: null,
			time: '202406',
			province: '100000',
			echartsListData: {},
		};
	},
	computed: {},
	watch: {},
	mounted() {
		if (this.$route.query.province) {
			//根据省份信息去查provinceSetting配置信息,然后根据里面的模板id去查temp公共模板配置
			this.functionFlag = false;
			//如果传了模板id就不显示参数按钮
			//在后台调用echarts模板时 需要时间,省份之类的参数,前端参数按钮也需要
			//应该从省份区模板才对

			// this.echartsTempJson = echartsTempJson[graphId];
			this.getEchartsData('202406', this.$route.query.province);
		} else {
			this.functionFlag = true;
			// this.time = '2024';
			// this.province = '100000';
			this.getEchartsData('202406', '100000'); //默认
		}
		let _this = this;
		this.$eventBus.$on('realDatas', function (res) {
			// console.log(res);
			// _this.areaEchartsJson = res.alldata;
			_this.getEchartsData(res.time, res.province);
		});
	},
	methods: {
		//根据传来的tiem和province去查询接口
		getEchartsData(time, province) {
				let tempC = {};

			// 查找对应的省份模板配置
			for (const elementProvince of provinceSetting) {
				if (province !== elementProvince.value) continue;

				// 遍历模板配置(公共模板)
				for (const key in echartsTempJson) {
					if (elementProvince.tempId !== key) continue;

					tempC = { ...echartsTempJson[key] }; // 深拷贝公共模板
					tempC.value = elementProvince.value;
					tempC.useFlag = !!elementProvince.useFlag; // 是否使用地区特殊样式

					// 遍历地区模板中的 echartsList 并覆盖公共模板对应项
					for (const elementEchartsList of elementProvince.echartsList) {
						for (let j = 0; j < tempC.echartsList.length; j++) {
							if (
								elementEchartsList.tempName ===
								tempC.echartsList[j].tempName
							) {
								if (elementEchartsList.useFlag) {
									tempC.echartsList[j] = {
										...elementEchartsList,
									};
								}
								if (elementEchartsList.useFunction) {
									tempC.echartsList[j].useFunction =
										elementEchartsList.useFunction;
								}
							}
						}
					}
				}
			}

			// 构造接口参数
			let params = {
				dateStr: time,
				regionCode: province,
				topicId: tempC.tempId,
			};
			//调用接口传数据
			let echartsListData = {
				G0001_G000001: [
					{ name: 1111, value: 2222 },
					{ name: 1111, value: 2222 },
					{ name: 1111, value: 2222 },
					{ name: 2222, value: 2222 },
					{ name: 2222, value: 2222 },
				],
				G0001_G000002: [
					{ name: 4444, value: 3333 },
					{ name: 4444, value: 3333 },
					{ name: 4444, value: 3333 },
					{ name: 3333, value: 3333 },
					{ name: 3333, value: 3333 },
					{ name: 3333, value: 3333 },
				],
			};
			for (const key in echartsListData) {
				for (let index = 0; index < tempC.echartsList.length; index++) {
					const elements = tempC.echartsList[index];

					// 通过模板名匹配数据键名(去掉前缀)
					if (elements.tempName === key.split('_')[1]) {
						let funcName = elements.useFunction;
						console.log(funcName);

						// 动态调用指定的数据处理函数
						let thisData = funcName
							? handleFns[funcName](echartsListData[key])
							: handleFns.handleSlpmle(echartsListData[key]);

						// 设置处理后的数据
						tempC.echartsList[index].optionData = thisData;
					}
				}
			}
			this.echartsJson = tempC;
		},
	},
};
</script>
<style lang="less">
@import './echartsTempCss.less';
</style>
provinceSetting.json-根据省份分别显示模板(强化公共模板)
[
	{
		"value": "100000",
		"label": "全国",
		"realValue": ["100000"],
		"tempId": "G000",
		"useFlag": true,
		"echartsList": [
			{
				"useFlag": false,
				"tempName": "G00001",
				"type": "pie",
				"width": "300px",
				"height": "400px"
			},
			{ "tempName": "G00002", "type": "pie" },
			{ "tempName": "G00003", "type": "pie" },
			{ "tempName": "G00004", "type": "pie" },
			{ "tempName": "G00005", "type": "pie" },
			{ "tempName": "G00006", "type": "pie" },
			{ "tempName": "G00007", "type": "pie" },
			{ "tempName": "G00008", "type": "pie" },
			{ "tempName": "G00009", "type": "pie" }
		]
	},
	{
		"value": "100001",
		"label": "中部地区",
		"tempId": "G0003",
		"realValue": [
			"140000",
			"340000",
			"360000",
			"410000",
			"420000",
			"430000"
		],
		"echartsList": [
			{
				"useFlag": false,
				"tempName": "G000301"
			}
		]
	}
]
temp.json-公共模板
{
	"G000": {
		"name": "全国指标速览",
		"show": true,
		"tempId": "G000",
		"width": "1030px",
		"height": "575px",
		"echartsList": [
			{
				"tempName": "G00001",
				"type": "pie",
				"width": "237.5px",
				"height": "171px",
				"useFunction": "handleSlpmle"
			},
			{
				"tempName": "G00002",
				"type": "radar",
				"width": "237.5px",
				"height": "171px"
			},
			{
				"tempName": "G00003",
				"type": "map",
				"width": "515px",
				"height": "382px"
			},
			{
				"tempName": "G00004",
				"type": "area",
				"width": "237.5px",
				"height": "171px"
			},
			{
				"tempName": "G00005",
				"type": "lineEcharts",
				"width": "237.5px",
				"height": "171px"
			},
			{
				"tempName": "G00006",
				"type": "bar",
				"width": "237.5px",
				"height": "171px"
			},
			{
				"tempName": "G00007",
				"type": "bar",
				"width": "237.5px",
				"height": "171px"
			},
			{
				"tempName": "G00008",
				"type": "trabecula",
				"width": "237.5px",
				"height": "171px"
			},
			{
				"tempName": "G00009",
				"type": "lineEcharts",
				"width": "237.5px",
				"height": "171px"
			}
		]
	},
	"G0003": {
		"name": "省份",
		"show": true,
		"tempId": "G0003",
		"width": "1030px",
		"height": "575px",
		"echartsList": [
			{
				"tempName": "G000301",
				"type": "map",
				"width": "237.5px",
				"height": "171px"
			}
		]
	}
}