根据指数做波段年化利率分析
股票投资,是众多投资方式中的一种。然而,每个人有不同的炒股方式,对股票不同的操作也会获得不同的收益/损失。作为“金融消费者”,如何做好自己在股票中的消费行为,是一门巨大的学问。这里根据指数做波段操作下,进行年化利率计算及分析。通过数据来看,不同买卖下年化收益率的差别。
安装依赖
# 安装 efinance
# !pip install efinance
获取上证指数历史行情数据
import efinance as ef
import datetime
from tqdm import tqdm
import numpy as np
import pandas as pd


# 股票代码
stock_code = '上证指数'

# 这里取10年的间隔作为基准,抛弃过早的数据
delta_year=10
today = datetime.date.today()
end = today.strftime("%Y%m%d")
beg = today.replace(year=today.year-delta_year).strftime("%Y%m%d")

# 获取上证指数历史行情数据
df = ef.stock.get_quote_history(stock_code, beg = beg, end = end)
df
/opt/conda/envs/python35-paddle120-env/lib/python3.10/site-packages/tqdm/auto.py:21: TqdmWarning: IProgress not found. Please update jupyter and ipywidgets. See https://ipywidgets.readthedocs.io/en/stable/user_install.html
  from .autonotebook import tqdm as notebook_tqdm
| 股票名称 | 股票代码 | 日期 | 开盘 | 收盘 | 最高 | 最低 | 成交量 | 成交额 | 振幅 | 涨跌幅 | 涨跌额 | 换手率 | |
|---|---|---|---|---|---|---|---|---|---|---|---|---|---|
| 0 | 上证指数 | 000001 | 2014-10-08 | 2368.58 | 2382.79 | 2382.79 | 2354.29 | 204397327 | 1.803376e+11 | 1.21 | 0.80 | 18.92 | 0.44 |
| 1 | 上证指数 | 000001 | 2014-10-09 | 2383.86 | 2389.37 | 2391.35 | 2367.11 | 235920010 | 2.002718e+11 | 1.02 | 0.28 | 6.58 | 0.51 |
| 2 | 上证指数 | 000001 | 2014-10-10 | 2380.75 | 2374.54 | 2386.28 | 2365.07 | 224671127 | 1.922482e+11 | 0.89 | -0.62 | -14.83 | 0.48 |
| 3 | 上证指数 | 000001 | 2014-10-13 | 2366.43 | 2366.01 | 2366.86 | 2341.12 | 200899315 | 1.754251e+11 | 1.08 | -0.36 | -8.53 | 0.43 |
| 4 | 上证指数 | 000001 | 2014-10-14 | 2362.80 | 2359.48 | 2380.51 | 2349.19 | 196831419 | 1.701601e+11 | 1.32 | -0.28 | -6.53 | 0.42 |
| ... | ... | ... | ... | ... | ... | ... | ... | ... | ... | ... | ... | ... | ... |
| 2427 | 上证指数 | 000001 | 2024-09-25 | 2901.42 | 2896.31 | 2952.45 | 2889.05 | 568259816 | 5.166981e+11 | 2.21 | 1.16 | 33.18 | 1.23 |
| 2428 | 上证指数 | 000001 | 2024-09-26 | 2893.75 | 3000.95 | 3000.95 | 2889.01 | 576319261 | 5.246691e+11 | 3.86 | 3.61 | 104.64 | 1.24 |
| 2429 | 上证指数 | 000001 | 2024-09-27 | 3049.10 | 3087.53 | 3087.53 | 3017.45 | 492287163 | 4.806126e+11 | 2.34 | 2.89 | 86.58 | 1.06 |
| 2430 | 上证指数 | 000001 | 2024-09-30 | 3194.72 | 3336.50 | 3358.59 | 3153.70 | 1102337917 | 1.167773e+12 | 6.64 | 8.06 | 248.97 | 2.38 |
| 2431 | 上证指数 | 000001 | 2024-10-08 | 3674.40 | 3489.78 | 3674.40 | 3372.19 | 1313460195 | 1.510513e+12 | 9.06 | 4.59 | 153.28 | 2.83 |
2432 rows × 13 columns
# 获取上证指数10年的开盘价数据
# 作为买入卖出的价格基准
# 这里也可以采用收盘价或者其他价位
# 由于指数本身就是统计数据
# 采用任何数值都会有所偏差
# 在分析时,选用开盘价认为是一种合理的取舍
stock_data = np.array(df["开盘"])
# 给数据排个序,便于取区间
arg = stock_data.argsort()
stock_data.sort()
print(stock_data)

# 获取上证指数10年的最低最高列数据,取出来转为数组加快后续计算
stock_min = np.array(df["最低"])
stock_max = np.array(df["最高"])
stock_date = np.array(df["日期"])
[2293.57 2294.01 2303.08 ... 5143.34 5145.98 5174.42]
统计年化利率及交易周期
df_arr = []
# 跑得比较慢,要半小时左右,耐心等等吧
for i,idx in tqdm(enumerate(arg[:-1])):
    # 将开盘价作为买入价和卖出价
    purchase = stock_data[i]
    # 秉持 T+1 的原则,当天买入,只能第二天后卖出
    for sell in stock_data[i+1:]:
        # true买入,false卖出
        quote_sign = True
        period = {}
        quote_periods = []
        for index in range(idx, arg.size):
            if quote_sign and stock_min[index] <= purchase and stock_max[index] >= purchase:
                # 买入
                quote_sign = False
                period["买入日期"] = stock_date[index]
            elif not quote_sign and stock_min[index] <= sell and stock_max[index]>=sell:
                # 卖出
                quote_sign = True
                period["卖出日期"] = stock_date[index]
                quote_periods.append(period)
                period = {}
        quote_count = len(quote_periods)
        if quote_count > 0:
            profit = (sell - purchase)*quote_count/delta_year/purchase
            dic = {"买入价":purchase,"卖出价":sell,"交易次数": quote_count,"年化利率":profit, "交易周期":quote_periods}
            df_arr.append(dic)
print(len(df_arr))
2431it [16:57,  2.39it/s]

2715762
查看统计结果
profit_df = pd.DataFrame(df_arr)
profit_df
| 买入价 | 卖出价 | 交易次数 | 年化利率 | 交易周期 | |
|---|---|---|---|---|---|
| 0 | 2293.57 | 2294.01 | 1 | 0.000019 | [{'买入日期': '2014-10-27', '卖出日期': '2014-10-28'}] |
| 1 | 2293.57 | 2303.08 | 1 | 0.000415 | [{'买入日期': '2014-10-27', '卖出日期': '2014-10-28'}] |
| 2 | 2293.57 | 2322.32 | 1 | 0.001254 | [{'买入日期': '2014-10-27', '卖出日期': '2014-10-28'}] |
| 3 | 2293.57 | 2343.72 | 1 | 0.002187 | [{'买入日期': '2014-10-27', '卖出日期': '2014-10-29'}] |
| 4 | 2293.57 | 2346.05 | 1 | 0.002288 | [{'买入日期': '2014-10-27', '卖出日期': '2014-10-29'}] |
| ... | ... | ... | ... | ... | ... |
| 2715757 | 5101.44 | 5145.98 | 1 | 0.000873 | [{'买入日期': '2015-06-11', '卖出日期': '2015-06-12'}] |
| 2715758 | 5101.44 | 5174.42 | 1 | 0.001431 | [{'买入日期': '2015-06-11', '卖出日期': '2015-06-12'}] |
| 2715759 | 5143.34 | 5145.98 | 1 | 0.000051 | [{'买入日期': '2015-06-12', '卖出日期': '2015-06-15'}] |
| 2715760 | 5143.34 | 5174.42 | 1 | 0.000604 | [{'买入日期': '2015-06-12', '卖出日期': '2015-06-15'}] |
| 2715761 | 5145.98 | 5174.42 | 1 | 0.000553 | [{'买入日期': '2015-06-09', '卖出日期': '2015-06-12'}] |
2715762 rows × 5 columns
获取年化收益最大的波段
根据结果可见,买入价为2667.82,卖出价为3586.84时,10年内成交共4次,年化利率约为13.78%
profit_max = profit_df.loc[np.array(profit_df["年化利率"]).argmax()]
profit_max
买入价                                               2667.82
卖出价                                               3586.84
交易次数                                                    4
年化利率                                             0.137793
交易周期    [{'买入日期': '2014-12-02', '卖出日期': '2015-03-19'},...
Name: 279415, dtype: object
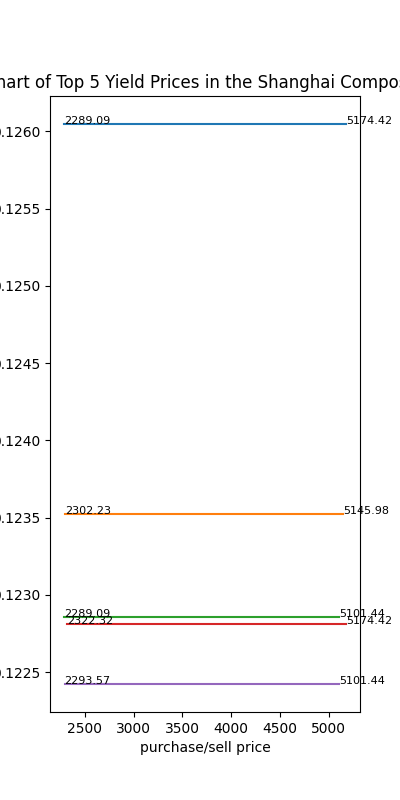
绘制一下前5收益的年化利率及交易价格区间图
由于利率相近的往往买入/卖出价格也相近,所以,设置disc来过滤一下
根据区间图可以看出,在2670左右买入,3550左右卖出,基本可以做到年化13%
import matplotlib.pyplot as plt

plt.figure(figsize=(4, 8))  # 单位为英寸

# 按年化利率进行排序并获取下标
profit_idx = np.array(profit_df["年化利率"]).argsort()[::-1]

pre_price = [0,0]
disc = 5
i = 1
for idx in profit_idx:
    if i>5:
        break
    # 收益率为y轴
    profit = profit_df["年化利率"].loc[idx]
    profit_y = [profit,profit]
    # 买入/卖出价格作为x轴
    price = [profit_df["买入价"].loc[idx], profit_df["卖出价"].loc[idx]]
    # 由于买入卖出价格可能重叠,这里过滤一下,便于更好区分
    if abs(pre_price[0]-price[0])<disc or abs(pre_price[1]-price[1])<disc:
        continue
    pre_price = price
    i+=1
    plt.plot(price, profit_y)
    plt.text(price[0], profit_y[0], f'{price[0]}',fontsize=8)
    plt.text(price[1], profit_y[1], f'{price[1]}',fontsize=8)

plt.title('Distribution Chart of Top 5 Yield Prices in the Shanghai Composite Index Band')
plt.xlabel('purchase/sell price')
plt.ylabel('annualized return')
plt.savefig('result.png')
plt.show()

去掉此次大盘的异常涨幅
today = datetime.date.today()
today = today.replace(month=today.month-1,day=20)
再来分析年化利率:
买入价 2289.09
卖出价 5174.42
交易次数 1
年化利率 0.126047
交易周期 [{‘买入日期’: ‘2014-09-23’, ‘卖出日期’: ‘2015-06-12’}]

这次,结果就存在较大问题了,因为,很难复现2015年的价格,基本不具备任何参考性
总结
炒股有风险,投资需谨慎。
此次数据分析仅作为参考,不作为任何建议。基于历史数据做的任何分析,在未来的不确定下,都会存在很多偏差,还请“金融消费者”们理性看待!!!


![【题解】【模拟】—— [NOIP2013 普及组] 表达式求值](https://i-blog.csdnimg.cn/direct/f782c1acde024adb925001c00e7952f4.jpeg#pic_center)

