
import numpy as np
import matplotlib.pyplot as plt
from matplotlib.widgets import Slider, CheckButtons

# 创建图形和坐标轴
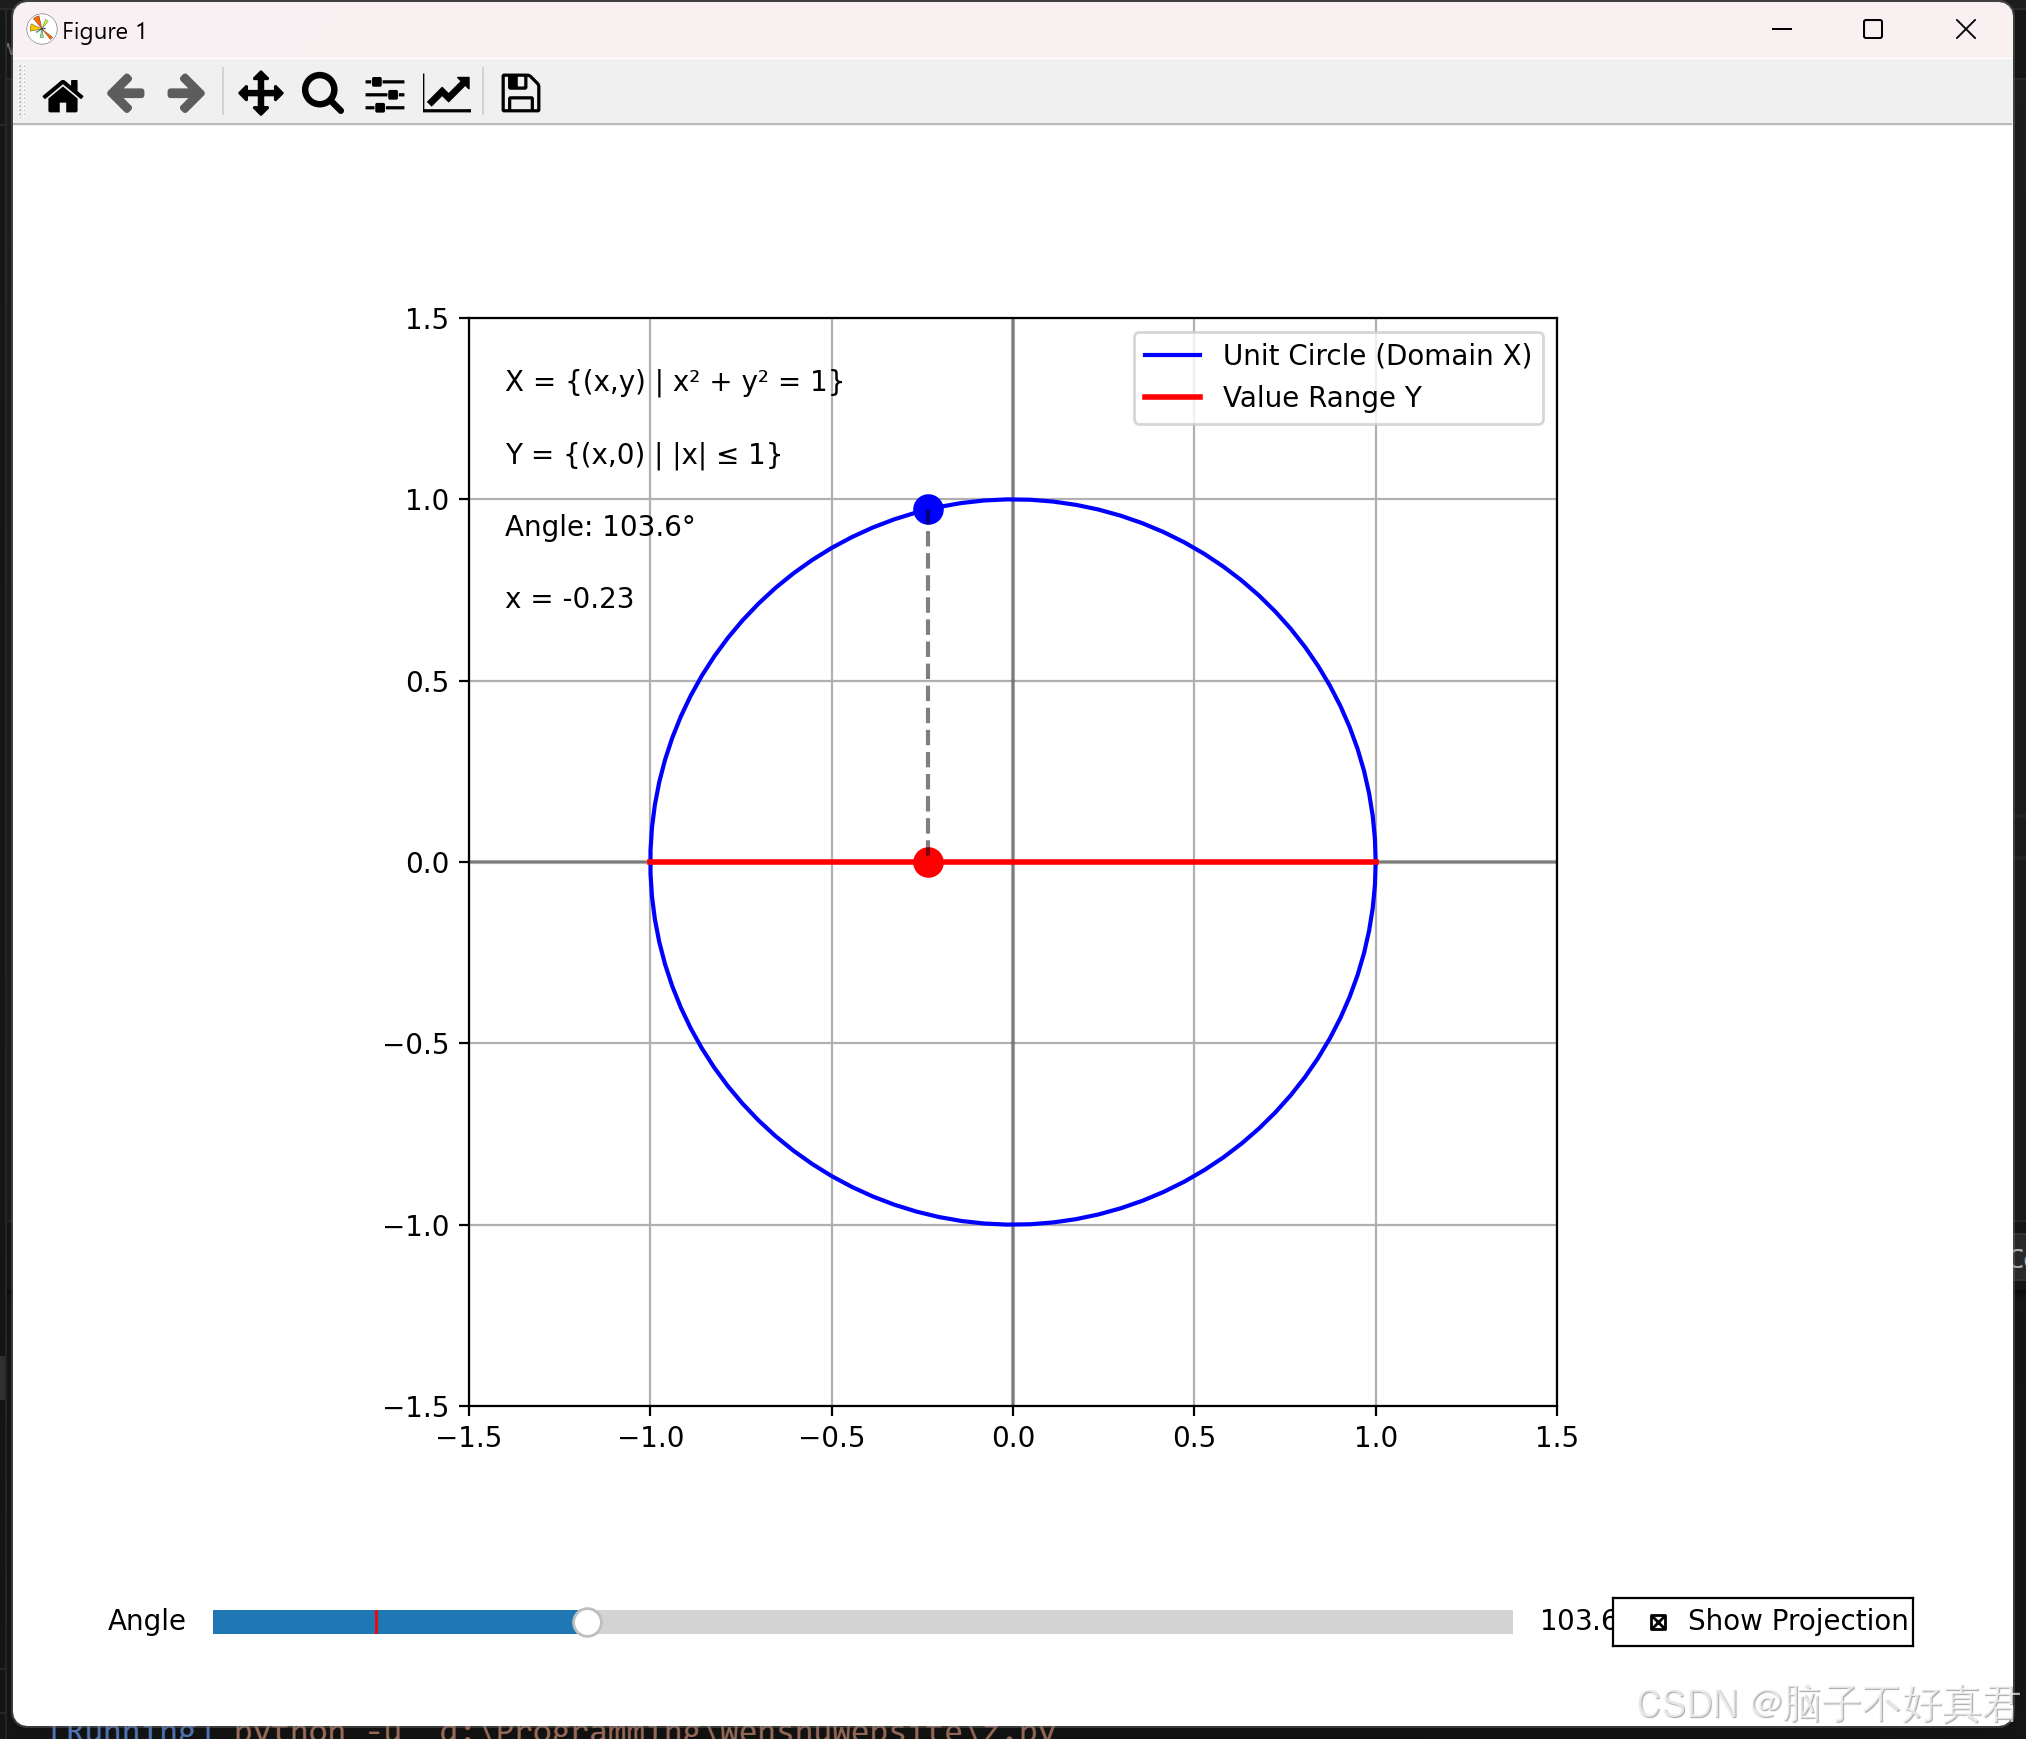
fig, ax = plt.subplots(figsize=(10, 8))
plt.subplots_adjust(left=0.1, bottom=0.2)

# 设置图表
ax.set_xlim([-1.5, 1.5])
ax.set_ylim([-1.5, 1.5])
ax.set_aspect('equal')
ax.grid(True)
ax.axhline(y=0, color='black', linestyle='-', alpha=0.3)
ax.axvline(x=0, color='black', linestyle='-', alpha=0.3)

# 创建圆
theta = np.linspace(0, 2*np.pi, 100)
x = np.cos(theta)
y = np.sin(theta)
circle, = ax.plot(x, y, 'b-', label='Unit Circle (Domain X)')

# 创建值域线
ax.plot([-1, 1], [0, 0], 'r-', linewidth=2, label='Value Range Y')

# 初始角度
init_angle = 45

# 在圆上创建点及其投影
point_on_circle, = ax.plot(np.cos(np.radians(init_angle)),
                          np.sin(np.radians(init_angle)),
                          'bo', markersize=10)
projection_point, = ax.plot(np.cos(np.radians(init_angle)),
                           0,
                           'ro', markersize=10)
projection_line, = ax.plot([np.cos(np.radians(init_angle)), np.cos(np.radians(init_angle))],
                          [np.sin(np.radians(init_angle)), 0],
                          'k--', alpha=0.5)

ax.legend()

# 添加文本注释
text_x = ax.text(-1.4, 1.3, f'X = {{(x,y) | x² + y² = 1}}')
text_y = ax.text(-1.4, 1.1, f'Y = {{(x,0) | |x| ≤ 1}}')
angle_text = ax.text(-1.4, 0.9, f'Angle: {init_angle}°')
coord_text = ax.text(-1.4, 0.7, f'x = {np.cos(np.radians(init_angle)):.2f}')

# 创建滑块
ax_slider = plt.axes([0.1, 0.05, 0.65, 0.03])
angle_slider = Slider(ax_slider, 'Angle', 0, 360, valinit=init_angle)

# 创建投影线复选框
ax_check = plt.axes([0.8, 0.05, 0.15, 0.03])
check = CheckButtons(ax_check, ['Show Projection'], [True])

def update(val):
    angle = angle_slider.val
    x = np.cos(np.radians(angle))
    y = np.sin(np.radians(angle))

    point_on_circle.set_data([x], [y])
    projection_point.set_data([x], [0])
    projection_line.set_data([x, x], [y, 0])

    angle_text.set_text(f'Angle: {angle:.1f}°')
    coord_text.set_text(f'x = {x:.2f}')

    fig.canvas.draw_idle()

def on_check(label):
    projection_line.set_visible(not projection_line.get_visible())
    fig.canvas.draw_idle()

angle_slider.on_changed(update)
check.on_clicked(on_check)

plt.show()


