吾将上下而求索
1Introduction
Here supply a geom_jjviomap function to visualize gene expression or other data in a heatmap-like way. The geom_jjviomap can still retain data distribution informations through violin graphs.
链接: https://github.com/junjunlab/jjPlot

2Installation
Re-install it to gain new features:
install.packages('devtools')
devtools::install_github('junjunlab/jjPlot')

library(jjPlot)
3Load test data
Process data first:
# load test data
data(exp.long)

# check
head(exp.long,3)
#   id gene      exp
# 1  2 LDHB 3.075915
# 2  3 LDHB 2.583047
# 3  2 LDHB 3.387729

# add median expression to group per gene
map_df(unique(exp.long$id),function(x){
  tmp <- exp.long %>% filter(id == x)
  map_df(unique(tmp$gene),function(j){
    tmp1 <- tmp %>% filter(gene == j)
    # calculate median expressions
    tmp1$median_exp <- median(tmp1$exp)
    return(tmp1)
  }) -> res
  return(res)
}) -> test

# make factor
test$id <- factor(test$id)
4Examples
First we show the facet violin plots:
# facet plot
ggplot(test,aes(x = id,y = exp)) +
  geom_violin(aes(fill = id),trim = T) +
  facet_wrap(~gene,ncol = 1,
             strip.position = 'right',
             scales = 'fixed') +
  theme_bw(base_size = 12) +
  theme(strip.text.y = element_text(angle = 0,hjust = 0),
        panel.grid = element_blank(),
        axis.ticks.y = element_blank(),
        axis.text.y = element_blank(),
        aspect.ratio = 0.05,
        strip.background.y = element_rect(fill = NA,color = NA),
        panel.spacing = unit(0,'cm'))

Viomap default plot:
# default
ggplot(test,aes(x = gene,y = id)) +
  geom_jjviomap(aes(val = exp),
                 width = 1) +
  coord_fixed()

Mapping with cluster:
# aes cluster
ggplot(test,aes(x = gene,y = id)) +
  geom_jjviomap(aes(val = exp,fill = id),
                 width = 1) +
  coord_fixed()

Mapping with gene:
# aes gene
ggplot(test,aes(x = gene,y = id)) +
  geom_jjviomap(aes(val = exp,fill = gene),
                 width = 1) +
  coord_fixed()

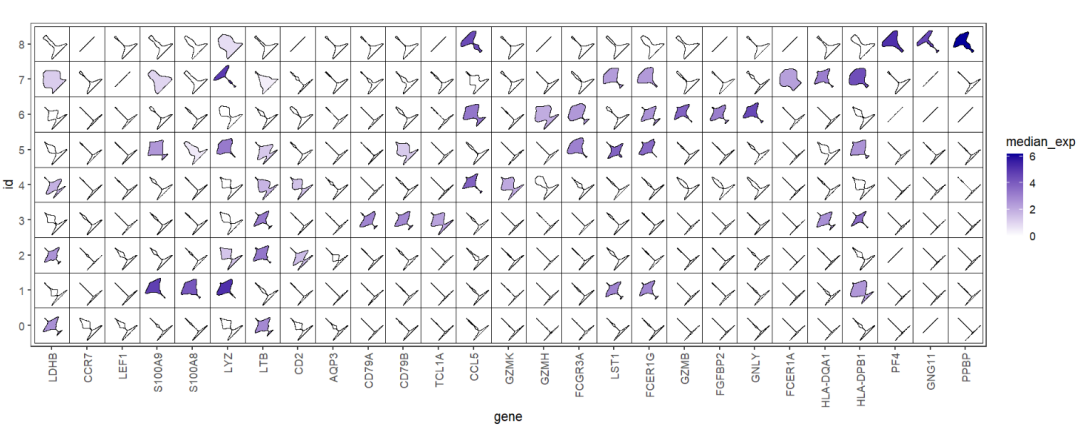
The most important point that we need to show the gene expression variance across the different clusters, we can use median expression to fill the violin color:
# aes median expressions
ggplot(test,aes(x = gene,y = id)) +
  geom_jjviomap(aes(val = exp,fill = median_exp),
                 width = 1) +
  scale_fill_gradient(low = 'white',high = '#04009A') +
  theme_bw(base_size = 14) +
  theme(panel.grid = element_blank(),
        axis.text.x = element_text(angle = 90,hjust = 1,vjust = 0.5)) +
  coord_fixed()

Add rect background:
# add rect
ggplot(test,aes(x = gene,y = id)) +
  geom_jjviomap(aes(val = exp,fill = median_exp),
                width = 1) +
  scale_fill_gradient(low = 'white',high = '#04009A') +
  theme_bw(base_size = 14) +
  theme(panel.grid = element_blank(),
        axis.text.x = element_text(angle = 90,hjust = 1,vjust = 0.5)) +
  coord_fixed() +
  geom_tile(fill = 'transparent',color = 'black')

You can rotate the violins:
# rotate the violins
ggplot(test,aes(x = gene,y = id)) +
  geom_jjviomap(aes(val = exp,fill = median_exp),
                 angle = 45,
                 width = 1) +
  scale_fill_gradient(low = 'white',high = '#04009A') +
  theme_bw(base_size = 14) +
  theme(panel.grid = element_blank(),
        axis.text.x = element_text(angle = 90,hjust = 1,vjust = 0.5)) +
  coord_fixed() +
  geom_tile(fill = 'transparent',color = 'black')

5End
More args see:
?geom_jjviomap


