1. Prometheus-Operator介绍
Prometheus Operator 为 Kubernetes 提供了对 Prometheus 相关监控组件的本地部署和管理方案,该项目的目的是为了简化和自动化基于 Prometheus 的监控栈配置,主要包括以下几个功能:
- kubernetes自定义资源:使用kubernetes CRD 来部署和管理Prometheus,Alertmanager和相关组件
- 简化的部署配置:直接通过kubernetes资源清单配置Prometheus,比如版本,持久化,副本,保留策略等等配置
- Prometheus监控目标配置:基于熟知的kubernetes标签查询自动生成监控目标配置,无需学习prometheus特地的配置
1.1. prometheus-operator组织架构
下图是 Prometheus-Operator 官方提供的架构图,各组件以不同的方式运行在 Kubernetes 集群中,其中 Operator 是最核心的部分,作为一个控制器,它会去创建 Prometheus、ServiceMonitor、AlertManager以及 PrometheusRule 等 CRD 资源对象,然后会一直 Watch 并维持这些资源对象的状态。
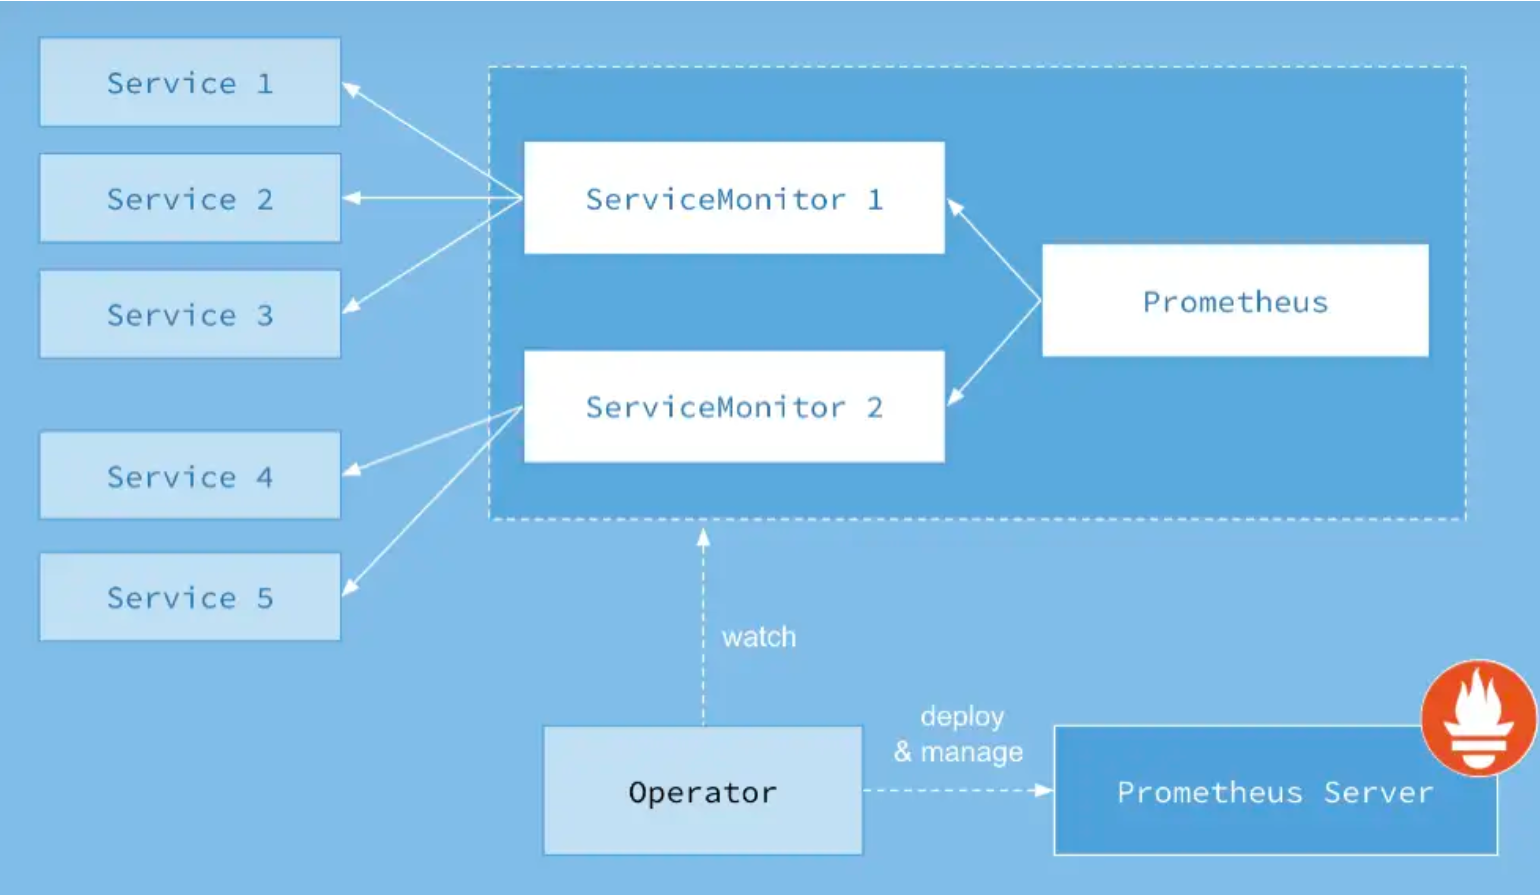
下面三个yaml文件 很好的表述了,prometheus 如何关联选择 servicemonitor,servicemonitor 如何关联选择目标service。
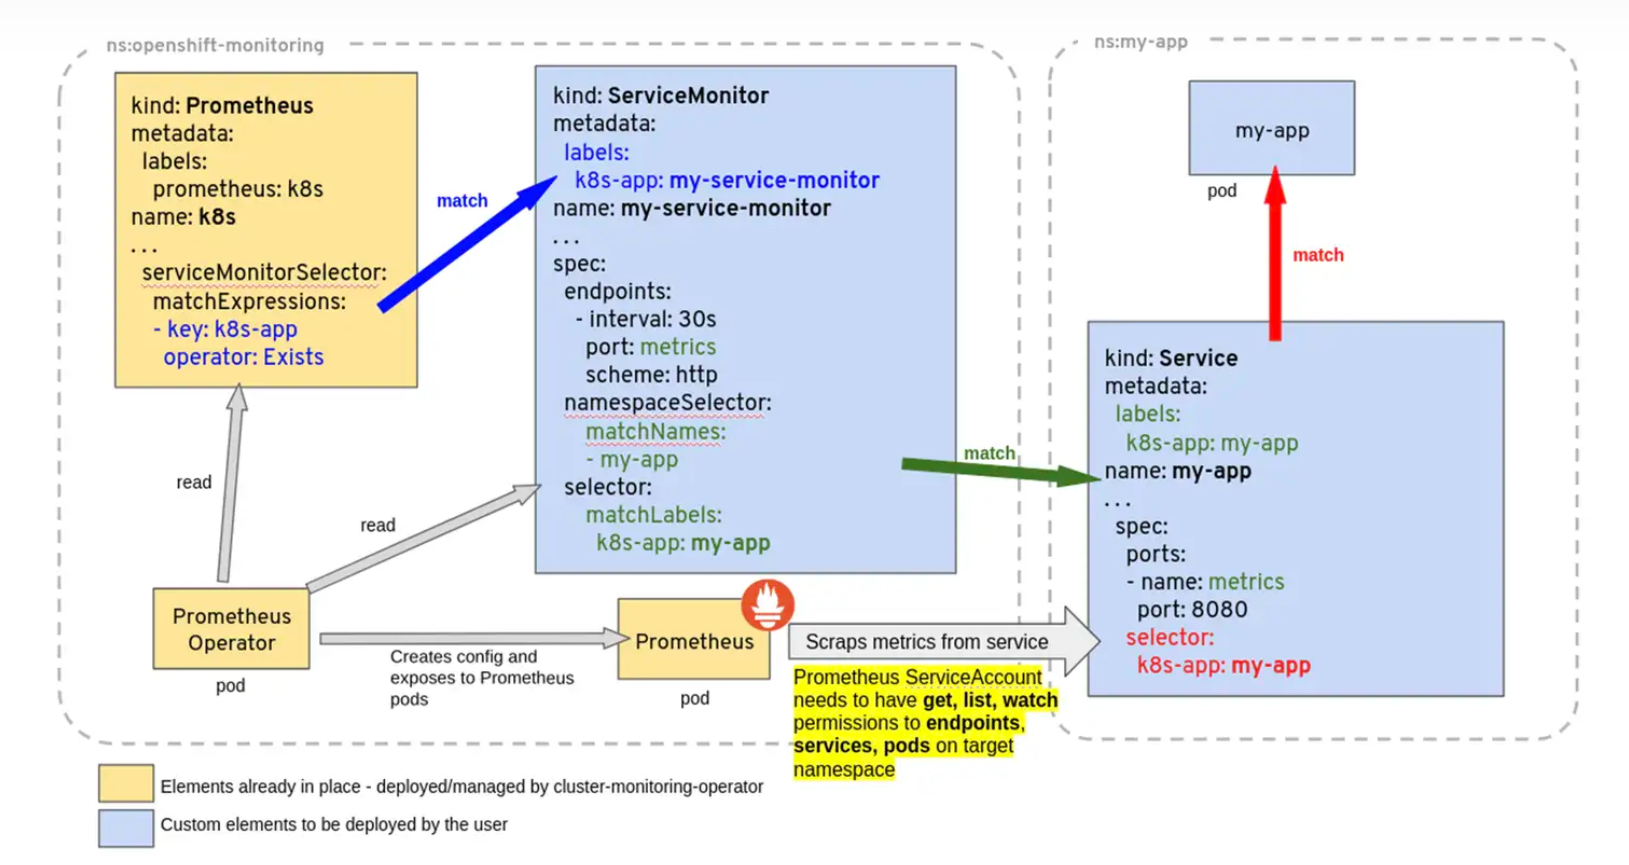
为了能让prom监控k8s内的应用,Prometheus-Operator通过配置servicemonitor匹配到由service对象自动填充的Endpoints,并配置prometheus监控这些Endpoints后端的pods,ServiceMonitor.Spec的Endpoints部分就是用于配置Endpoints的哪些端口将被scrape指标。
servicemonitor对象很巧妙,它解耦了“监控的需求”和“需求的实现方”。servicemonitor 只需要用到label-selector 这种简单又通用的方式声明一个 “监控需求”,也就是哪些Endpoints 需要搜集,怎么收集就行了。让用户只关心需求,这是一个非常好的关注点分离。当然servicemonitor 最后还是会被operator转化为原始的复 杂的scrape config,但这个复杂度已经完全被operator屏蔽了。
1.2. prometheus告警对接流程
下图很好的展现了prometheus在配置报警时需要操作哪些资源,及各资源起到的作用
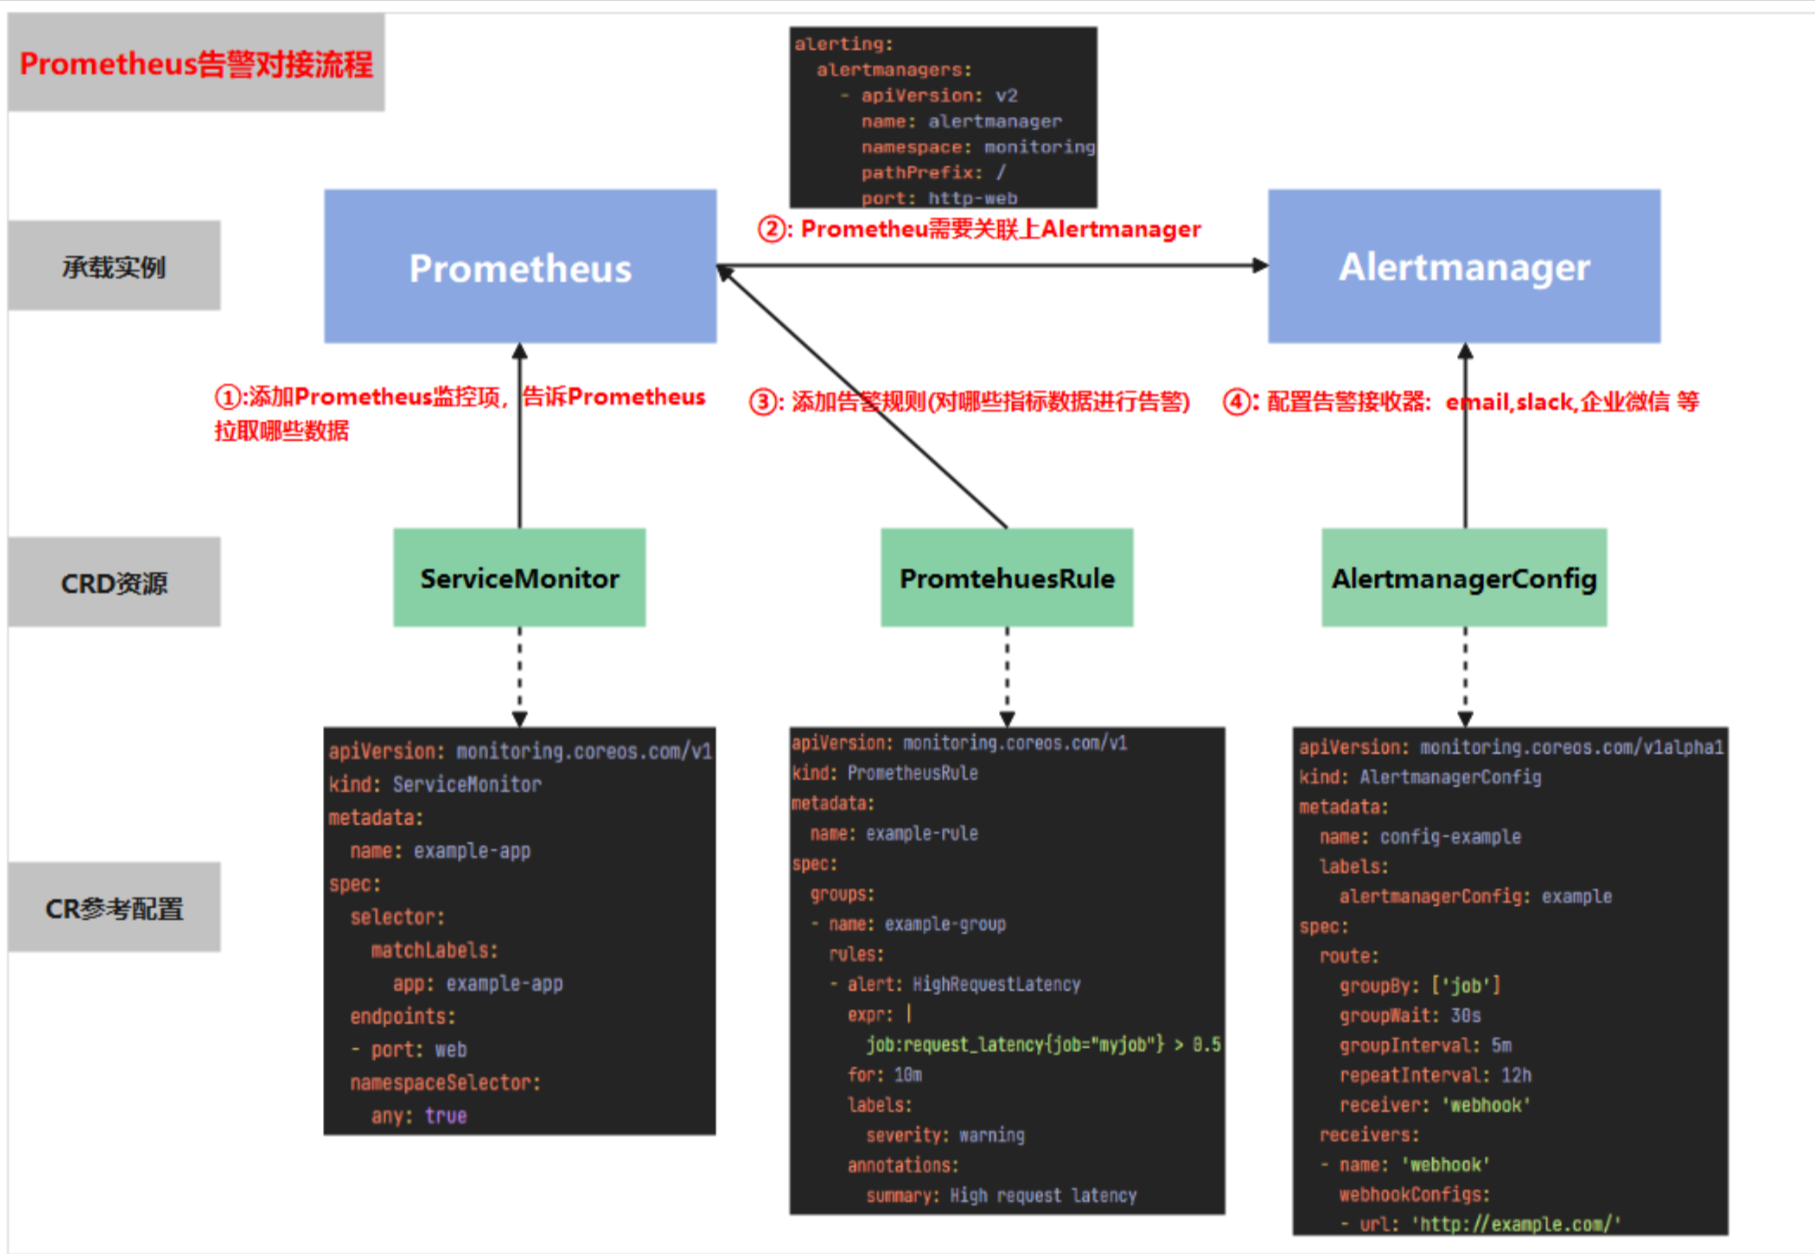
首先通过配置servicemonitor/podmonitor来获取应用的监控指标;
Prometheus.spec.alerting字段会匹配Alertmanager中的配置,匹配到alertmanager实例
然后通过prometheusrule对监控到的指标配置报警规则;
最后配置告警接收器,配置alertmanagerconfig来配置如何处理告警,包括如何接收、路由、抑制和发送警报等;
1.3. 常见CRD
Prometheus:
定义了所需的 Prometheus 部署。
ServiceMonitor:
以声明方式指定应如何监控 Kubernetes 服务组。Operator 根据 API 服务器中对象的当前状态自动生成 Prometheus 抓取配置。
PodMonitor:
以声明方式指定应如何监控 pod 组。Operator 根据 API 服务器中对象的当前状态自动生成 Prometheus 抓取配置。
PrometheusRule:
定义了一组所需的 Prometheus 警报和/或记录规则。Operator 生成一个规则文件,可供 Prometheus 实 例使用。
Alertmanager:
定义了所需的 Alertmanager 部署。
AlertmanagerConfig:
以声明方式指定 Alertmanager 配置的子部分,允许将警报路由到自定义接收器并设置禁止规则。
Probe:
以声明方式指定应如何监视入口组或静态目标。Operator 根据定义自动生成 Prometheus scrape 配置。 配合blackbox exporter使用。
ThanosRuler:
定义了所需的 Thanos Ruler 部署。
2. 克隆Prometheus Operator
Prometheus-Operator对K8S集群的版本有要求,请参照集群版本选择对应Prometheus-Operator版本代码库:https://github.com/prometheus-operator/kube-prometheus
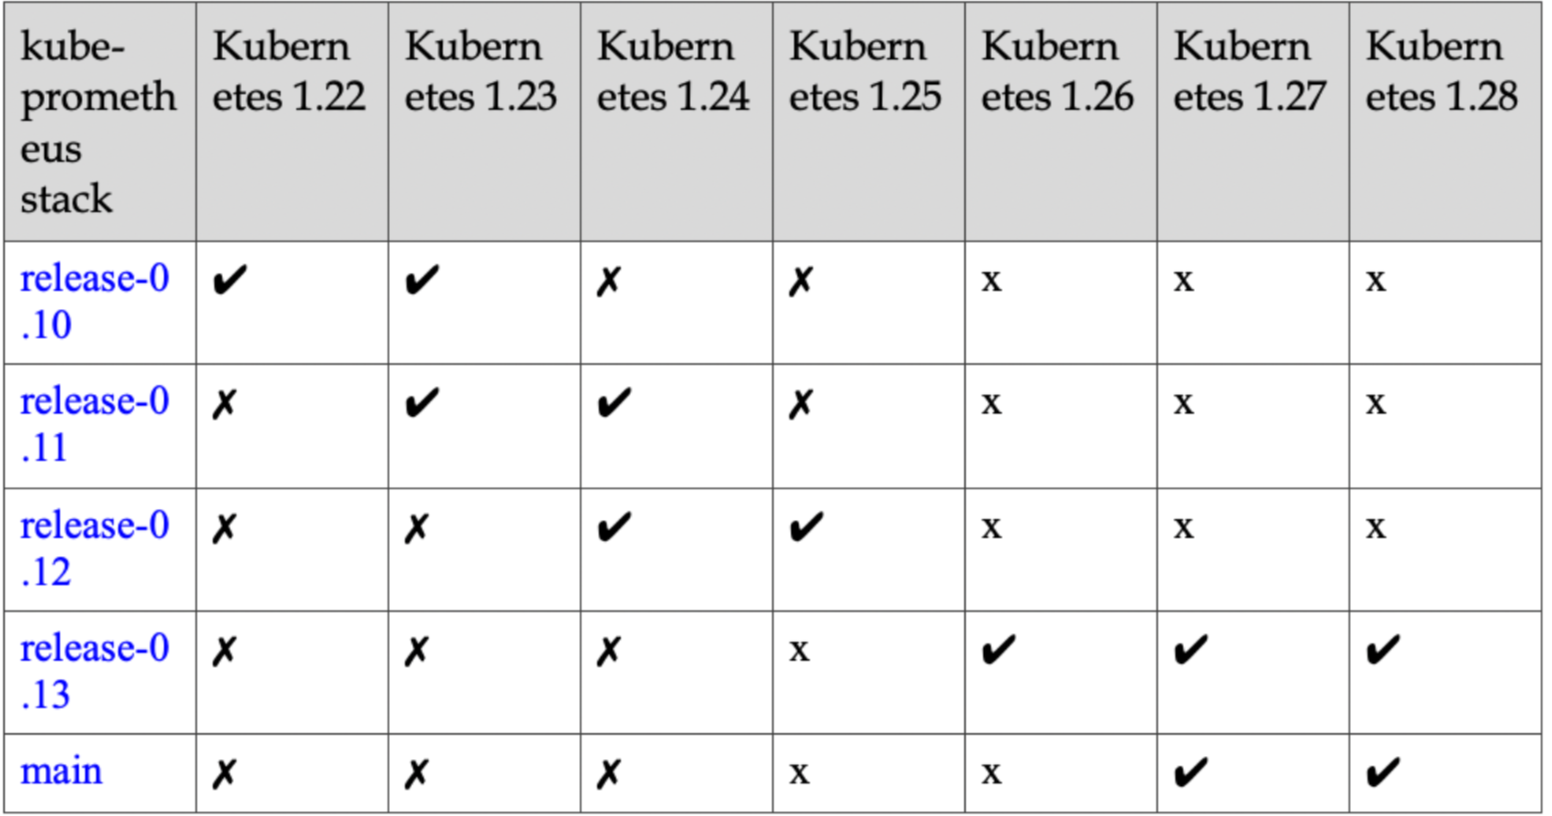
k8s1.23支持的最高版本是 kube-prometheus release-0.11
https://codeload.github.com/prometheus-operator/kube-prometheus/tar.gz/refs/tags/v0.11.0
[root@k8s231 kube-prometheus-0.11.0]# pwd
/script/k8s
[root@k8s231 k8s]# tar -xvf kube-prometheus-0.11.0.tar.gz
[root@k8s231 k8s]# cd kube-prometheus-0.11.0
3. 替换镜像路径
国内无法访问谷歌镜像,这里需要替换
[root@k8s231 kube-prometheus-0.11.0]# grep k8s.gcr.io manifests/*
manifests/kubeStateMetrics-deployment.yaml:        image: k8s.gcr.io/kube-state-metrics/kube-state-metrics:v2.5.0
manifests/prometheusAdapter-deployment.yaml:        image: k8s.gcr.io/prometheus-adapter/prometheus-adapter:v0.9.1

sed -i 's#k8s.gcr.io.*#bitnami/kube-state-metrics:latest#g' manifests/kubeStateMetrics-deployment.yaml
sed -i 's#k8s.gcr.io.*#v5cn/prometheus-adapter:v0.9.1#g' manifests/prometheusAdapter-deployment.yaml
4. 修改server为nodeport向外暴露服务
[root@k8s231 kube-prometheus-0.11.0]# cat manifests/grafana-service.yaml
...
spec:
  type: NodePort #新增
  ports:
  - name: http
    port: 3000
    targetPort: http
    nodePort: 30100 #新增
...

[root@k8s231 kube-prometheus-0.11.0]# cat manifests/prometheus-service.yaml
...
spec:
  type: NodePort #新增
  ports:
  - name: web
    port: 9090
    targetPort: web
    nodePort: 30200  #新增
...
5. 安装
kubectl apply --server-side -f manifests/setup
#检查各资源是否正常安装
kubectl wait --for condition=Established --all CustomResourceDefinition --namespace=monitoring
kubectl apply -f manifests/
6. 卸载
注意:如果按照有问题,可以执行此步,再重新安装,若没错请不要执行此步骤,除非你真的想卸载不要了
kubectl delete --ignore-not-found=true -f manifests/ -f manifests/setup
7. 部署prometheus-operator
[root@k8s231 kube-prometheus-0.11.0]# kubectl create -f manifests/setup/
[root@k8s231 kube-prometheus-0.11.0]# kubectl apply -f manifests/
8. 检查部署情况
[root@k8s231 manifests]# kubectl -n monitoring get pods
NAME                                  READY   STATUS    RESTARTS   AGE
alertmanager-main-0                   2/2     Running   0          16m
alertmanager-main-1                   2/2     Running   0          16m
alertmanager-main-2                   2/2     Running   0          16m
blackbox-exporter-746c64fd88-dh9l8    3/3     Running   0          16m
grafana-5fc7f9f55d-kdjrx              1/1     Running   0          16m
kube-state-metrics-698467b7df-cm92d   3/3     Running   0          16m
node-exporter-2rdw4                   2/2     Running   0          16m
node-exporter-2sdjn                   2/2     Running   0          16m
node-exporter-8gpmr                   2/2     Running   0          16m
node-exporter-gvz82                   2/2     Running   0          16m
prometheus-adapter-5597544b8b-w7f2d   1/1     Running   0          98s
prometheus-adapter-5597544b8b-wtzm7   1/1     Running   0          98s
prometheus-k8s-0                      2/2     Running   0          16m
prometheus-k8s-1                      2/2     Running   0          16m
prometheus-operator-f59c8b954-tmk2d   2/2     Running   0          16m
[root@k8s231 kube-prometheus-0.11.0]# kubectl -n monitoring get svc
NAME TYPE CLUSTER-IP EXTERNAL-IP PORT(S) AGE
alertmanager-main ClusterIP 10.100.5.141 <none> 9093/TCP,8080/TCP 4m35s
alertmanager-operated ClusterIP None <none> 9093/TCP,9094/TCP,9094/UDP 4m10s
blackbox-exporter ClusterIP 10.100.237.159 <none> 9115/TCP,19115/TCP 4m35s
grafana NodePort 10.100.240.15 <none> 3000:30100/TCP 4m34s
kube-state-metrics ClusterIP None <none> 8443/TCP,9443/TCP 4m34s
node-exporter ClusterIP None <none> 9100/TCP 4m34s
prometheus-adapter ClusterIP 10.100.55.29 <none> 443/TCP 4m33s
prometheus-k8s NodePort 10.100.122.67 <none> 9090:30200/TCP,8080:65345/TCP 4m33s
prometheus-operated ClusterIP None <none> 9090/TCP 4m9s
prometheus-operator ClusterIP None <none> 8443/TCP 4m33s9. 访问UI页面
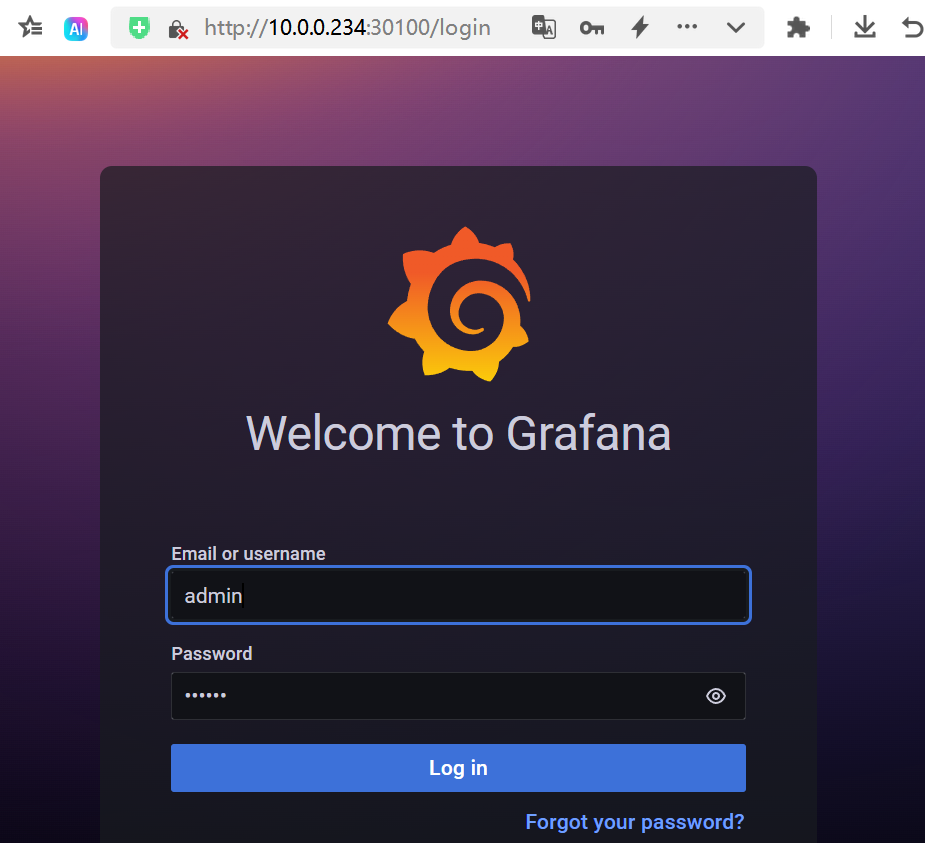
9.1. 访问grafana
地址:10.0.0.231:30100 账号密码:admin/admin
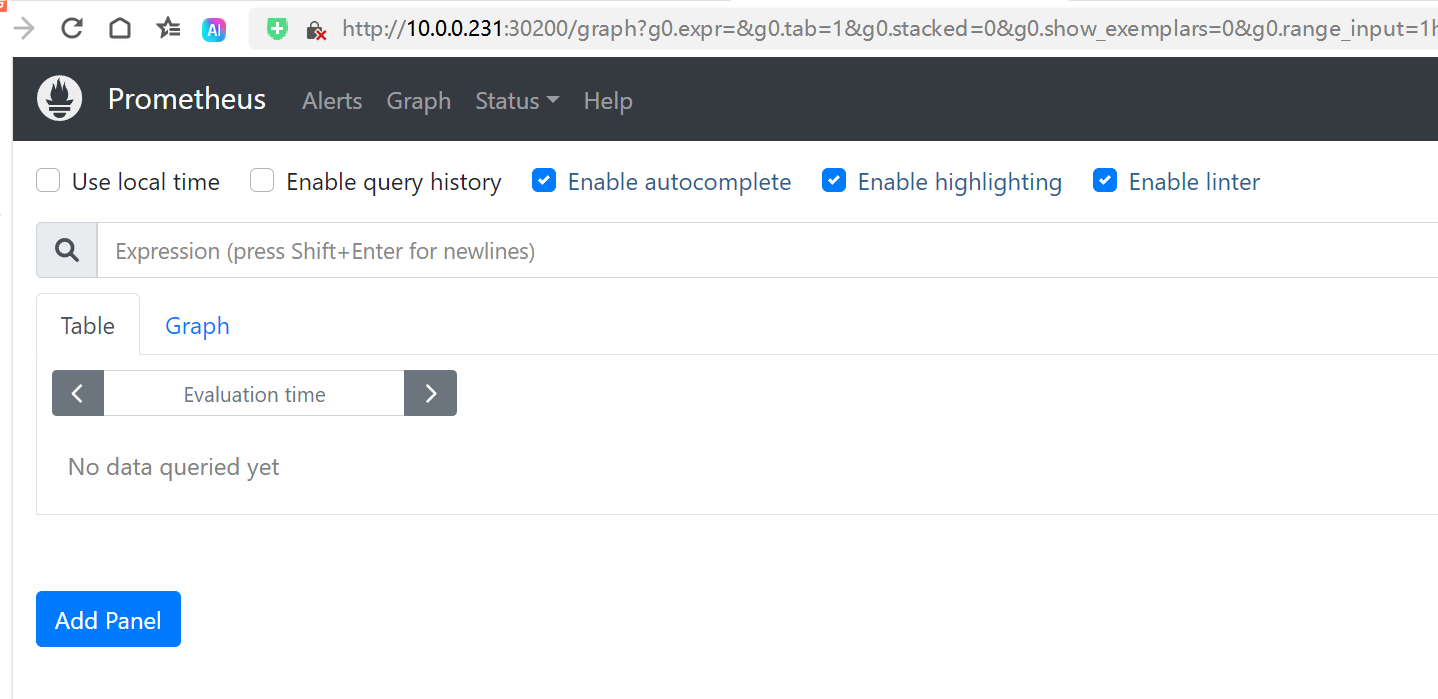
9.2. 访问prometheus
地址:10.0.0.231:30200
10. 案例:使用servicemonitor监控es
ES环境说明:当前已经存在一个运行在elk名称空间的ES集群,es的svc名称为es-svc-headless
这里servicemonitor和exporter处于monitoring的命名空间,和es集群处于不同空间
10.1. 创建一个elasticsearch exporter的pod及他的svc
cat > elastic-exporter.yaml <<EOF
---
apiVersion: apps/v1
kind: Deployment
metadata:
  labels:
    app: elasticsearch-exporter
  name: elasticsearch-exporter
  namespace: monitoring
spec:
  replicas: 1
  selector:
    matchLabels:
      app: elasticsearch-exporter
  template:
    metadata:
      annotations:
        prometheus.io/scrape: 'true'
        prometheus.io/port: '9114'
        prometheus.io/path: 'metrics'
      labels:
        app: elasticsearch-exporter
    spec:
      containers:
      - command:
        - '/bin/elasticsearch_exporter'
        - --es.uri=http://elastic:Aa123456@es-svc-headless.elk:9200
        - --es.all
        - --es.indices
        - --es.shards
        image: prometheuscommunity/elasticsearch-exporter:v1.5.0
        imagePullPolicy: IfNotPresent
        name: elasticsearch-exporter
        ports:
        - containerPort: 9114

---
apiVersion: v1
kind: Service
metadata:
  labels:
    app: elasticsearch-exporter
  name: elasticsearch-exporter-svc
  namespace: monitoring
spec:
  ports:
  - name: http
    port: 9114
    protocol: TCP
    targetPort: 9114
  selector:
    app: elasticsearch-exporter
  type: ClusterIP
EOF
kubectl apply -f elastic-exporter.yaml10.2. 创建servicemonitor 关联exporter的svc
operator会自动添加同名称空间的servicemonitor
[root@k8s231 k8s]# cat > elastic-exporter-servicemonitor.yaml <<'EOF'
[root@k8s231 k8s]# cat elastic-exporter-servicemonitor.yaml
---
apiVersion: monitoring.coreos.com/v1
kind: ServiceMonitor
metadata:
labels:
app: elasticsearch-exporter
name: elasticsearch-exporter
namespace: monitoring
spec:
endpoints:
- honorLabels: true
interval: 1m
path: /metrics
port: http
scheme: http
params:
target:
- 'elasticsearch-exporter-svc'
relabelings:
- sourceLabels: [__param_target]
targetLabel: instance
namespaceSelector:
matchNames:
- monitoring
selector:
matchLabels:
app: elasticsearch-exporter
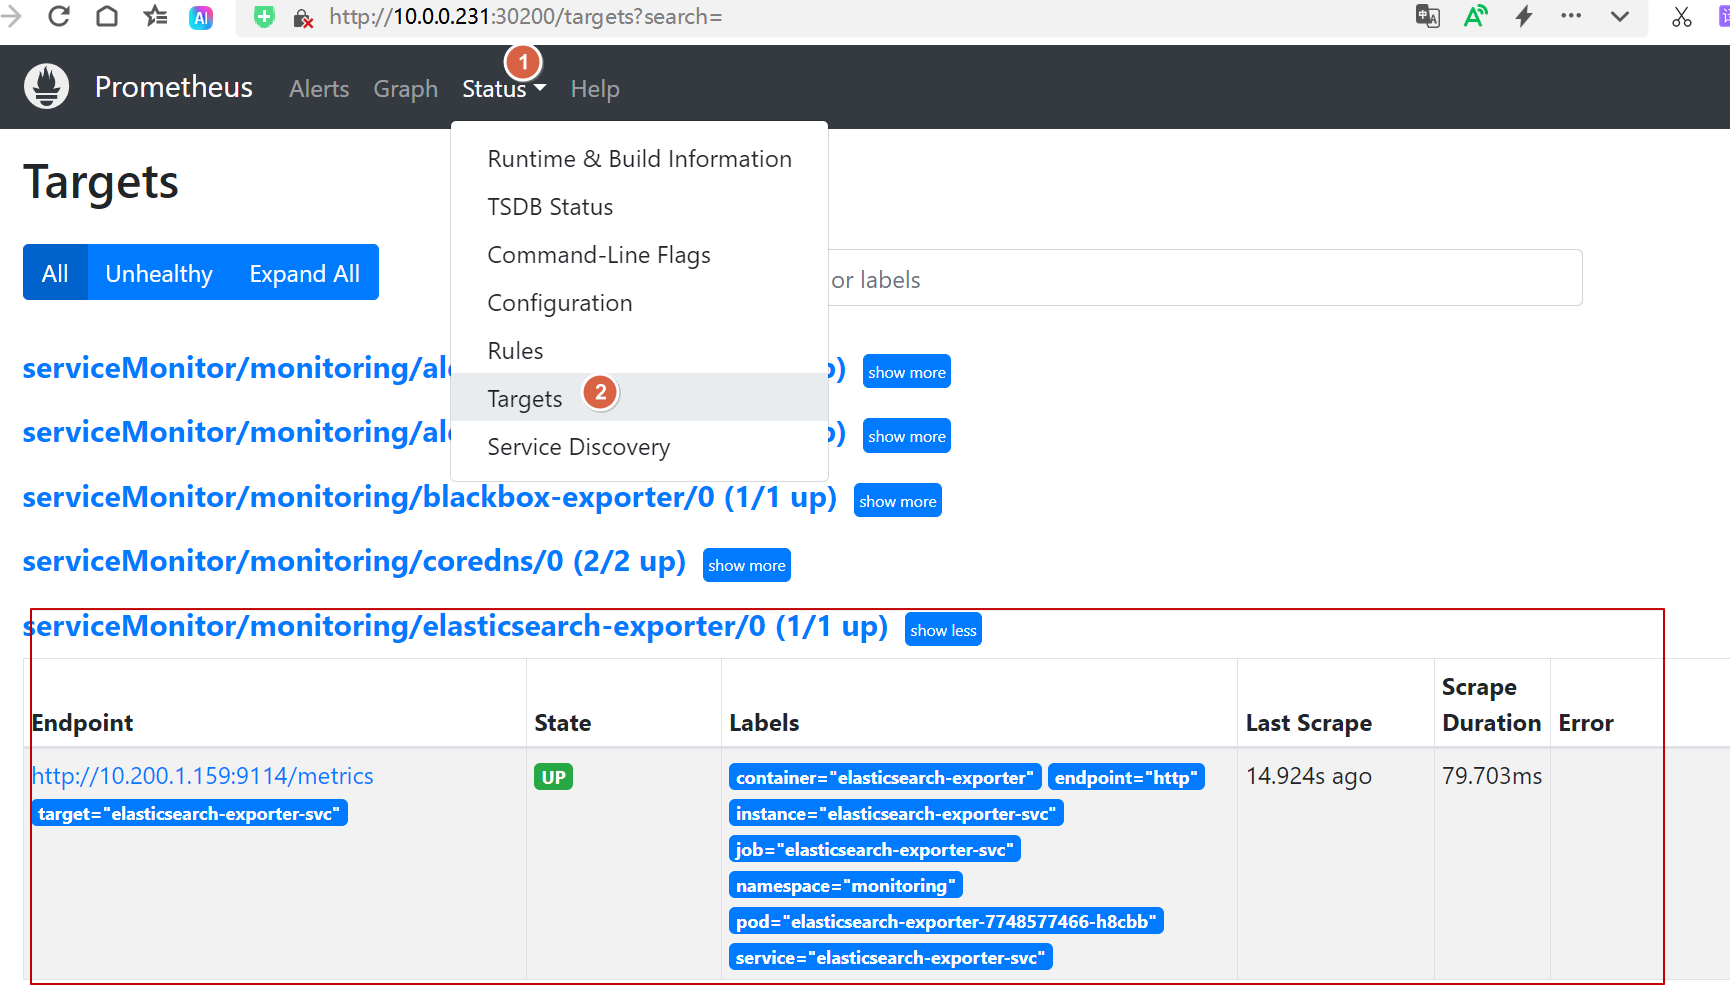
EOFkubectl apply -f elastic-exporter-servicemonitor.yaml10.3. 验证servicemonitor在没在prometheus里面出现
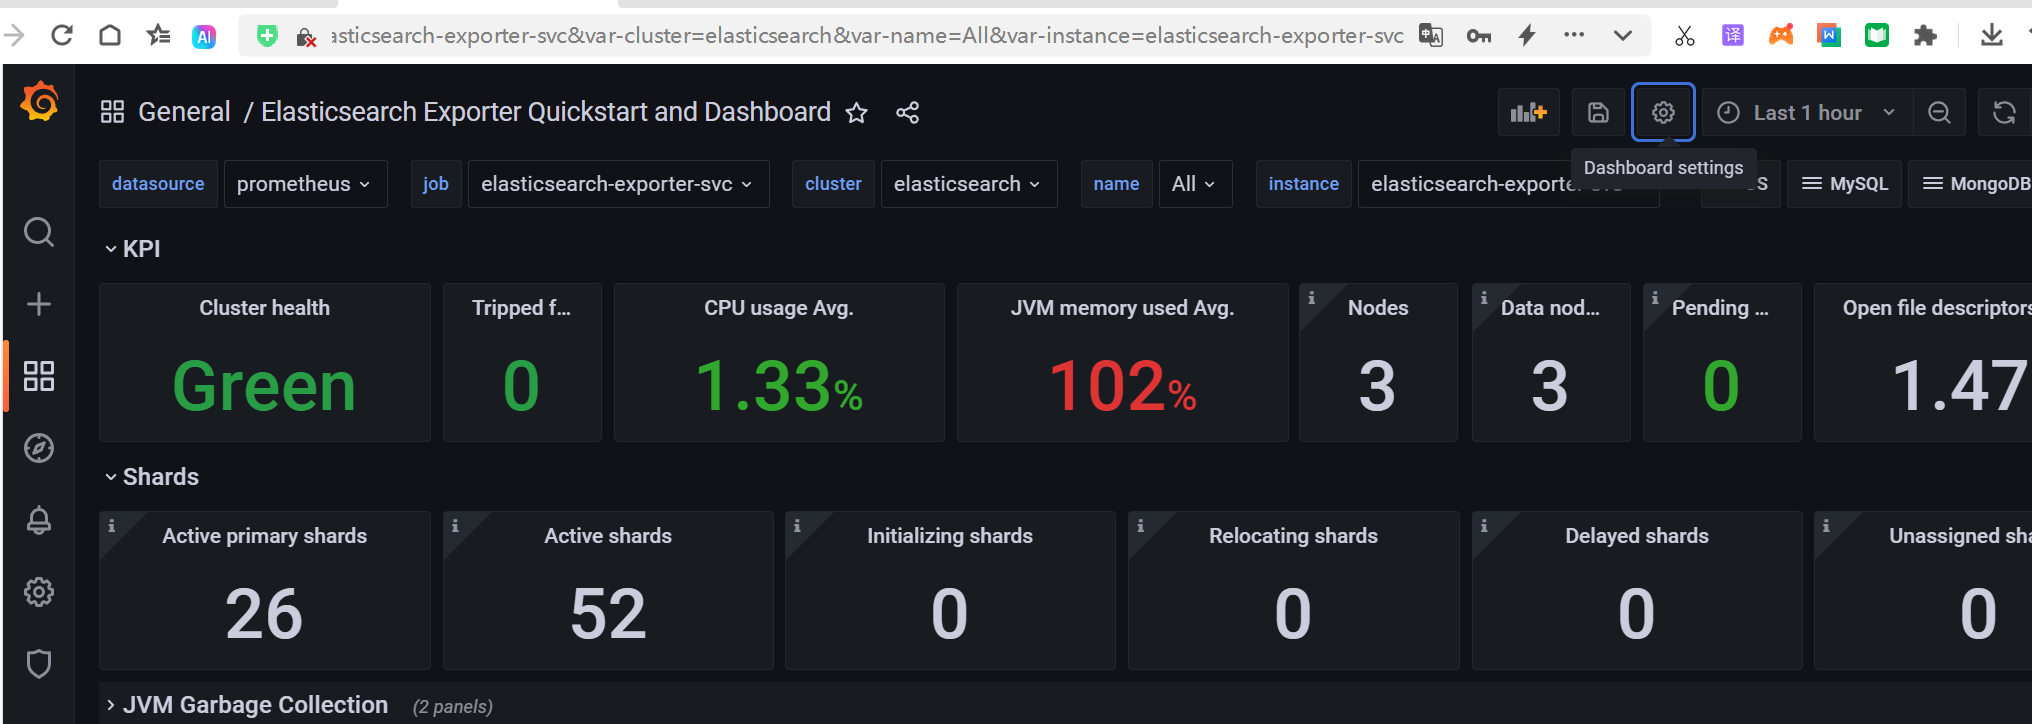
10.4. Grafana展示图
添加prometheus数据源,然导入官方推荐监控模板ID为:14191,然后数据源选择为prometheus
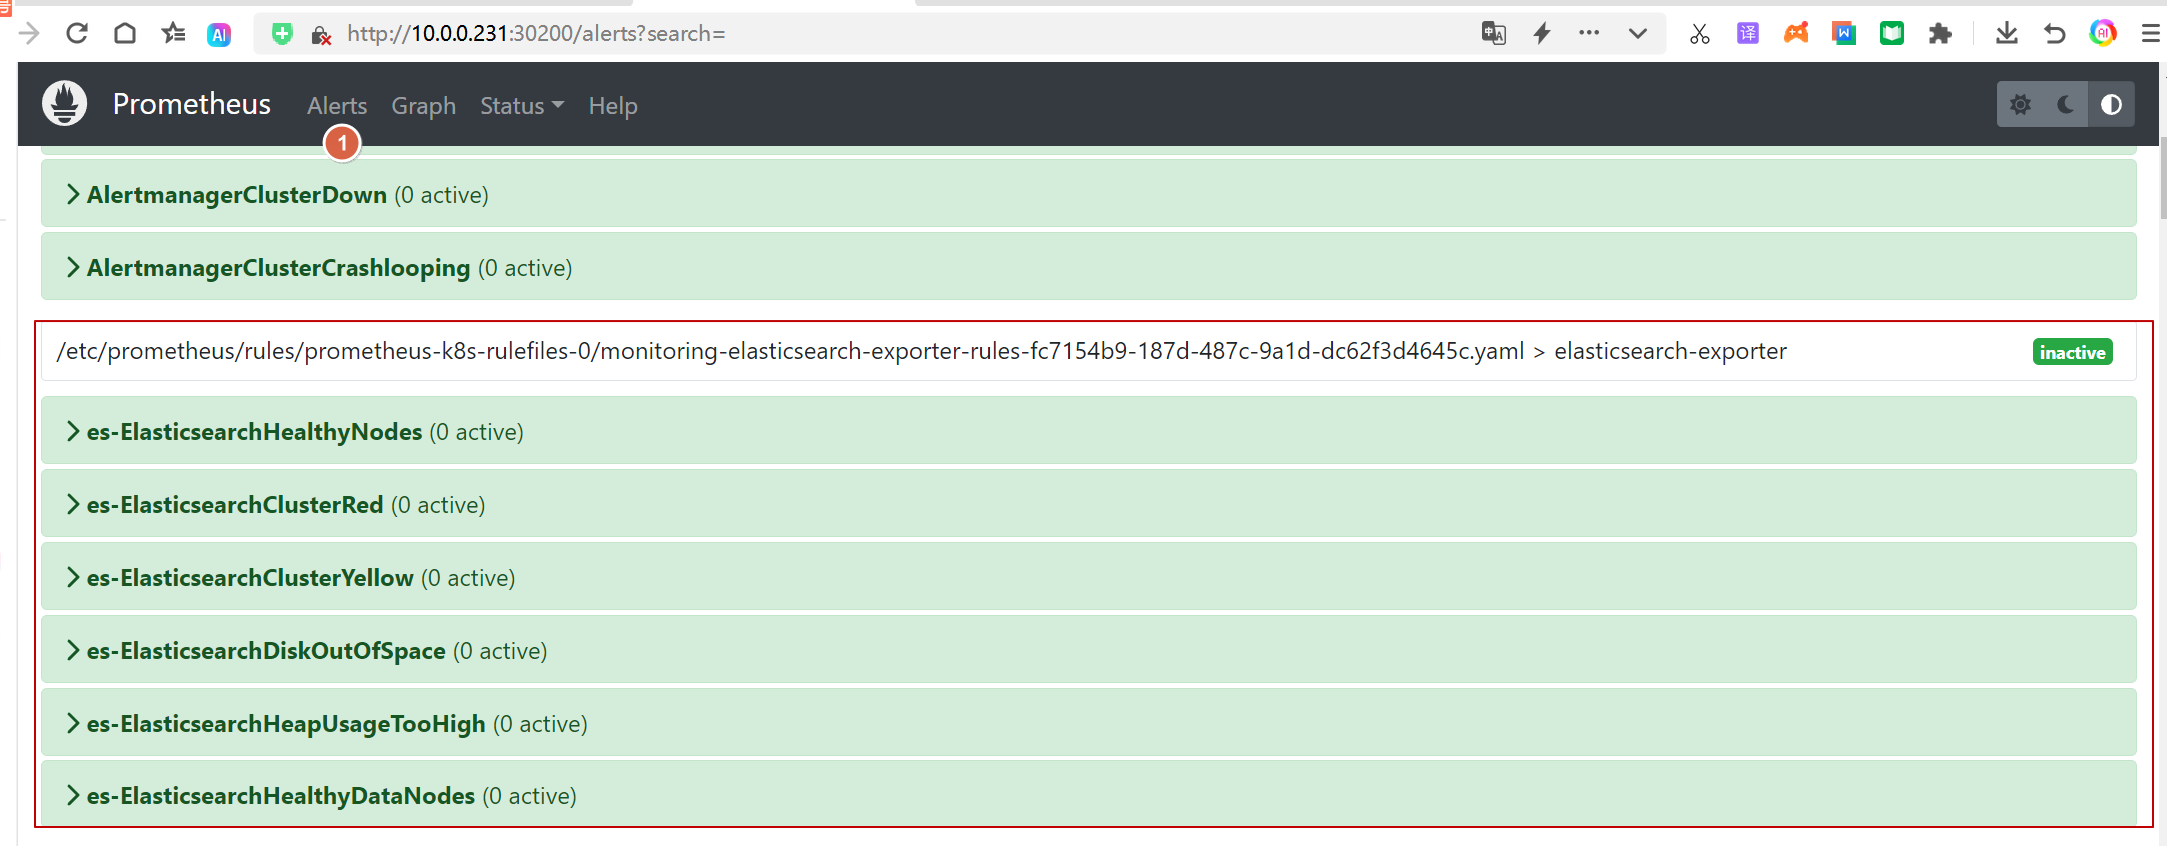
10.5. 给elasticsearch设置prometheus告警规则
prometheusRule规则配置,可以参考模板配置,模板网址如下:
https://awesome-prometheus-alerts.grep.to/rules#elasticsearch
cat > elastic-promhteus-alert.yaml <<'EOF'
---
apiVersion: monitoring.coreos.com/v1
kind: PrometheusRule
metadata:
  labels:
    prometheus: k8s
    role: alert-rules
  name: elasticsearch-exporter-rules
  namespace: monitoring
spec:
  groups:
    - name: elasticsearch-exporter
      rules:
        - alert: es-ElasticsearchHealthyNodes
          expr: elasticsearch_cluster_health_number_of_nodes < 3
          for: 0m
          labels:
            severity: critical
          annotations:
            summary: Elasticsearch Healthy Nodes (instance {{ $labels.instance }})
            description: "Missing node in Elasticsearch cluster\n  VALUE = {{ $value }}\n  LABELS = {{ $labels }}"
        - alert: es-ElasticsearchClusterRed
          expr: elasticsearch_cluster_health_status{color="red"} == 1
          for: 0m
          labels:
            severity: critical
          annotations:
            summary: Elasticsearch Cluster Red (instance {{ $labels.instance }})
            description: "Elastic Cluster Red status\n  VALUE = {{ $value }}\n  LABELS = {{ $labels }}"
        - alert: es-ElasticsearchClusterYellow
          expr: elasticsearch_cluster_health_status{color="yellow"} == 1
          for: 0m
          labels:
            severity: warning
          annotations:
            summary: Elasticsearch Cluster Yellow (instance {{ $labels.instance }})
            description: "Elastic Cluster Yellow status\n  VALUE = {{ $value }}\n  LABELS = {{ $labels }}"
        - alert: es-ElasticsearchDiskOutOfSpace
          expr: elasticsearch_filesystem_data_available_bytes / elasticsearch_filesystem_data_size_bytes * 100 < 10
          for: 0m
          labels:
            severity: critical
          annotations:
            summary: Elasticsearch disk out of space (instance {{ $labels.instance }})
            description: "The disk usage is over 90%\n  VALUE = {{ $value }}\n  LABELS = {{ $labels }}"
        - alert: es-ElasticsearchHeapUsageTooHigh
          expr: (elasticsearch_jvm_memory_used_bytes{area="heap"} / elasticsearch_jvm_memory_max_bytes{area="heap"}) * 100 > 90
          for: 2m
          labels:
            severity: critical
          annotations:
            summary: Elasticsearch Heap Usage Too High (instance {{ $labels.instance }})
            description: "The heap usage is over 90%\n  VALUE = {{ $value }}\n  LABELS = {{ $labels }}"
        - alert: es-ElasticsearchHealthyDataNodes
          expr: elasticsearch_cluster_health_number_of_data_nodes < 3
          for: 0m
          labels:
            severity: critical
          annotations:
            summary: Elasticsearch Healthy Data Nodes (instance {{ $labels.instance }})
            description: "Missing data node in Elasticsearch cluster\n  VALUE = {{ $value }}\n  LABELS = {{ $labels }}"
EOF
kubectl apply -f elastic-promhteus-alert.yaml