1. 引言
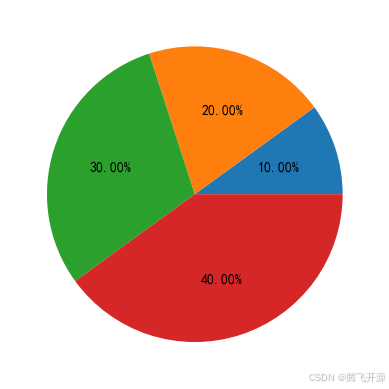
亲们,还在为数据报告里的饼图头疼吗?别怕,Matplotlib来救场啦!它不只是个绘图工具,简直是数据界的魔术师,让你的饼图既专业又有趣。跟我学几招,保证让你的观众边吃边看,爱不释眼!快来解锁你的数据烘焙新技能吧!饼状图用来显示一个数据系列,具体来说,饼状图显示一个数据系列中各项目总和的百分比。
2. 导包
# 导包
import numpy as np
import pandas as pd
import matplotlib.pyplot as plt

# 如果浏览器不显示图片,就需要加上这句话
%matplotlib inline

# 让图片中可以显示中文
plt.rcParams['font.sans-serif'] = "SimHei"
# 让图片中可以显示负号
plt.rcParams["axes.unicode_minus"] = False

# 支持svg矢量图
%config Inlinebackend.figure_format = "svg"
3. 饼图
x = [10, 20, 30, 40]

# autopct:设置百分比
plt.pie(x, autopct="%.2f%%")
plt.show()
4. Pandas获取Excel数据
df = pd.read_excel("09_pie.xlsx", sheet_name="pie1")
df
| 省份 | 销量 | |
|---|---|---|
| 0 | 广东 | 12932 |
| 1 | 山东 | 9622 |
| 2 | 湖北 | 9505 |
| 3 | 江苏 | 7898 |
| 4 | 浙江 | 7675 |
| 5 | 河北 | 7315 |
| 6 | 广西 | 5164 |
| 7 | 上海 | 5132 |
| 8 | 北京 | 4885 |
| 9 | 四川 | 4468 |
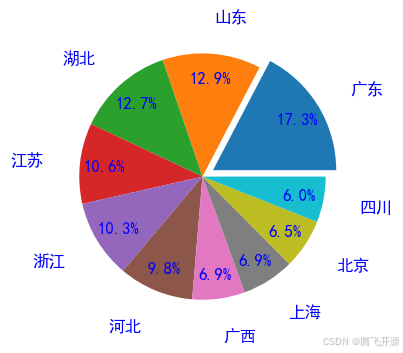
citys, values = df["省份"], df["销量"]
plt.figure(figsize=(4, 4))

# autopct:显示百分比
# pctdistance:百分比文字的位置
# labels:标签
# labeldistance:标签的位置
# shadow:阴影
# textprops:文字的样式
# explode:分裂效果
plt.pie(x=values,
        autopct="%.1f%%",
        pctdistance=0.8,
        labels=citys,
        labeldistance=1.3,
        # shadow=True,
        textprops={"fontsize":12, "color":"blue"},
        explode=[0.1, 0, 0, 0, 0, 0, 0, 0, 0, 0])
plt.show()
5. 单个圆环:甜甜圈
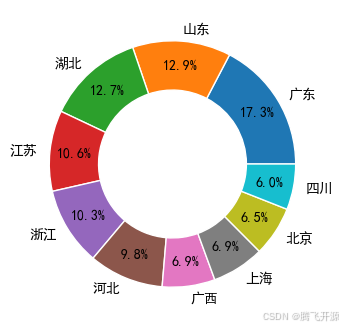
plt.figure(figsize=(4, 4))

# autopct:显示百分比
# pctdistance:百分比文字的位置
# labels:标签
# textprops:文字的样式
# explode:分裂效果
# wedgeprops:甜甜圈设置(width:扇形宽度,edgecolor:扇形边线效果)
plt.pie(x=values,
        autopct="%.1f%%",
        pctdistance=0.8,
        labels=citys,
        textprops={"fontsize":10, "color":"k"},
        wedgeprops={"width":0.4, "edgecolor":"w"}
       )
plt.show()
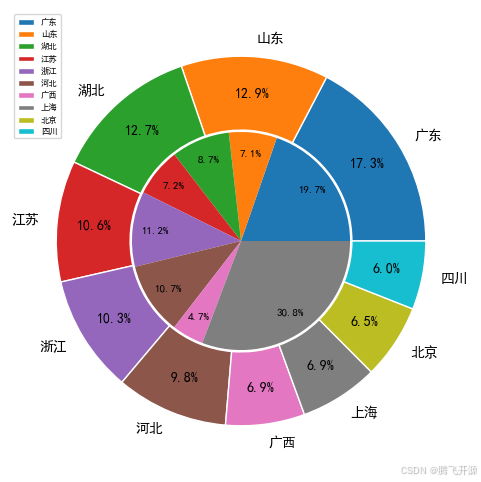
6. 多个圆环
df1 = pd.read_excel("09_pie.xlsx", sheet_name="pie1")
df2 = pd.read_excel("09_pie.xlsx", sheet_name="pie2")
display(df1,df2)
| 省份 | 销量 | |
|---|---|---|
| 0 | 广东 | 12932 |
| 1 | 山东 | 9622 |
| 2 | 湖北 | 9505 |
| 3 | 江苏 | 7898 |
| 4 | 浙江 | 7675 |
| 5 | 河北 | 7315 |
| 6 | 广西 | 5164 |
| 7 | 上海 | 5132 |
| 8 | 北京 | 4885 |
| 9 | 四川 | 4468 |
| 省份 | 销量 | |
|---|---|---|
| 0 | 广东 | 21600 |
| 1 | 山东 | 7800 |
| 2 | 湖北 | 9505 |
| 3 | 江苏 | 7898 |
| 4 | 浙江 | 12240 |
| 5 | 河北 | 11760 |
| 6 | 广西 | 5164 |
| 7 | 上海 | 33776 |
citys1, values1 = df1["省份"], df1["销量"]
citys2, values2 = df2["省份"], df2["销量"]
plt.figure(figsize=(6, 6))

# 第一个圆环
# autopct:显示百分比
# pctdistance:百分比文字的位置
# labels:标签
# textprops:文字的样式
# explode:分裂效果
# wedgeprops:甜甜圈设置(width:扇形宽度,edgecolor:扇形边线效果)
plt.pie(x=values1,
        autopct="%.1f%%",
        pctdistance=0.8,
        labels=citys1,
        textprops={"fontsize":10, "color":"k"},
        wedgeprops={"width":0.4, "edgecolor":"w"}
       )

# 第二个图
# radius:半径
plt.pie(
    x=values2,
    autopct="%.1f%%",
    pctdistance=0.8,
    textprops={"fontsize":8, "color":"k"},
    radius=0.59
)

# 图例
plt.legend(citys1, fontsize=6, loc="upper left")

plt.show()






![[数据结构] AVL树 模拟实现AVL树](https://i-blog.csdnimg.cn/direct/2d658cb51c264b8fb5571c3fe5950691.png)


