R语言画散点图-饼图-折线图-柱状图-箱线图-等高线图-曲线图-热力图-雷达图-韦恩图(三D)
- 散点图
- 使用 plotly 包
- 示例
- 解析
- 效果
- 使用 scatterplot3d 包
- 示例
- 解析
- 效果
- 饼图
- 使用 plotly 包
- 示例
- 解析
- 效果
- 使用 plotrix 包
- 示例
- 解析
- 效果
- 折线图
- 使用 plotly 包
- 示例
- 解析
- 效果
- 使用 rgl 包
- 示例
- 解析
- 效果
- 柱状图
- 示例
- 解析
- 效果
- 箱线图
- 示例
- 解析
- 效果
- 直方图
- 示例
- 解析
- 效果
- 等高线图
- 使用 plotly 包(方式1)
- 示例
- 解析
- 效果
- 使用 plotly 包(方式2)
- 示例
- 解析
- 效果
- 曲线图
- 示例
- 解析
- 效果
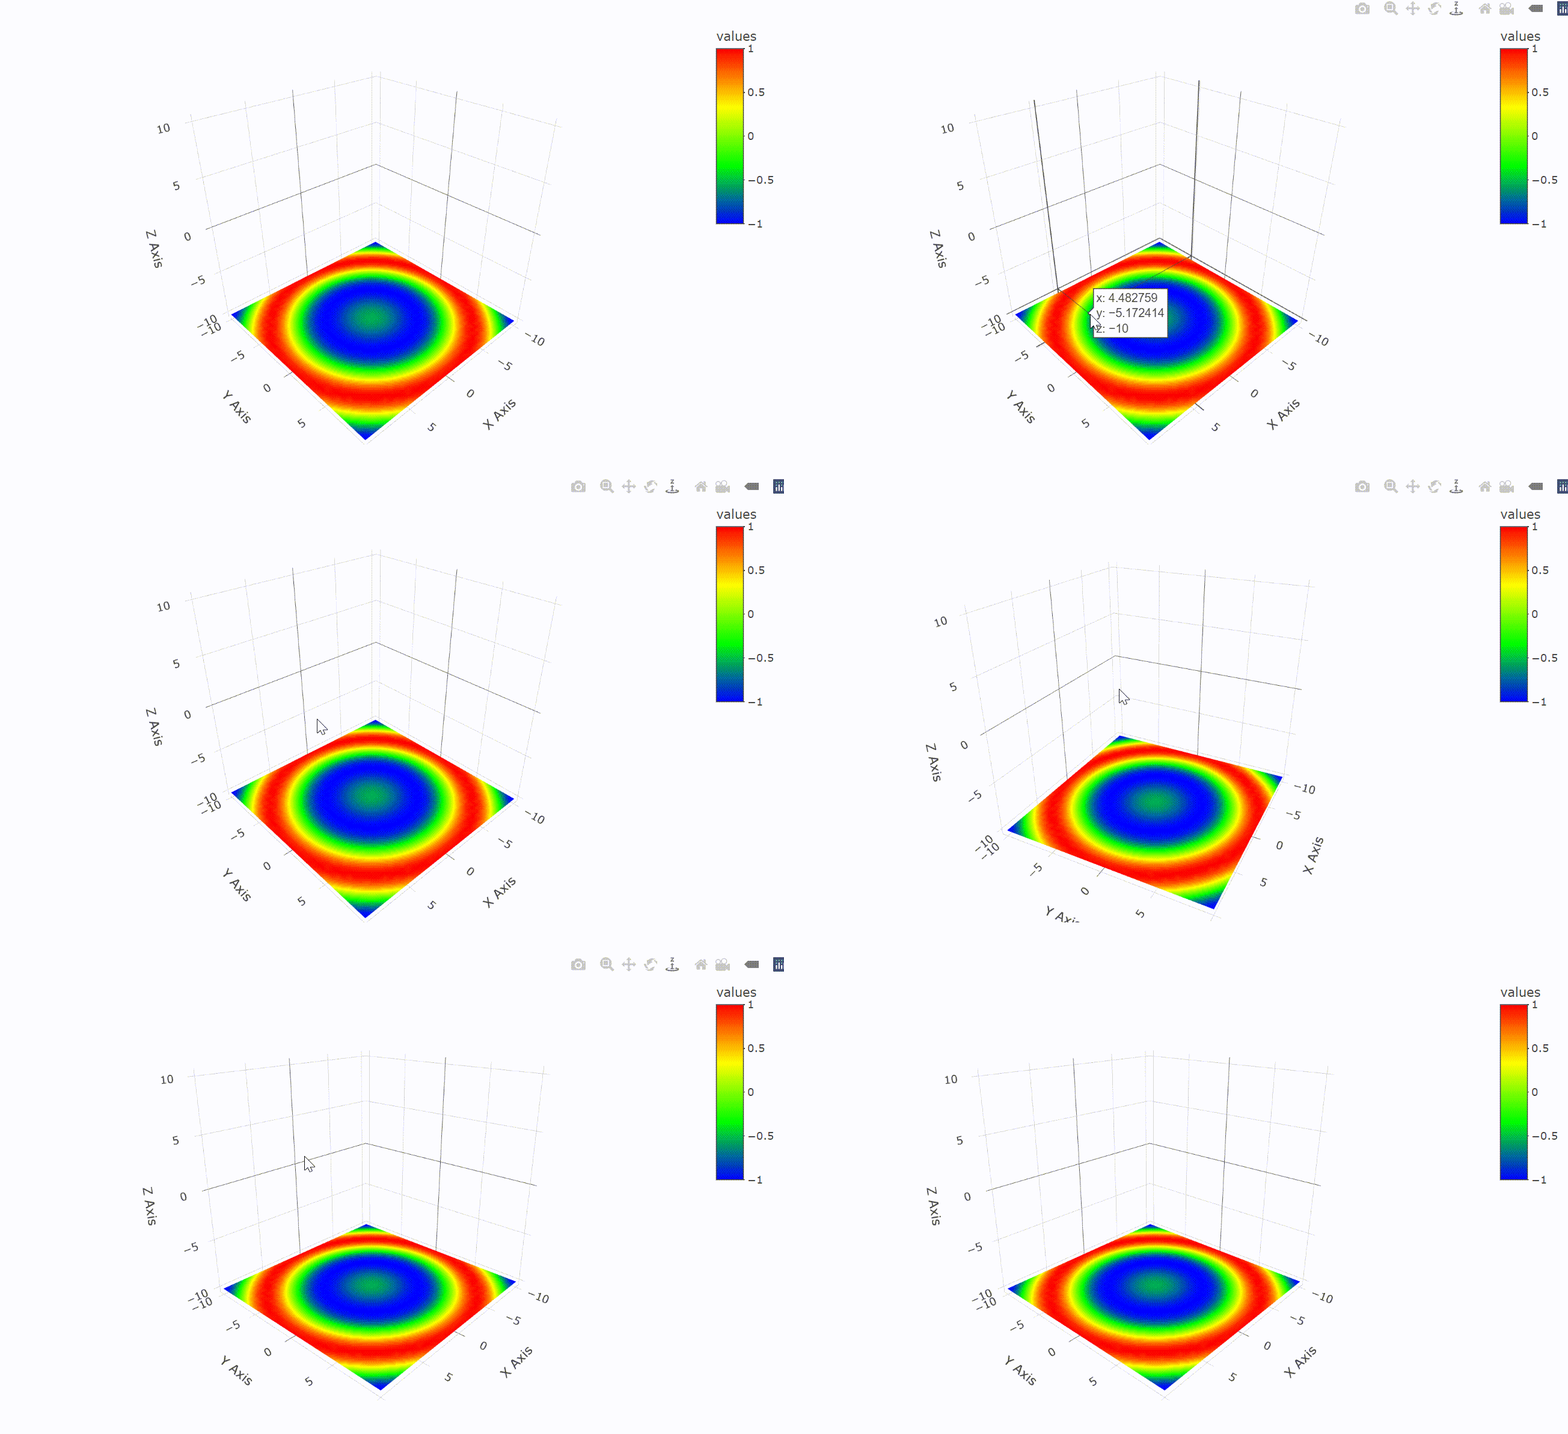
- 热力图
- 示例
- 解析
- 效果
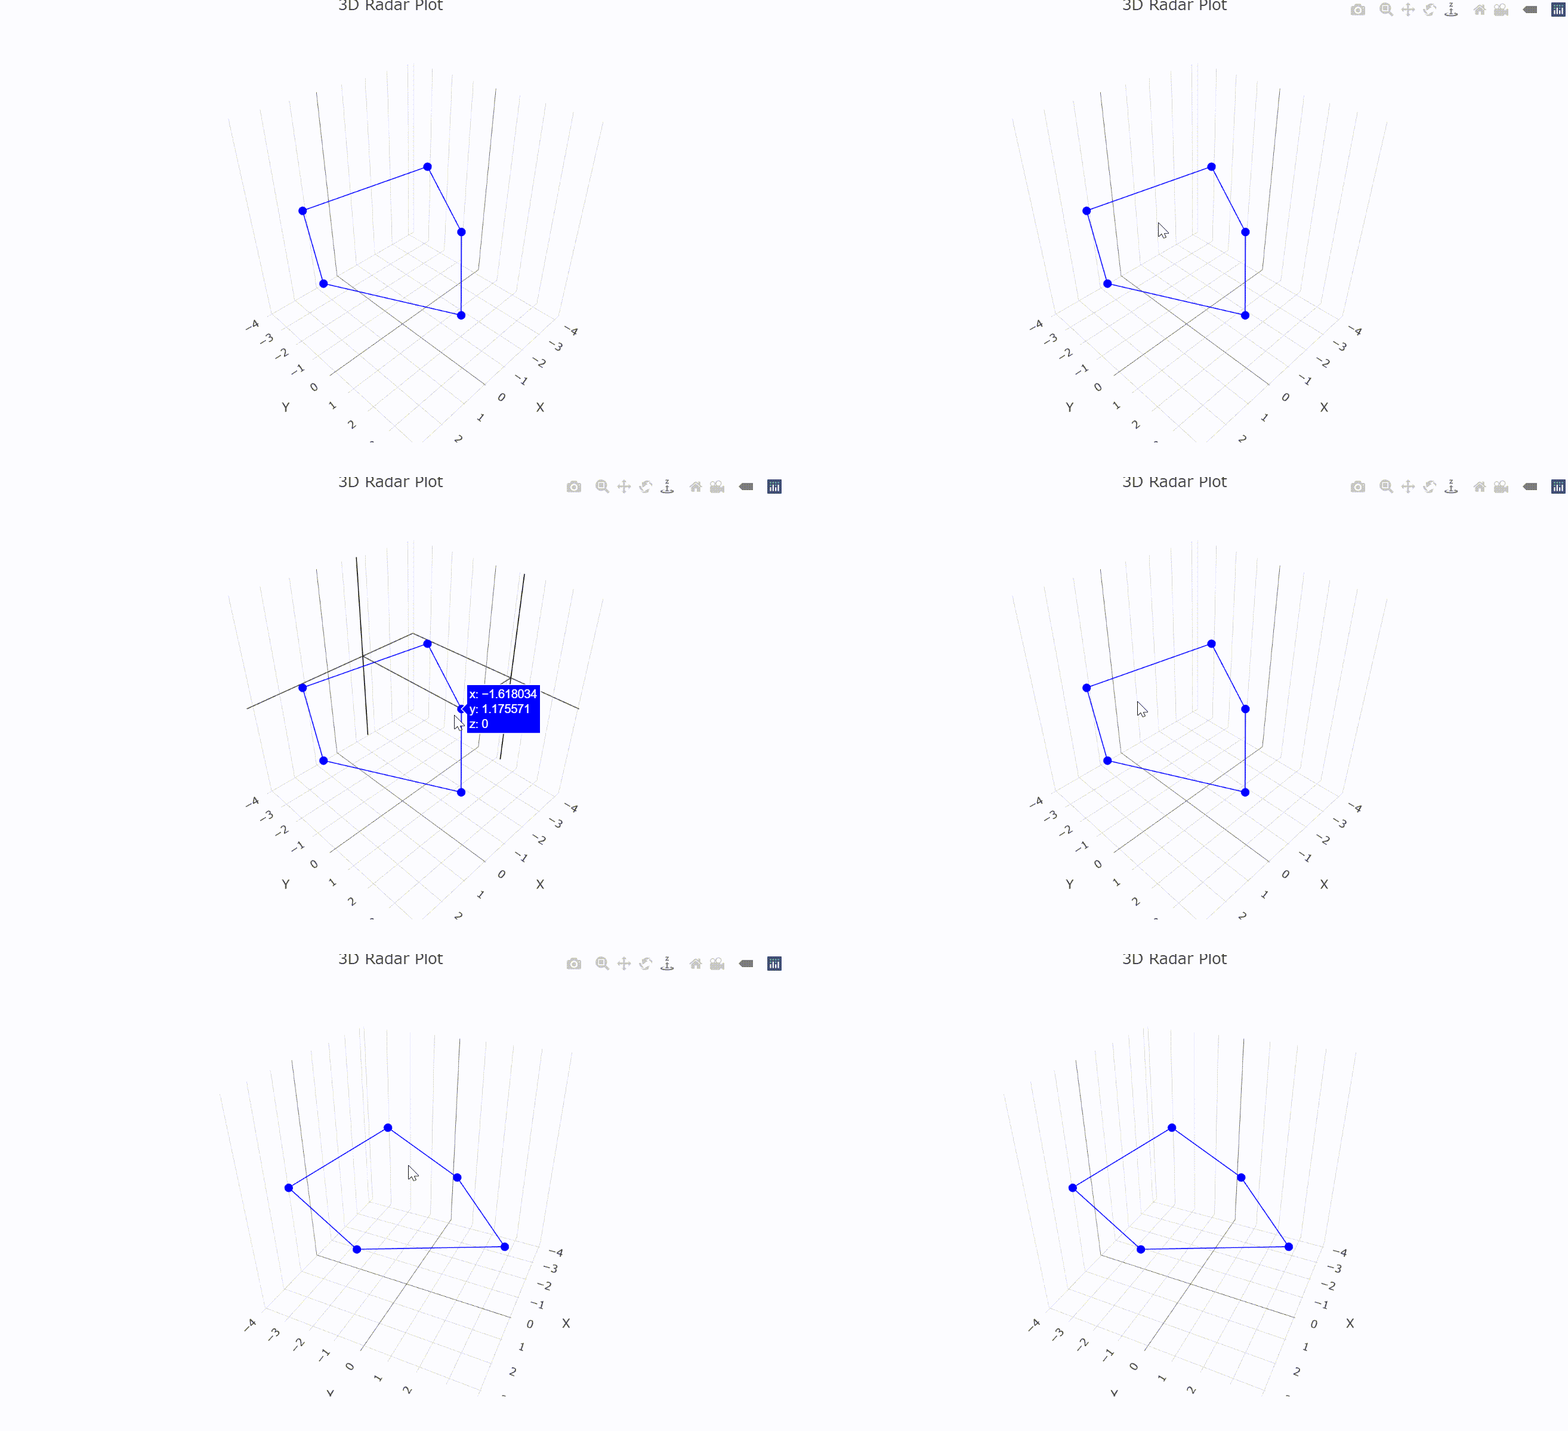
- 雷达图
- 示例
- 效果
- 韦恩图
- 示例
- 解析
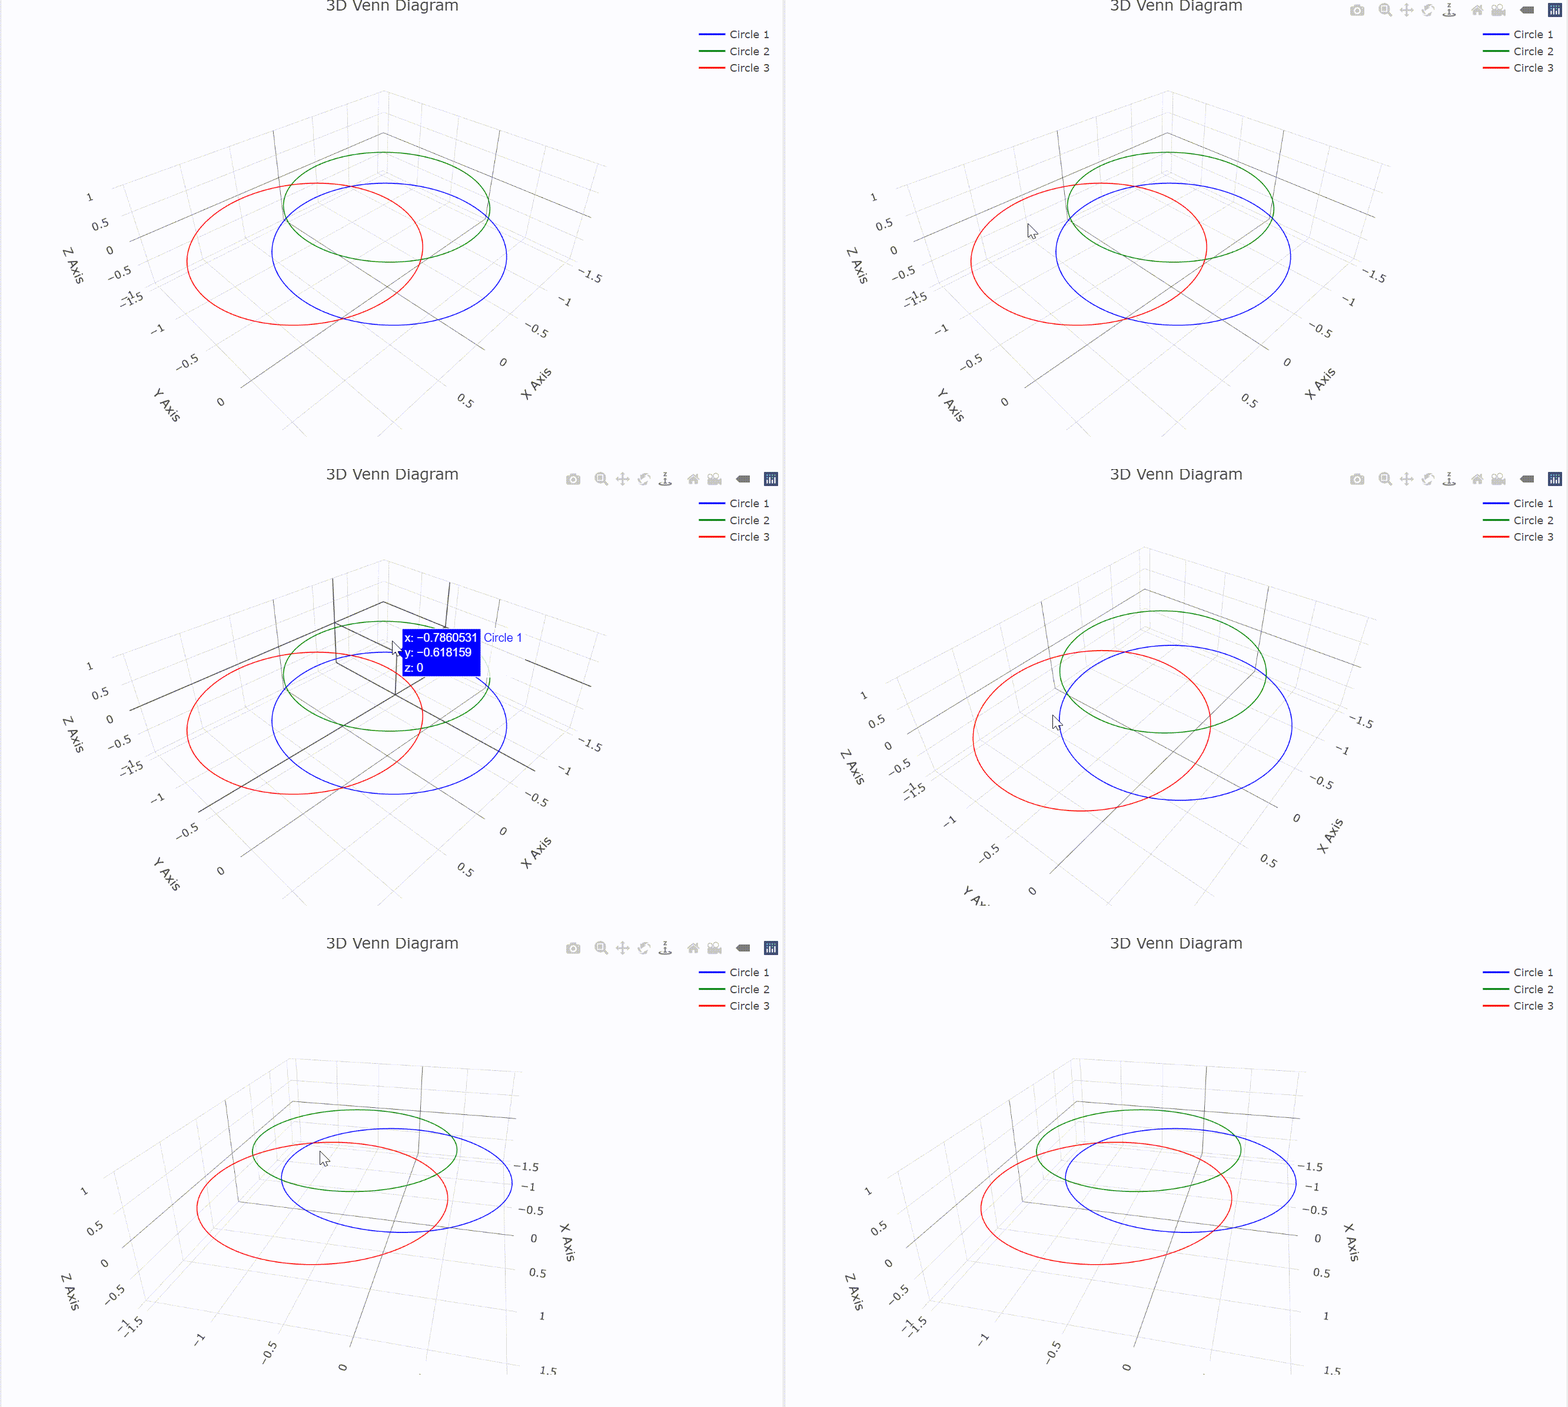
- 效果
散点图
可以通过几种不同的方式绘制3D散点图。最常用的工具包括 plotly 包和 scatterplot3d 包
使用 plotly 包
plotly 是一个非常强大的交互式图形包,支持多种3D绘图功能,包括3D散点图
示例
# 加载plotly包
library(plotly)

# 创建示例数据
set.seed(123)
data <- data.frame(
  x = rnorm(100),
  y = rnorm(100),
  z = rnorm(100)
)

# 绘制3D散点图
fig <- plot_ly(data, x = ~x, y = ~y, z = ~z, type = 'scatter3d', mode = 'markers',
                marker = list(size = 5, color = 'rgb(23, 190, 207)', opacity = 0.8))
fig <- fig %>% layout(title = "3D散点图示例",
                      scene = list(xaxis = list(title = 'X轴'),
                                   yaxis = list(title = 'Y轴'),
                                   zaxis = list(title = 'Z轴')))
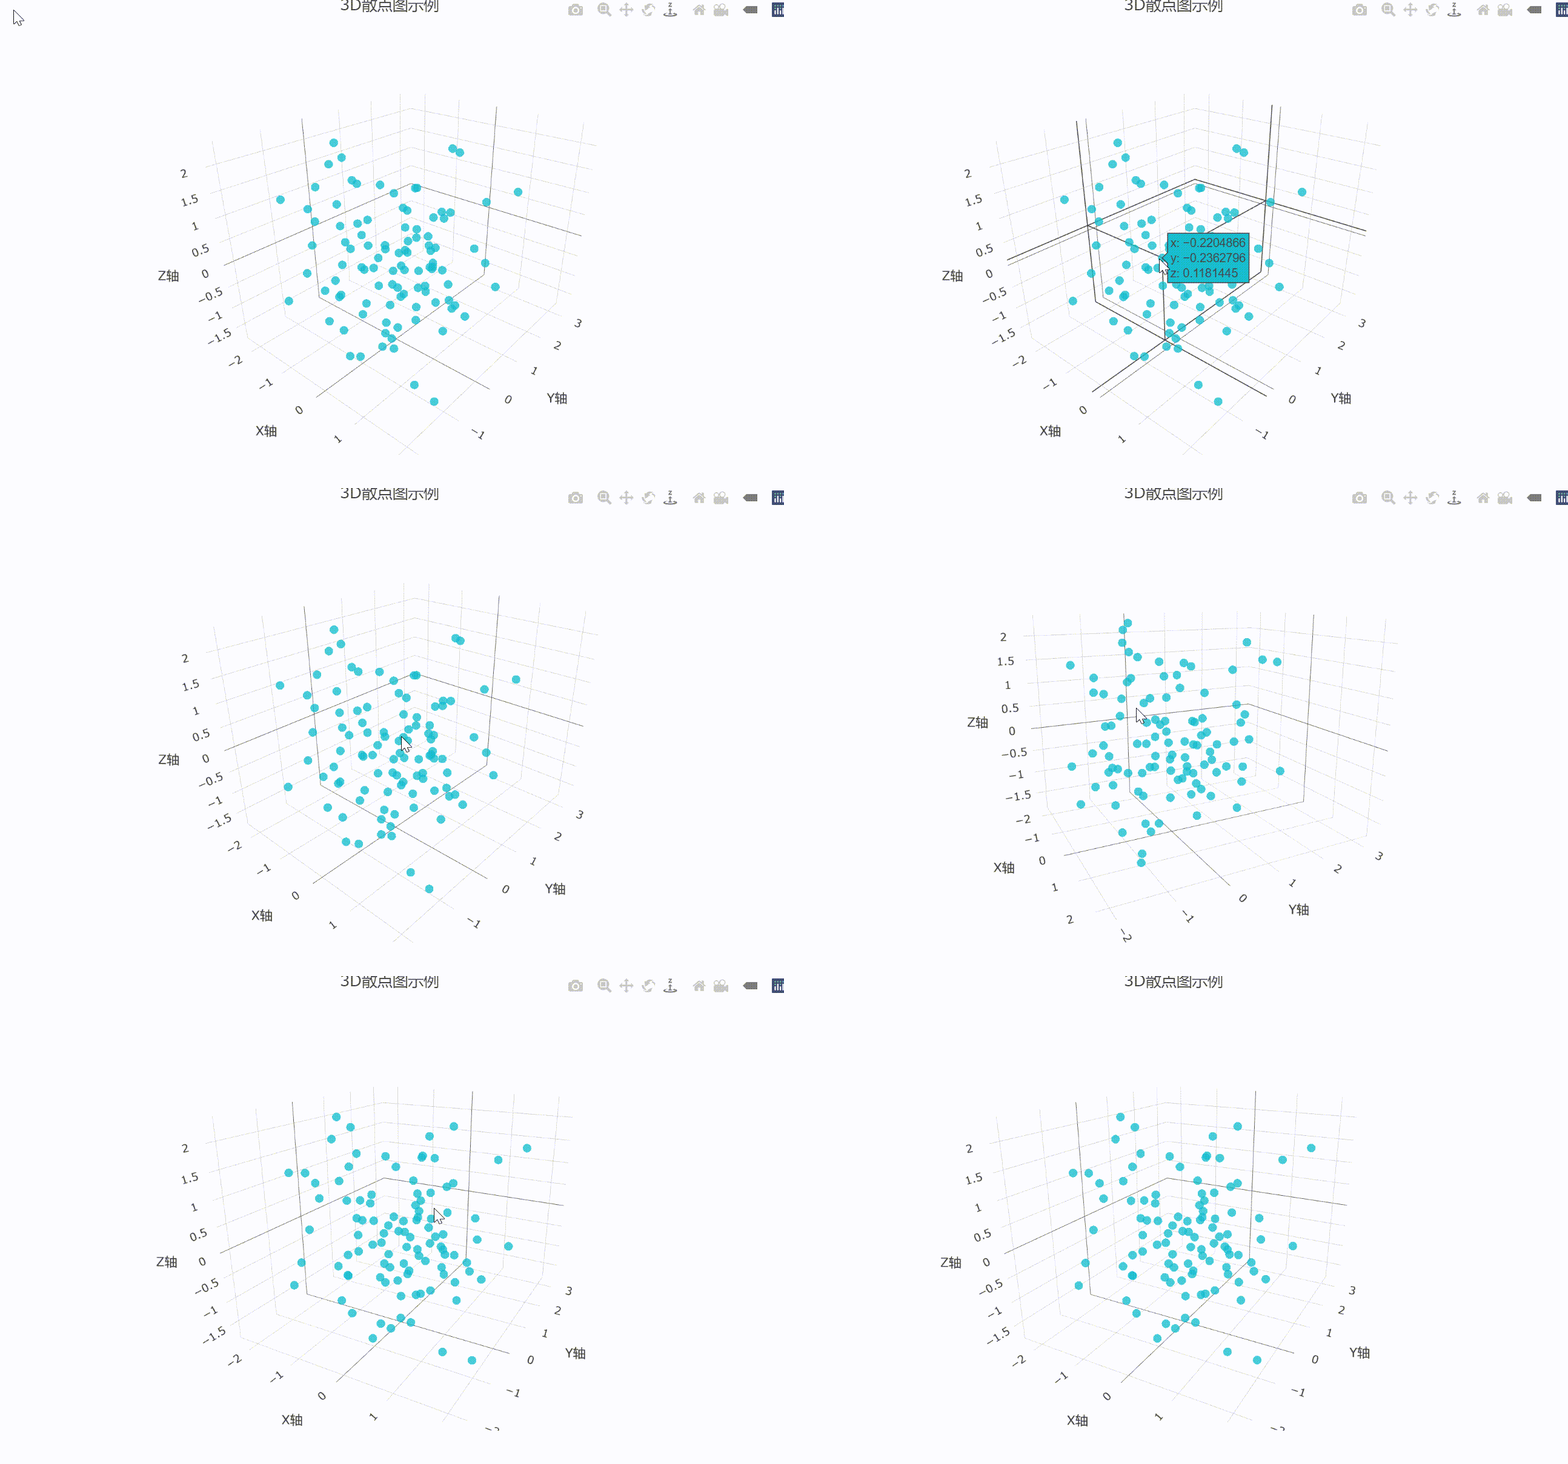
fig
解析
- plot_ly() 函数用于创建散点图对象,type = ‘scatter3d’ 指定图形类型为散点图
- layout() 用于设置图表的标题和轴标签
- 生成的图形可以在Web浏览器中交互查看
效果
使用 scatterplot3d 包
scatterplot3d 包提供了一种简单的方式来创建3D散点图,虽然功能不如 plotly 和 rgl 强大,但对于基本的3D绘图非常有效
示例
确保已安装 scatterplot3d 包:
install.packages("scatterplot3d")
# 加载scatterplot3d包
library(scatterplot3d)

# 创建示例数据
set.seed(123)
x <- rnorm(100)
y <- rnorm(100)
z <- rnorm(100)

# 绘制3D散点图
scatterplot3d(x, y, z, color = "red", pch = 16,
               xlab = "X轴", ylab = "Y轴", zlab = "Z轴",
               main = "3D散点图示例")
解析
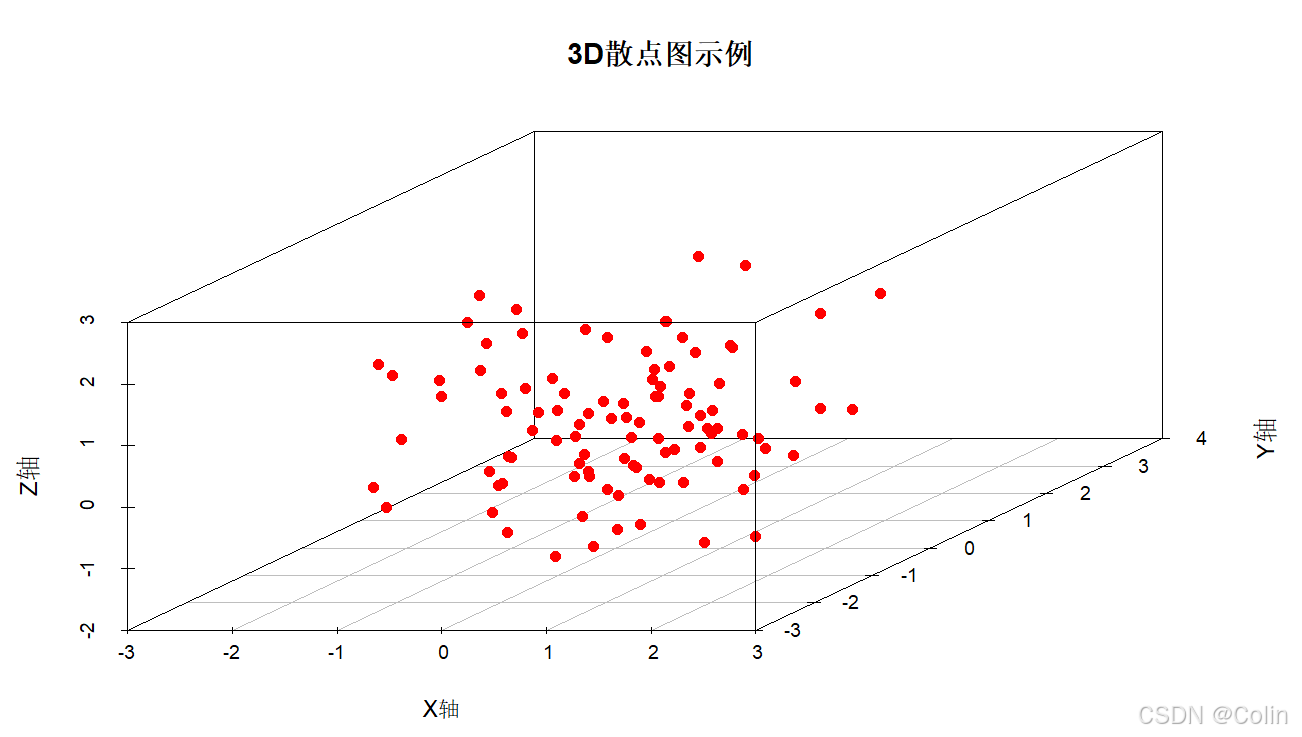
- scatterplot3d() 函数用于创建基本的3D散点图
- color 设置点的颜色,pch 设置点的类型
效果
饼图
使用 plotly 包
plotly 是一个强大的交互式图形包,能够创建各种复杂的图形,包括类似于3D饼图的效果。
示例
# 加载plotly包
library(plotly)

# 创建数据
labels <- c("A", "B", "C", "D")
values <- c(10, 20, 30, 40)

# 绘制3D饼图
fig <- plot_ly(labels = labels, values = values, type = 'pie',
                hole = 0.3,  # 控制饼图中心空洞的大小
                textinfo = 'label+percent',
                marker = list(colors = c('#FF9999','#66B2FF','#99FF99','#FFCC99')))

fig <- fig %>% layout(title = '3D饼图效果示例',
                      showlegend = TRUE,
                      scene = list(
                        xaxis = list(title = 'X轴'),
                        yaxis = list(title = 'Y轴'),
                        zaxis = list(title = 'Z轴')
                      ))

fig
解析
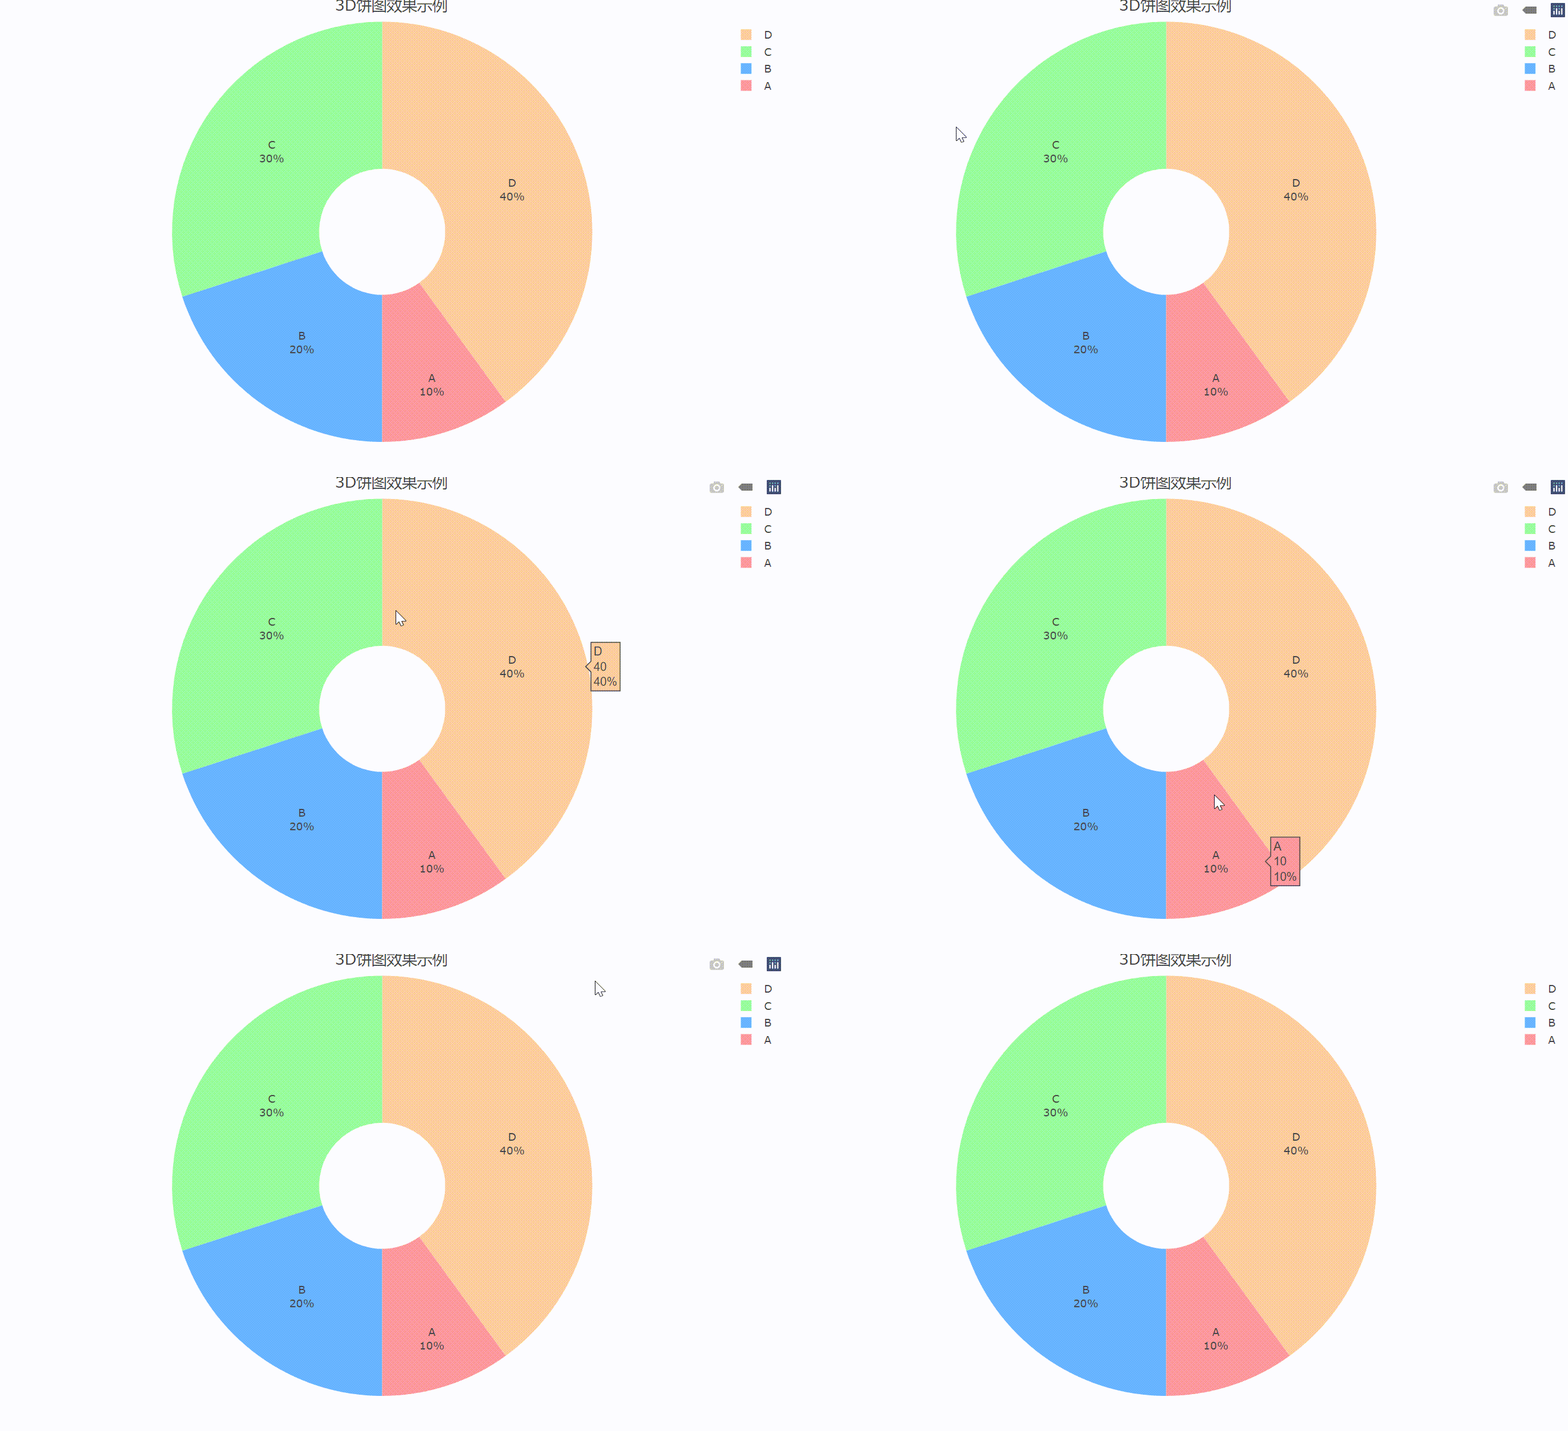
- plot_ly() 用于创建饼图对象,type = ‘pie’ 指定图形类型为饼图
- hole 参数用于创建一个环形图,这样的效果更接近3D饼图的外观
效果
使用 plotrix 包
示例
# 加载plotrix包
library(plotrix)

# 创建数据
values <- c(10, 20, 30, 40)
labels <- c("A", "B", "C", "D")
colors <- c("red", "green", "blue", "yellow")

# 绘制3D饼图
pie3D(values, labels = labels, col = colors, explode = 0.1,
      main = "3D饼图示例", radius = 0.9)
解析
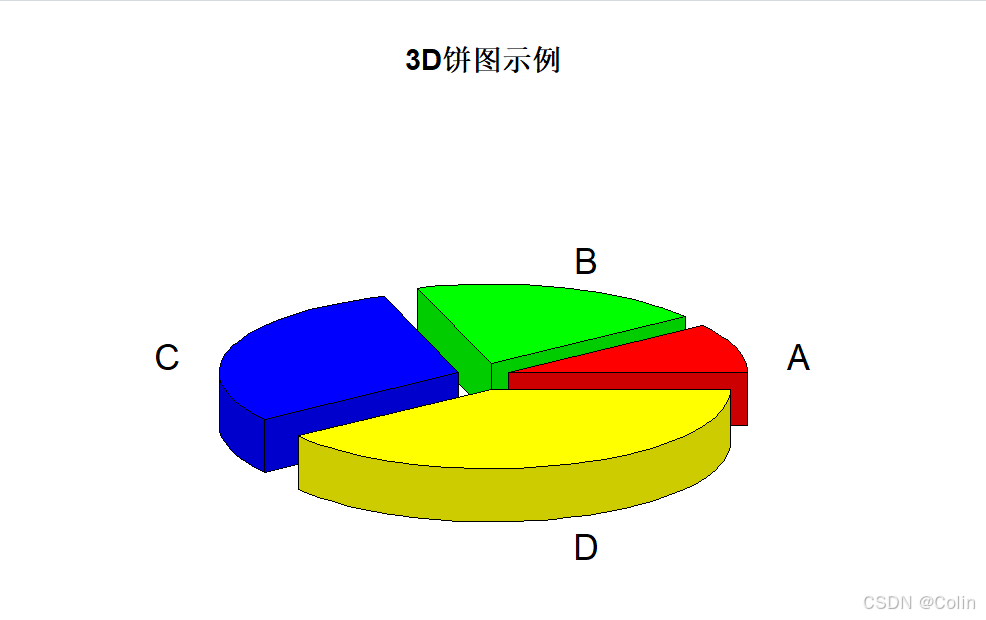
- pie3D() 函数用于创建类似3D的饼图效果,虽然它不是完全的3D图形,但通过阴影和爆炸效果模拟了3D外观
效果
折线图
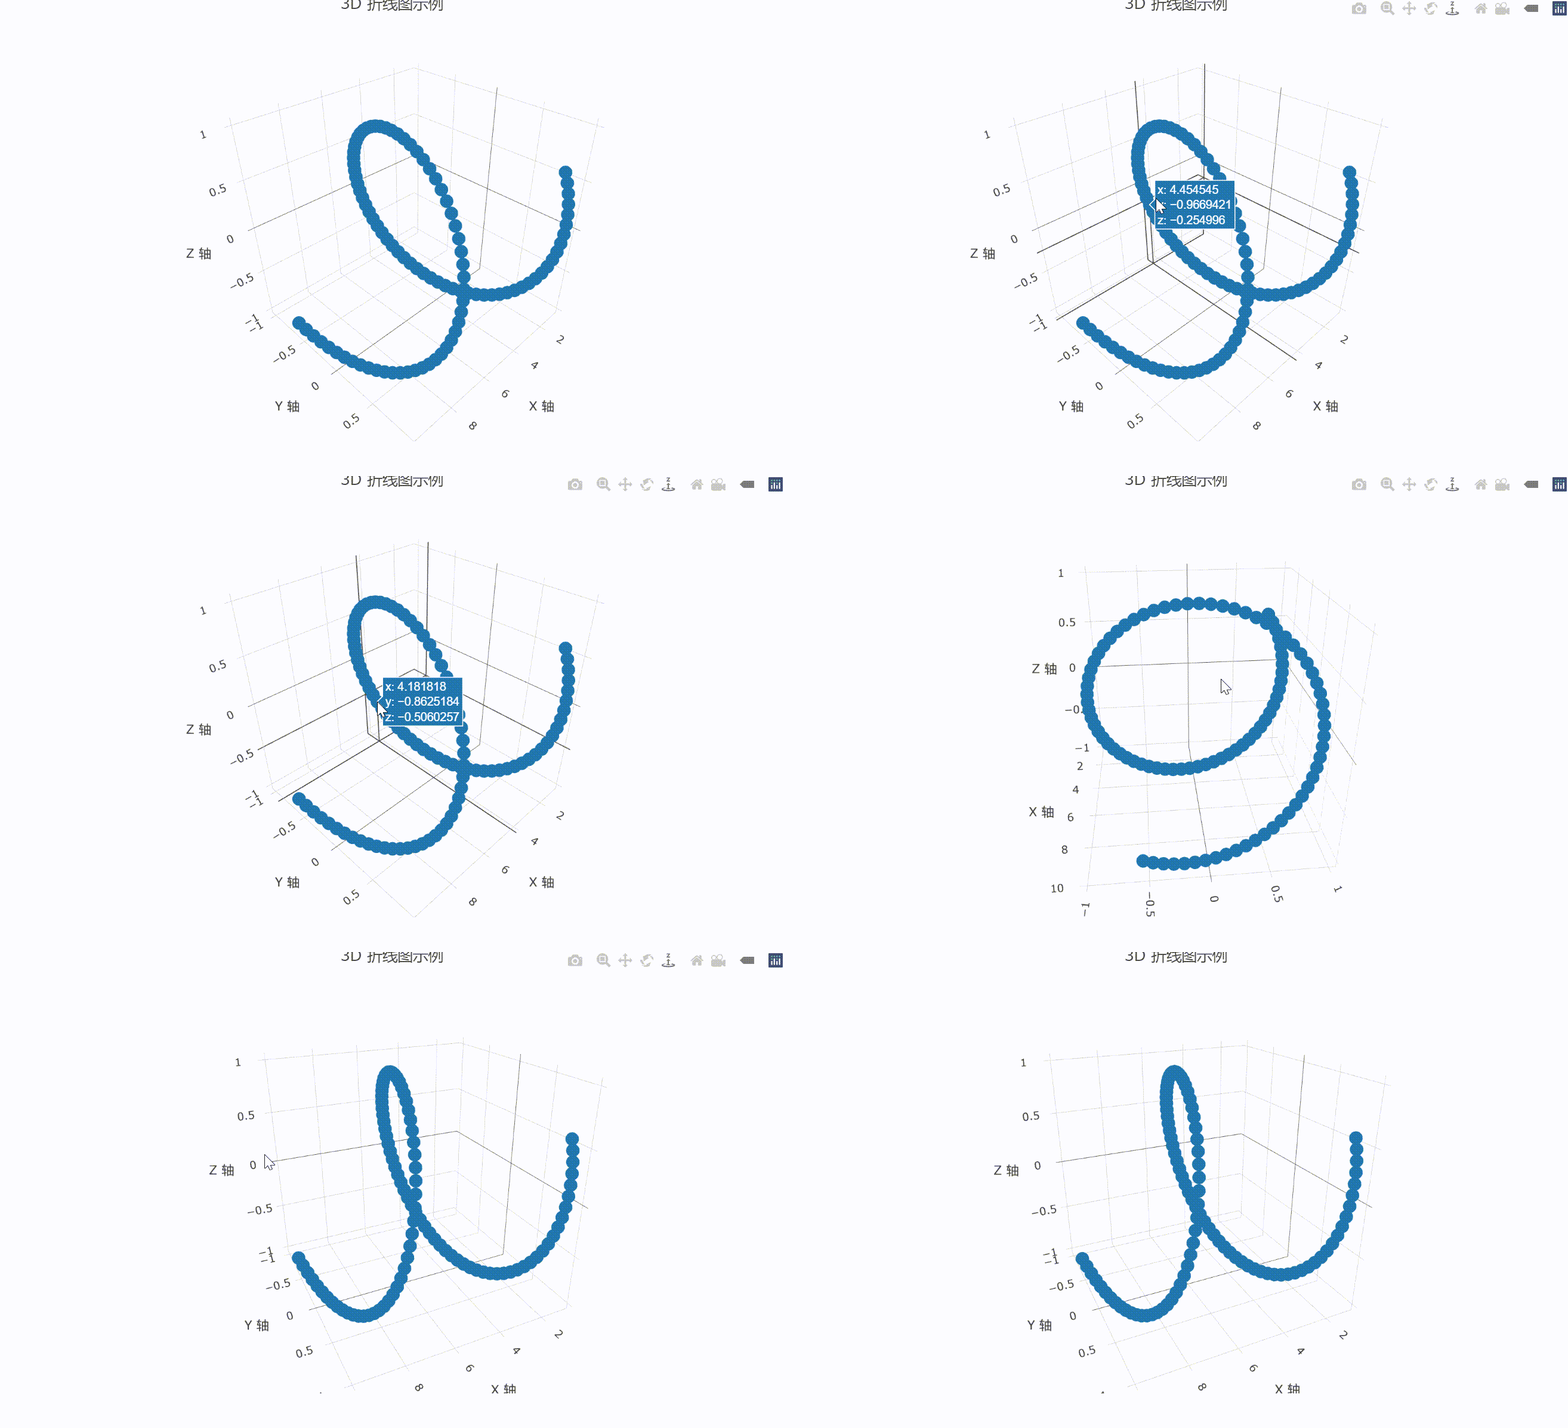
绘制 3D 折线图可以使用 plotly 或 rgl 等包。plotly 提供了直观的 3D 绘图功能,适合用于交互式图形,而 rgl 则适合用于需要更详细定制的 3D 图形
使用 plotly 包
示例
# 加载 plotly 包
library(plotly)

# 创建数据
x <- seq(1, 10, length.out = 100)
y <- sin(x)
z <- cos(x)

# 绘制 3D 折线图
fig <- plot_ly(x = x, y = y, z = z, type = 'scatter3d', mode = 'lines+markers')

# 添加标题和标签
fig <- fig %>% layout(
  title = '3D 折线图示例',
  scene = list(
    xaxis = list(title = 'X 轴'),
    yaxis = list(title = 'Y 轴'),
    zaxis = list(title = 'Z 轴')
  )
)

fig
解析
1. 创建数据:
- x:自变量序列
- y 和 z:因变量序列,分别对应 sin(x) 和 cos(x)
2. 绘制 3D 折线图:
- plot_ly() 函数创建3D 折线图,type = ‘scatter3d’ 指定 3D 散点图(包含折线),mode = ‘lines+markers’ 指定显示折线和标记点
3. 设置图形属性:
- layout() 函数设置图形的标题和坐标轴标签。
效果
使用 rgl 包
示例
# 加载 rgl 包
library(rgl)

# 创建数据
x <- seq(1, 10, length.out = 100)
y <- sin(x)
z <- cos(x)

# 绘制 3D 折线图
plot3d(x, y, z, type = 'l', col = 'blue', lwd = 2, xlab = 'X 轴', ylab = 'Y 轴', zlab = 'Z 轴')

# 添加标题
title3d(main = '3D 折线图示例')

# 设置视角
rgl.viewpoint(theta = 45, phi = 30)
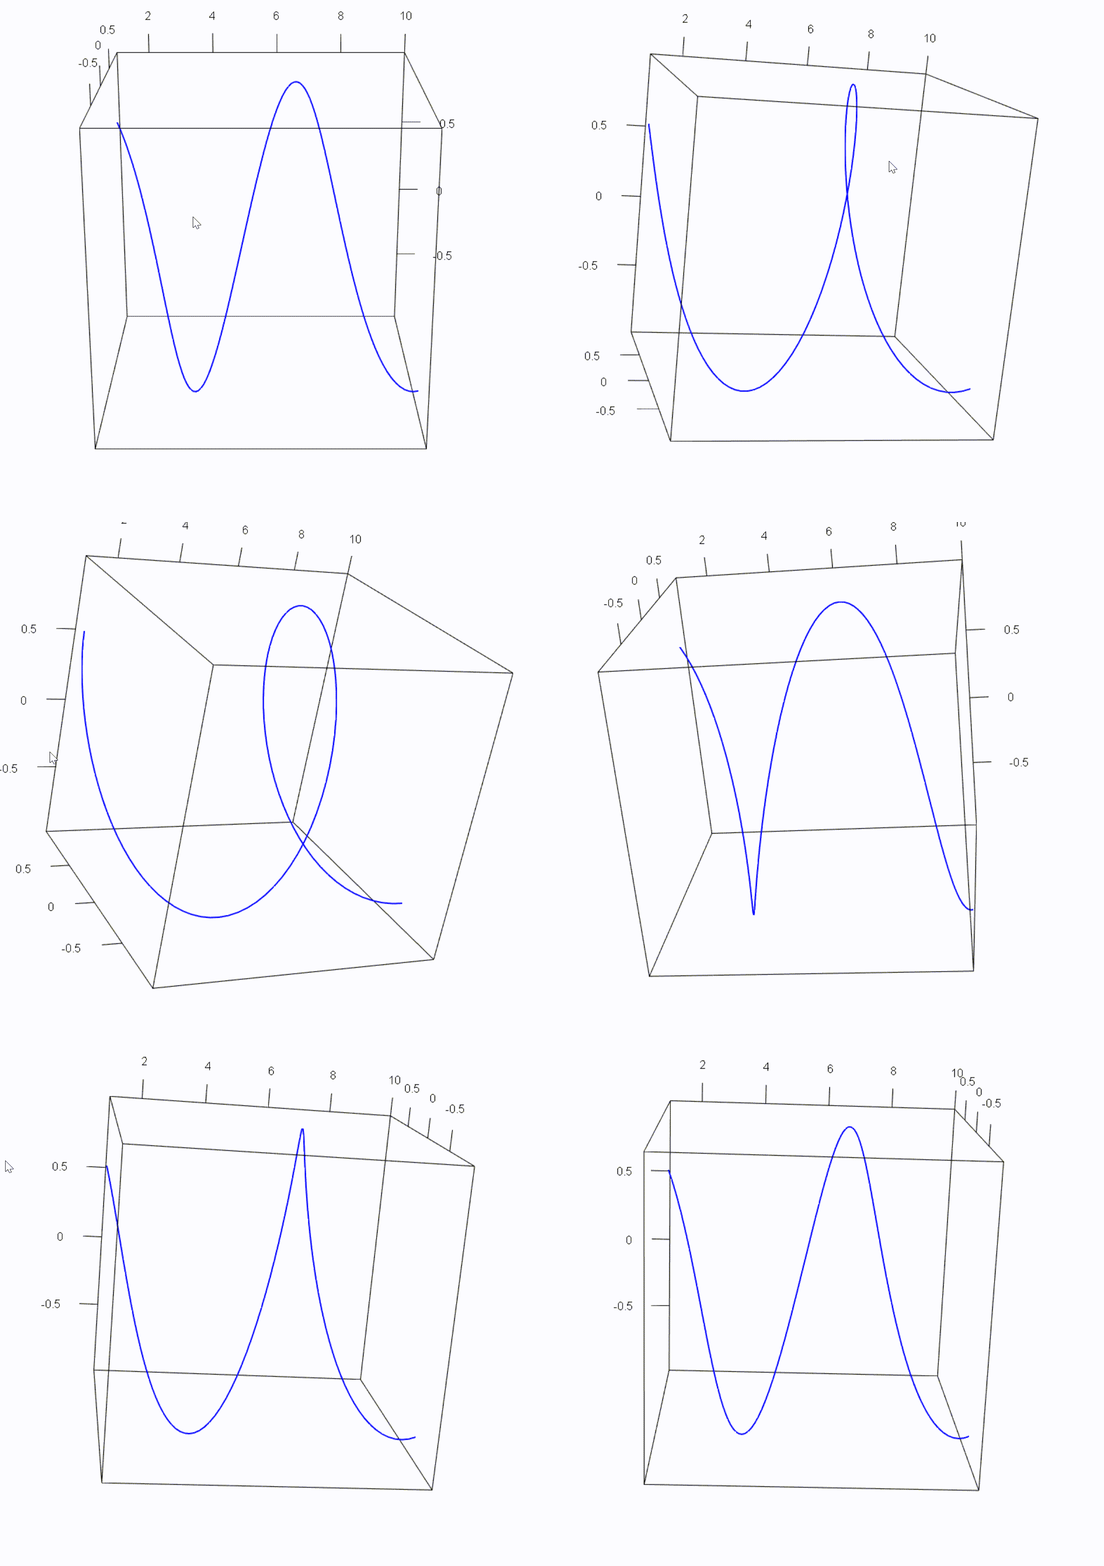
解析
1. 创建数据:
- x、y 和 z 为 3D 数据的坐标
2. 绘制 3D 折线图:
- plot3d() 函数绘制 3D 折线图,type = ‘l’ 指定绘制线条,col 设置颜色,lwd 设置线宽
3. 设置图形属性:
- title3d() 函数设置图形标题
- rgl.viewpoint() 设置视角以获得更好的 3D 视图效果
效果
柱状图
示例
# 加载 rgl 包
library(rgl)

# 创建数据
x <- c(1, 2, 3, 4)
y <- c(1, 2, 3, 4)
heights <- c(10, 20, 15, 25)

# 绘制 3D 柱状图
for (i in seq_along(x)) {
  x_pos <- x[i]
  y_pos <- y[i]
  z_height <- heights[i]

  # 生成柱状体的顶点
  x_corners <- c(x_pos - 0.5, x_pos + 0.5, x_pos + 0.5, x_pos - 0.5)
  y_corners <- c(y_pos - 0.5, y_pos - 0.5, y_pos + 0.5, y_pos + 0.5)
  z_corners <- c(0, 0, 0, 0)

  # 绘制柱状体
  rgl::polygon3d(x_corners, y_corners, z_corners, col = 'blue', alpha = 0.6)
  rgl::polygon3d(x_corners, y_corners, z_corners + z_height, col = 'red', alpha = 0.6)

  # 绘制柱状体的侧面
  rgl::polygon3d(c(x_corners[1], x_corners[2], x_corners[2], x_corners[1]),
                 c(y_corners[1], y_corners[1], y_corners[2], y_corners[2]),
                 c(0, 0, z_height, z_height),
                 col = 'grey', alpha = 0.5)
}

# 设置视角和轴
rgl::rgl.viewpoint(theta = 45, phi = 30)
rgl::axes3d()
rgl::title3d(main = '3D 柱状图示例')

# 使图形窗口保持打开状态
rgl::rglwidget()
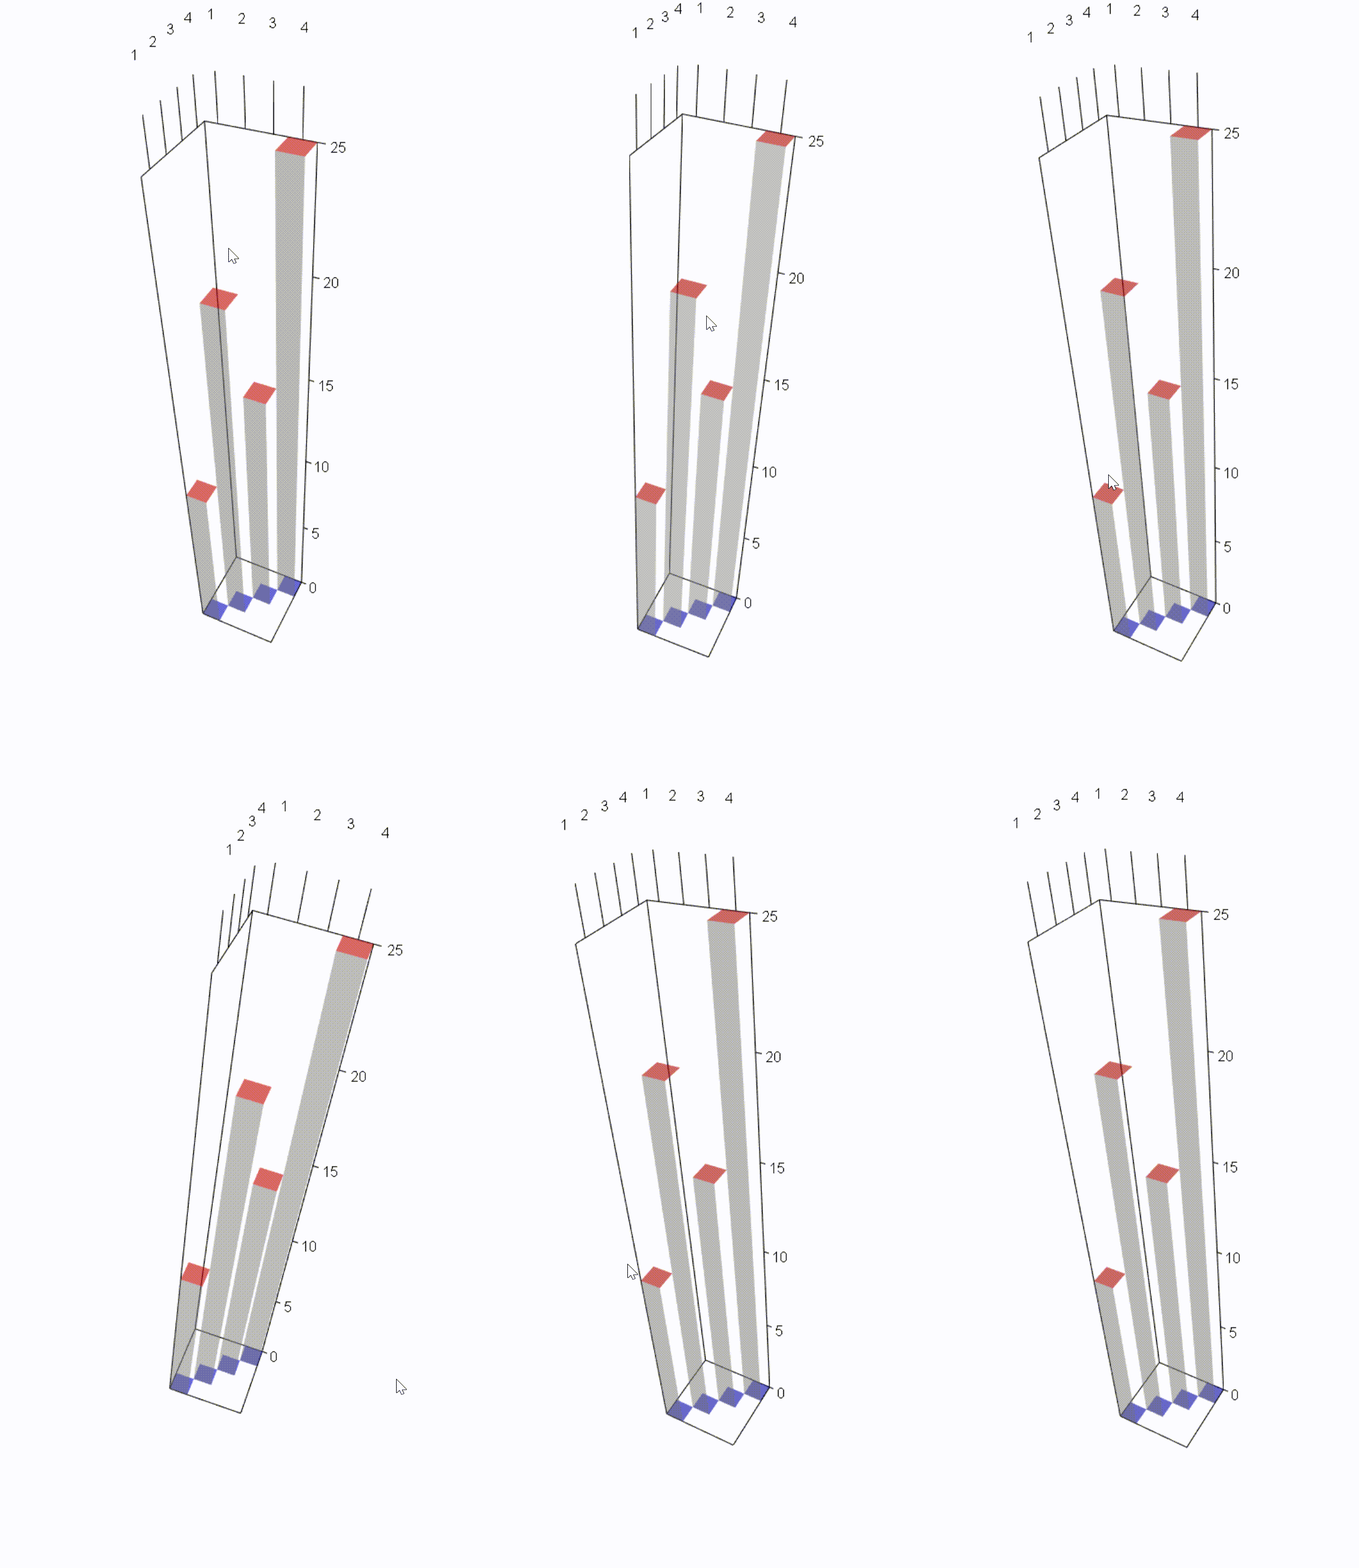
解析
1. 创建数据:
- x 和 y 是柱状图的坐标位置
- heights 是柱状图的高度
2. 使用 rgl:
- polygon3d() 函数绘制柱状体的底面、顶部和侧面
- rgl.viewpoint() 设置视角以获得更好的 3D 视图效果
- rglwidget() 保持图形窗口打开状态,以便进行交互查看
效果
箱线图
示例
library(rgl)

# 生成一些示例数据
set.seed(123)
data <- matrix(rnorm(300), ncol = 3)

# 定义一个函数来绘制一个箱线图的长方体
draw_box <- function(x, y, z, width, height, depth, col = "blue") {
  # 绘制箱子的底面
  quads3d(x + c(-width/2, width/2, width/2, -width/2),
          y + c(-height/2, -height/2, height/2, height/2),
          z + rep(-depth/2, 4),
          col = col, alpha = 0.5)
  # 绘制箱子的顶面
  quads3d(x + c(-width/2, width/2, width/2, -width/2),
          y + c(-height/2, -height/2, height/2, height/2),
          z + rep(depth/2, 4),
          col = col, alpha = 0.5)
  # 绘制箱子的侧面
  quads3d(x + c(-width/2, width/2, width/2, -width/2),
          y + c(-height/2, -height/2, -height/2, -height/2),
          z + c(-depth/2, -depth/2, depth/2, depth/2),
          col = col, alpha = 0.5)
  quads3d(x + c(-width/2, width/2, width/2, -width/2),
          y + c(height/2, height/2, height/2, height/2),
          z + c(-depth/2, -depth/2, depth/2, depth/2),
          col = col, alpha = 0.5)
  quads3d(x + c(-width/2, width/2, width/2, -width/2),
          y + c(-height/2, height/2, height/2, -height/2),
          z + c(-depth/2, -depth/2, -depth/2, -depth/2),
          col = col, alpha = 0.5)
  quads3d(x + c(-width/2, width/2, width/2, -width/2),
          y + c(-height/2, height/2, height/2, -height/2),
          z + c(depth/2, depth/2, depth/2, depth/2),
          col = col, alpha = 0.5)
}

# 创建一个 3D 窗口
open3d()

# 绘制几个 3D 箱线图长方体
for (i in 1:ncol(data)) {
  # 计算长方体的边界
  q1 <- quantile(data[, i], 0.25)
  q3 <- quantile(data[, i], 0.75)
  median <- median(data[, i])
  lower <- min(data[, i])
  upper <- max(data[, i])

  # 绘制长方体
  draw_box(x = i, y = median, z = 0, width = 0.5, height = q3 - q1, depth = 1,
           col = "blue")
}

# 添加坐标轴标签
axes3d()
title3d(main = "3D Boxplot", xlab = "Sample", ylab = "Value", zlab = "Depth")
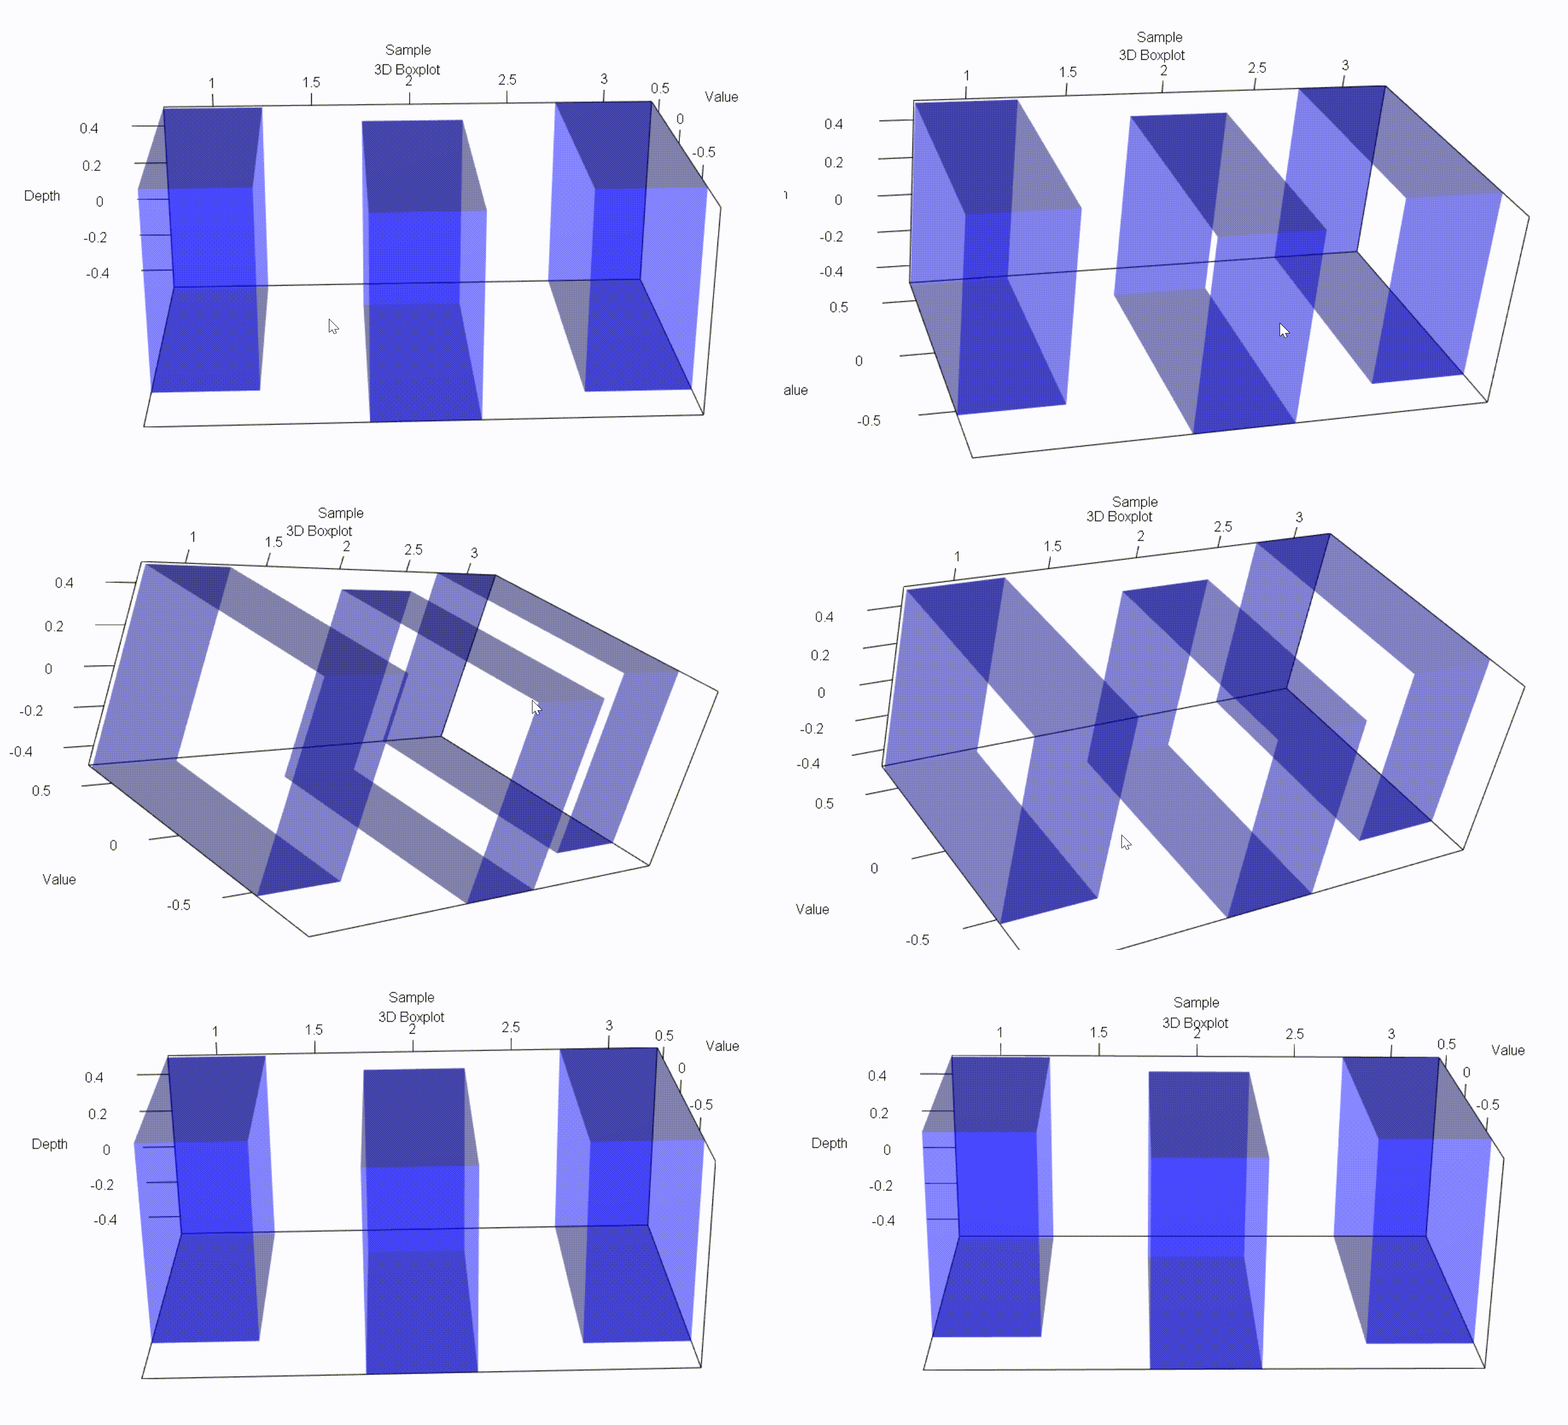
解析
- draw_box 函数创建了一个 3D 长方体,模拟箱线图的外观
- 使用 quads3d 函数绘制长方体的各个面
- 对于每个数据列,计算了四分位数和中位数,并在 3D 空间中绘制了长方体
效果
直方图
示例
# 安装和加载必要的包
install.packages("rgl")
library(rgl)

# 生成示例数据
set.seed(123)
data <- matrix(rnorm(1000), ncol = 10)  # 10组数据,每组100个数据点

# 计算每组数据的频数
hist_data <- apply(data, 2, function(x) hist(x, breaks = 10, plot = FALSE))

# 清空之前的图形
open3d()

# 设定颜色
colors <- rainbow(length(hist_data))

# 绘制3D直方图
for (i in 1:length(hist_data)) {
  for (j in 1:(length(hist_data[[i]]$breaks) - 1)) {
    x0 <- hist_data[[i]]$breaks[j]    # 柱体底边左端
    x1 <- hist_data[[i]]$breaks[j + 1] # 柱体底边右端
    y0 <- i - 0.5                       # 柱体底边在Y轴上的位置
    y1 <- i + 0.5                       # 柱体顶边在Y轴上的位置
    z0 <- 0                            # 柱体底边的Z坐标
    z1 <- hist_data[[i]]$counts[j]    # 柱体顶边的Z坐标

    # 绘制底面
    quads3d(
      x = c(x0, x0, x1, x1),
      y = c(y0, y1, y1, y0),
      z = rep(z0, 4),
      col = colors[i],
      alpha = 0.5
    )

    # 绘制顶面
    quads3d(
      x = c(x0, x0, x1, x1),
      y = c(y0, y1, y1, y0),
      z = rep(z1, 4),
      col = colors[i],
      alpha = 0.5
    )

    # 绘制侧面
    quads3d(
      x = c(x0, x0, x0, x0),
      y = c(y0, y1, y1, y0),
      z = c(z0, z0, z1, z1),
      col = colors[i],
      alpha = 0.5
    )

    quads3d(
      x = c(x1, x1, x1, x1),
      y = c(y0, y1, y1, y0),
      z = c(z0, z0, z1, z1),
      col = colors[i],
      alpha = 0.5
    )
  }
}

# 添加坐标轴和标题
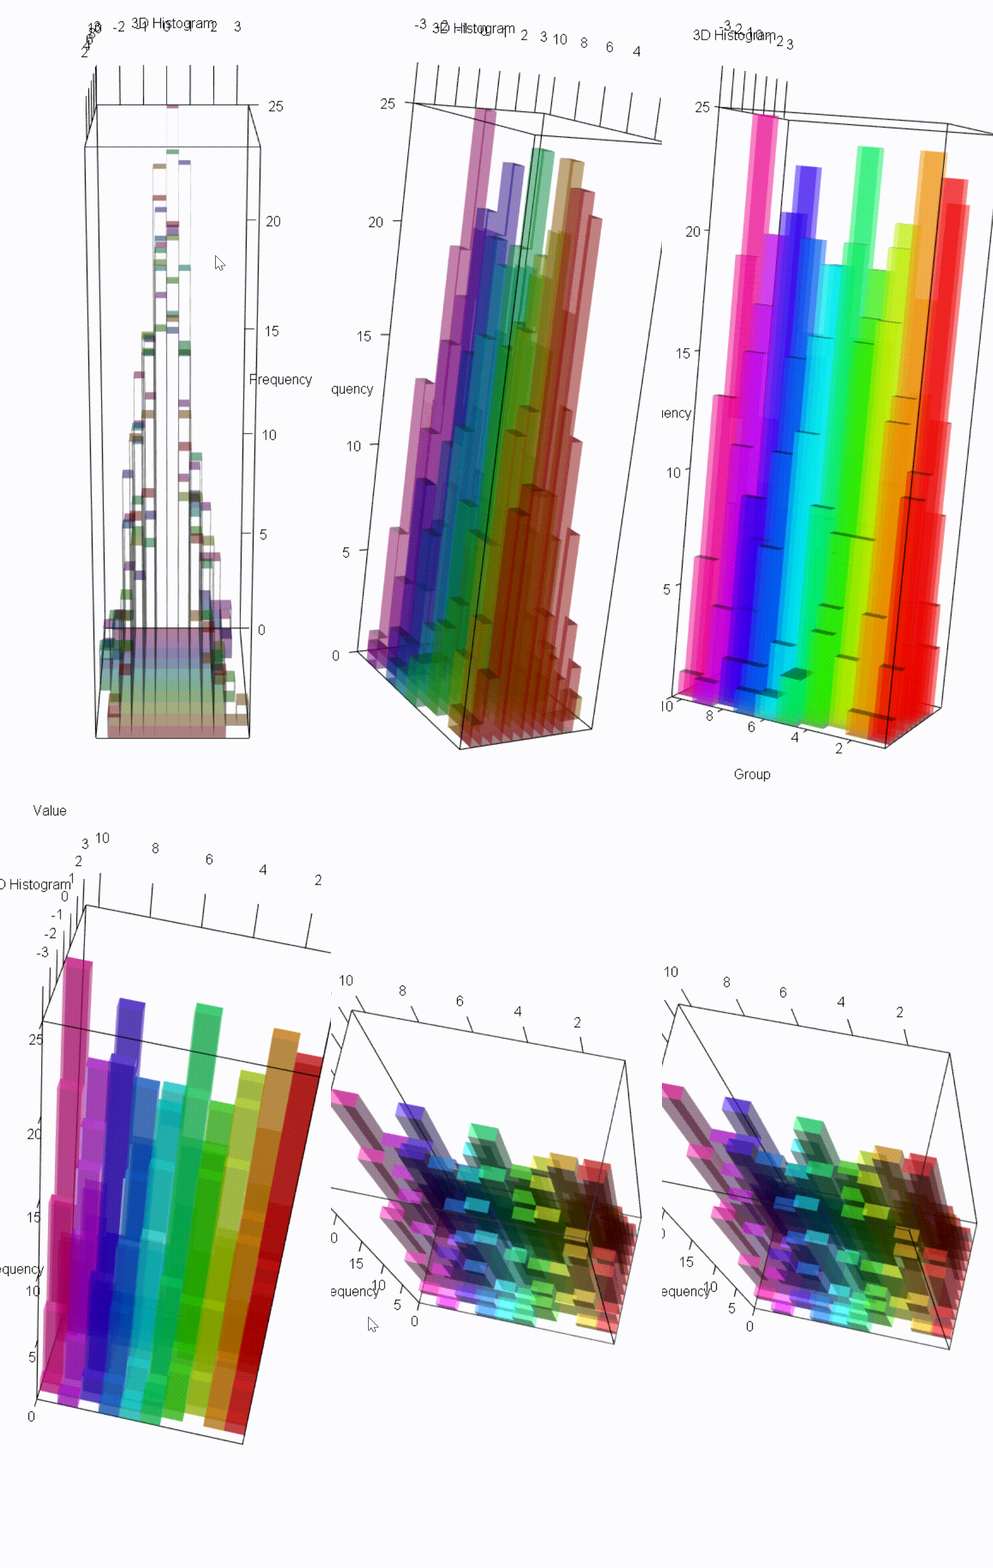
axes3d(edges = "bbox", xlab = "Value", ylab = "Group", zlab = "Frequency", box = TRUE)
title3d("3D Histogram", xlab = "Value", ylab = "Group", zlab = "Frequency")
解析
1. 坐标轴: 使用 axes3d 函数绘制坐标轴和标签,edges = “bbox” 表示显示边界框的坐标轴
2. 柱体: 每个柱体的底面、顶面和侧面都用 quads3d 绘制
3. 颜色: 使用 rainbow 函数生成颜色,并将其应用于每组数据的柱体
效果
等高线图
使用 plotly 包(方式1)
示例
# 安装和加载必要的包
install.packages("plotly")
library(plotly)

# 生成示例数据
n <- 50
x <- seq(-10, 10, length.out = n)
y <- seq(-10, 10, length.out = n)
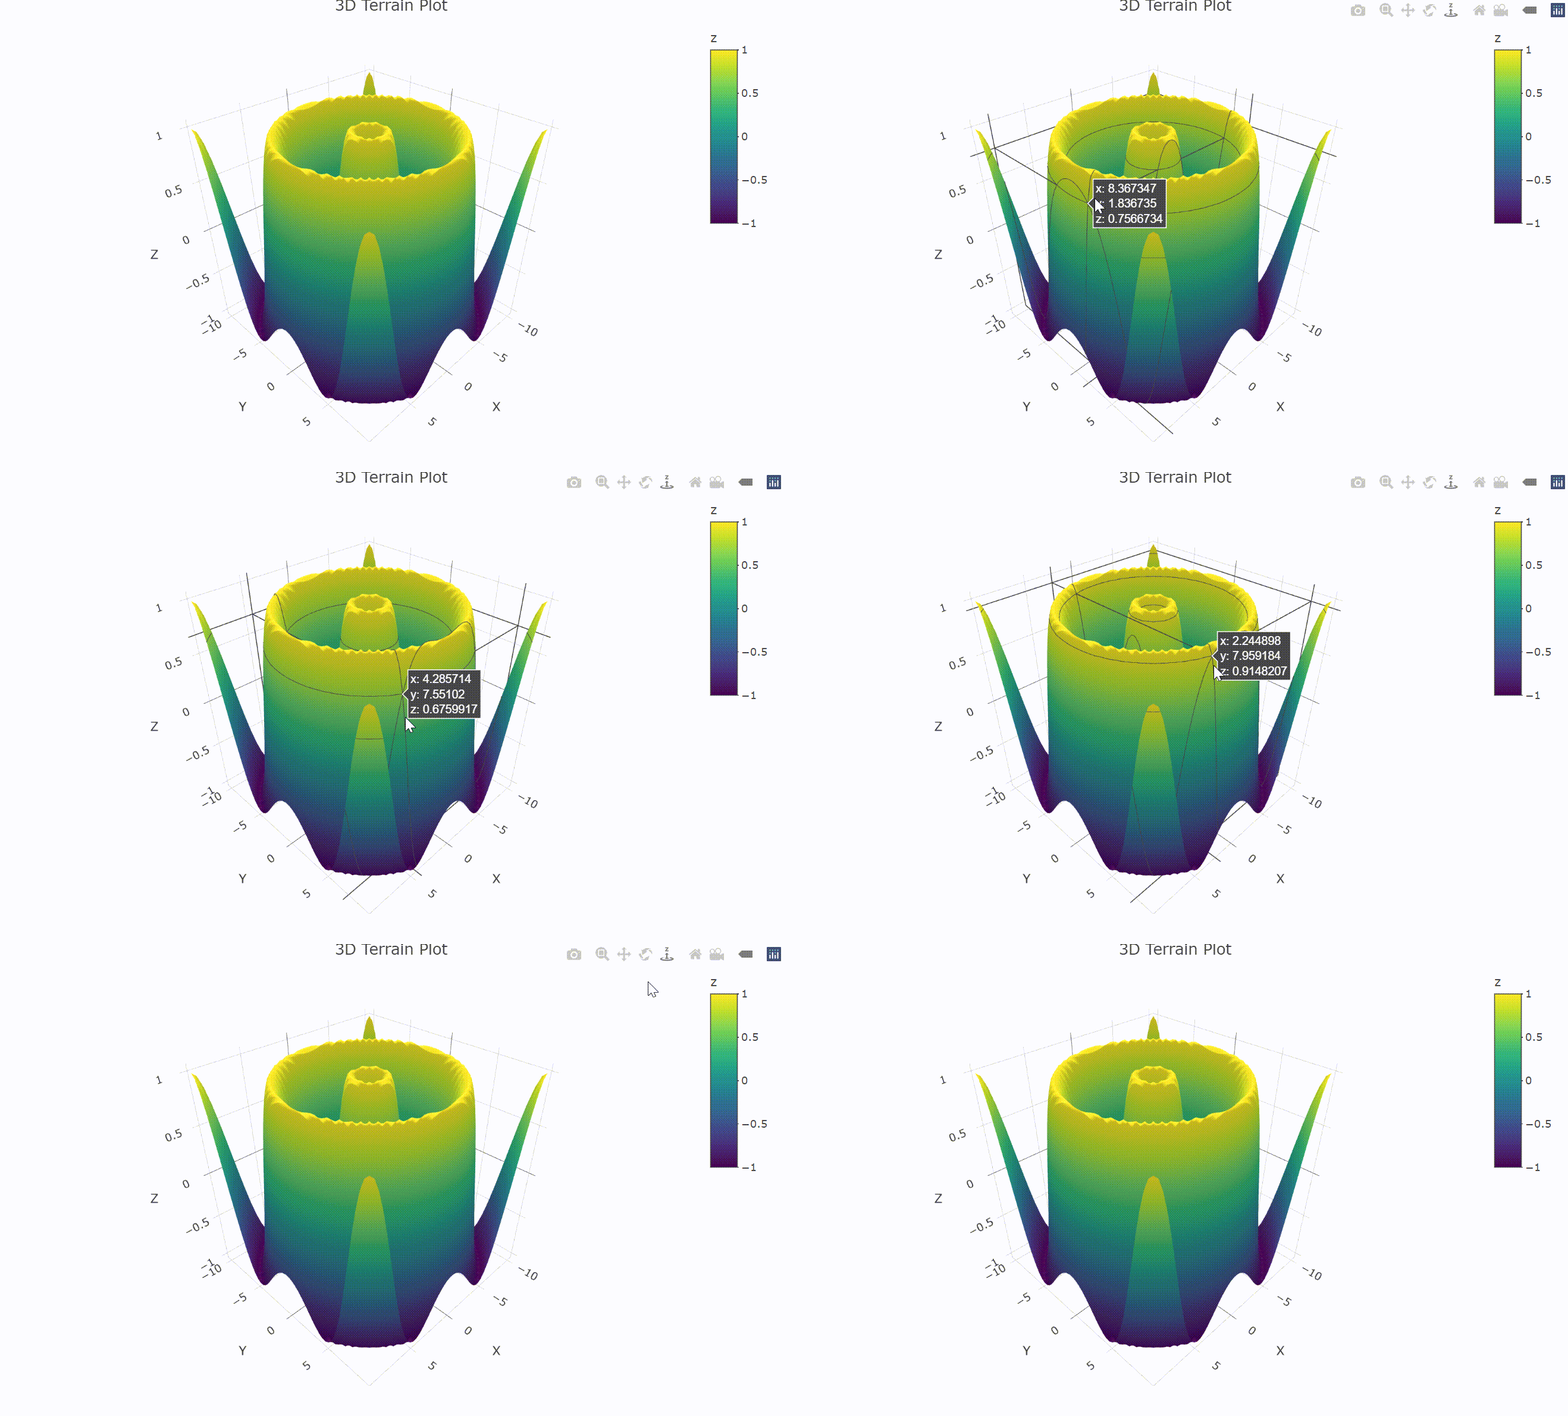
z <- outer(x, y, function(x, y) sin(sqrt(x^2 + y^2)))

# 绘制3D等高线图
plot_ly(z = ~z, x = ~x, y = ~y, type = "surface") %>%
  layout(title = "3D Terrain Plot",
         scene = list(
           xaxis = list(title = "X"),
           yaxis = list(title = "Y"),
           zaxis = list(title = "Z")
         ))
解析
- plot_ly 函数用于绘制图形,type = “surface” 指定绘制3D等高线图
- layout 函数用于设置图形的标题和坐标轴标签
效果
使用 plotly 包(方式2)
示例
library(plotly)

# 生成示例数据
set.seed(123)
x <- rnorm(100)
y <- rnorm(100)
z <- rnorm(100)

# 创建等高线图数据
x_bins <- seq(min(x), max(x), length.out = 10)
y_bins <- seq(min(y), max(y), length.out = 10)
x_cut <- cut(x, breaks = x_bins)
y_cut <- cut(y, breaks = y_bins)

# 计算每个箱子中的数据量
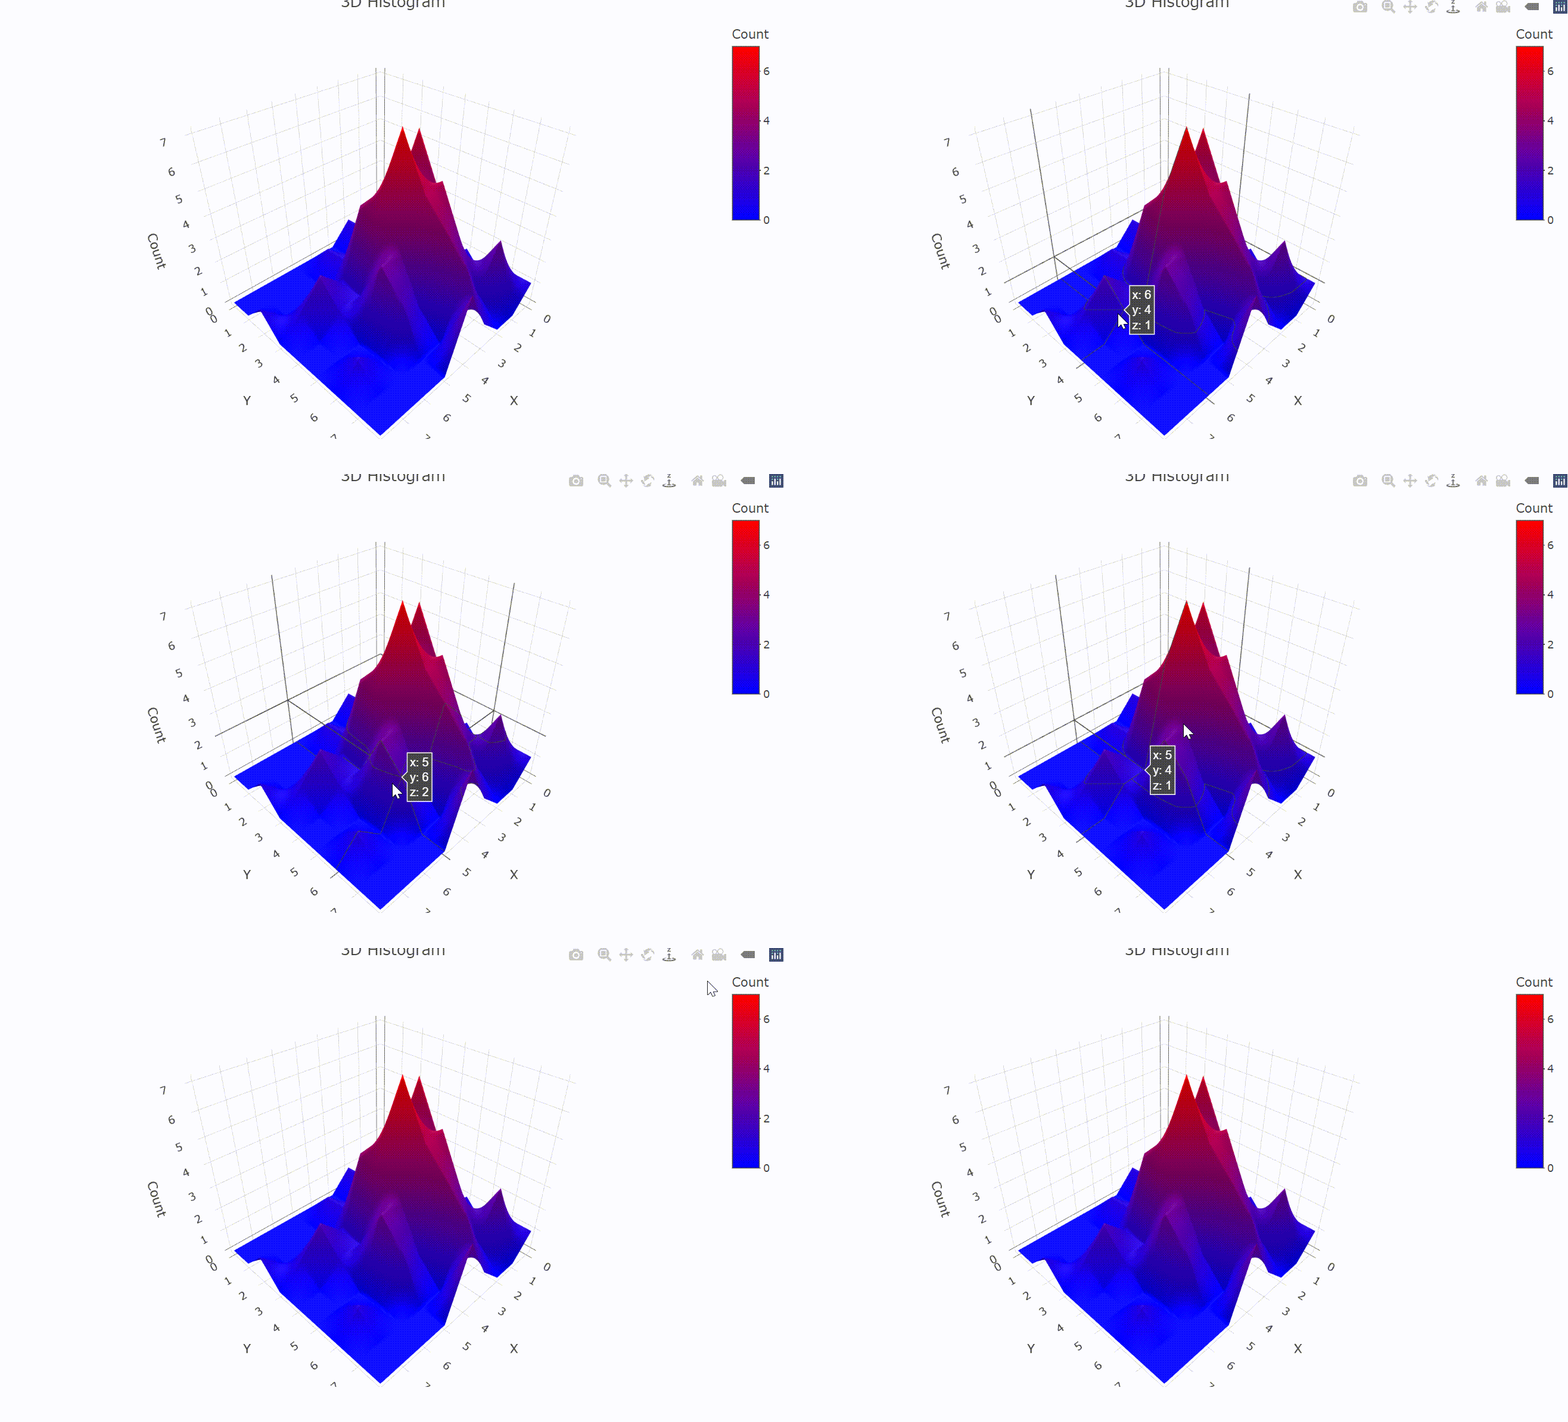
hist_data <- table(x_cut, y_cut)

# 转换为矩阵格式
z_data <- as.matrix(hist_data)

# 绘制3D直方图
plot_ly(
  z = z_data,
  type = 'surface',
  colorscale = list(c(0, 1), c('blue', 'red')),
  colorbar = list(title = 'Count')
) %>%
  layout(
    title = "3D Histogram",
    scene = list(
      xaxis = list(title = 'X'),
      yaxis = list(title = 'Y'),
      zaxis = list(title = 'Count')
    )
  )
解析
1. 生成数据:
- 生成 x, y, z 随机数据
2. 计算直方图数据:
- 使用 cut 将 x 和 y 数据分箱
- 使用 table 计算每个箱子的频数
3. 绘制等高线图:
- 使用 plot_ly 和 type = ‘surface’ 绘制3D表面图
- 传递 z_data 矩阵表示每个箱子的频数
- colorscale 和 colorbar 用于设置颜色和图例
效果
曲线图
示例
# 加载必要的包
library(plotly)

# 生成 3D 螺旋曲线数据
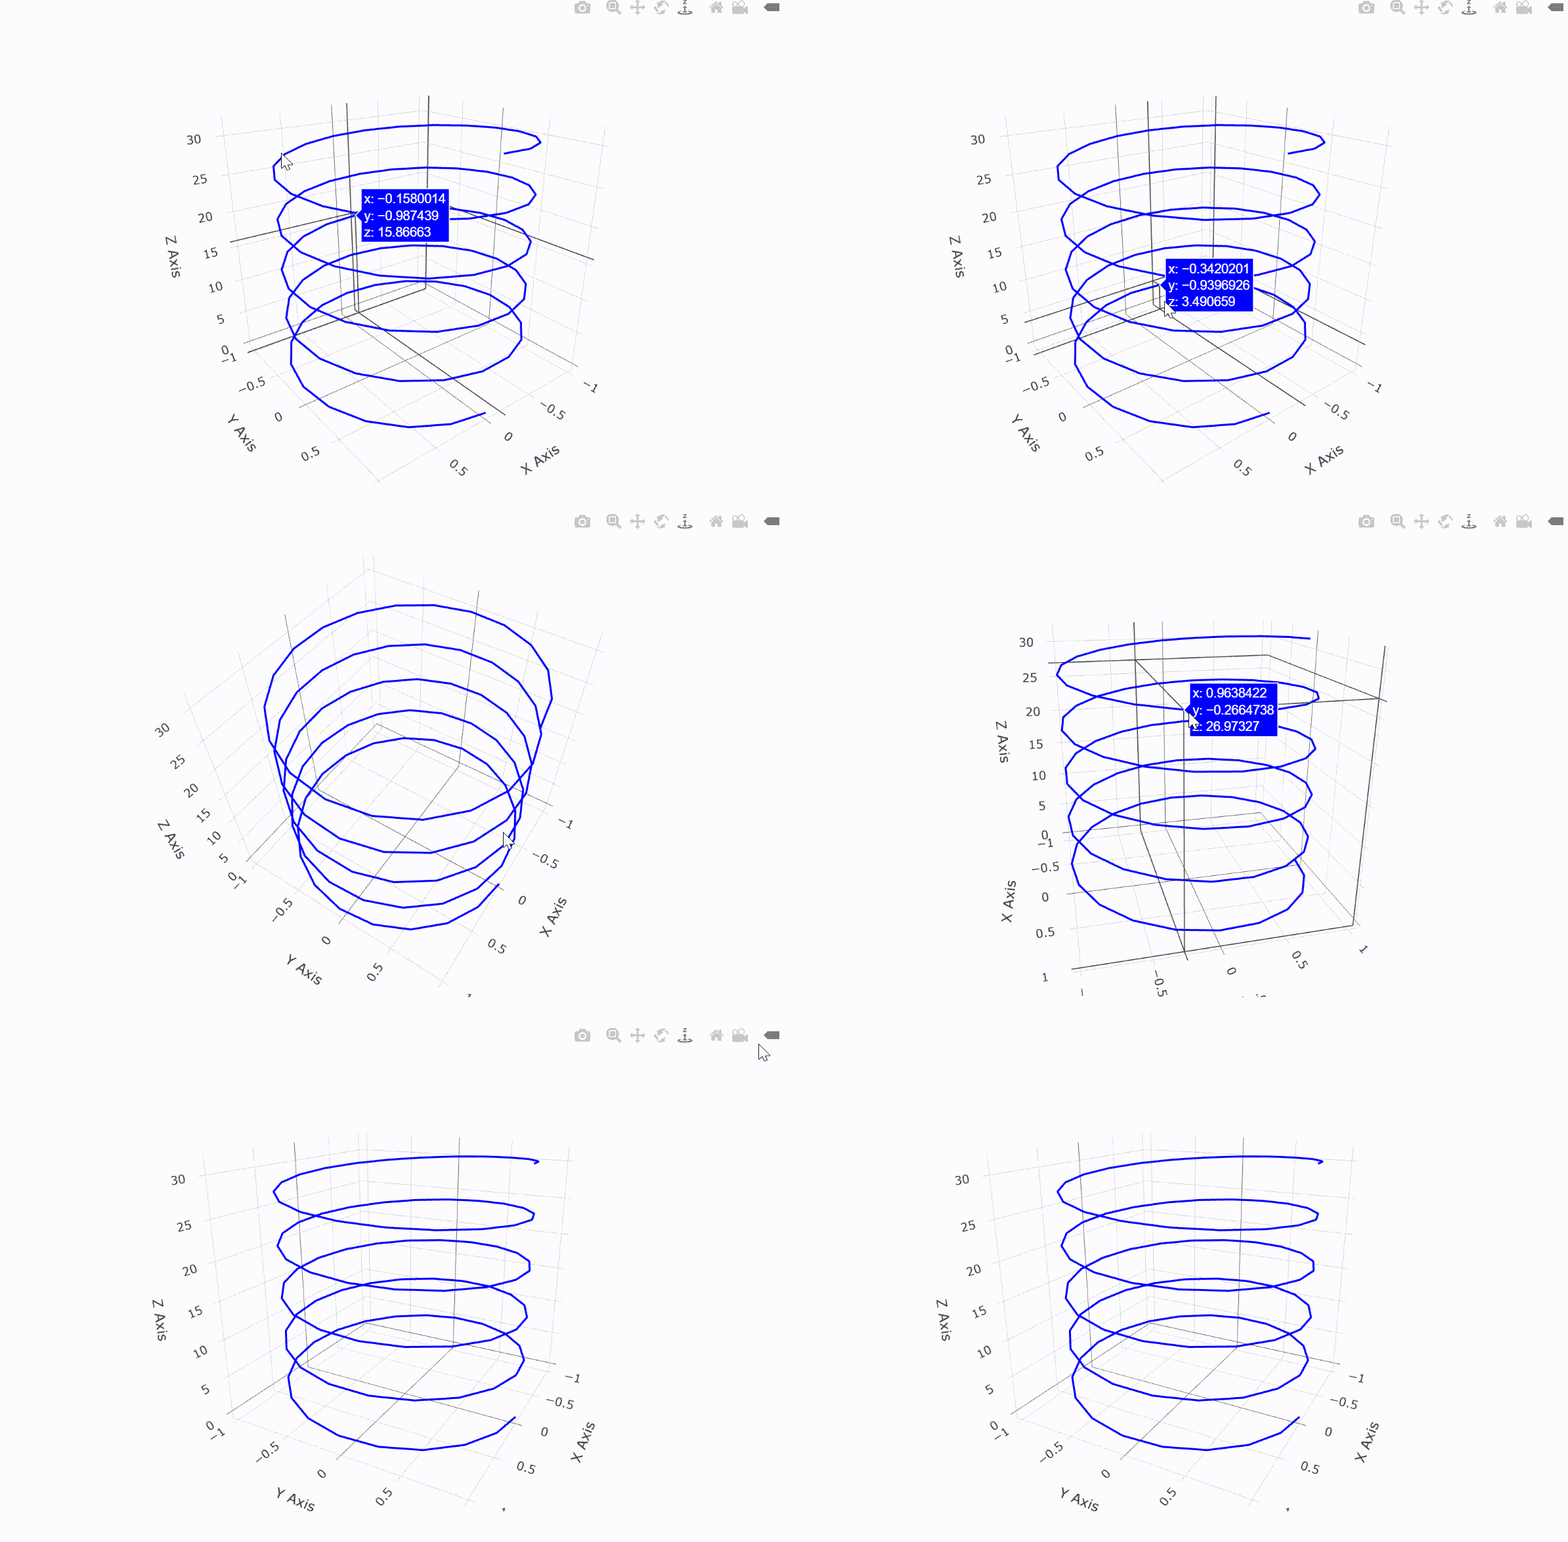
t <- seq(0, 10 * pi, length.out = 100)
x <- sin(t)
y <- cos(t)
z <- t

# 创建数据框
data <- data.frame(
  t = t,
  x = x,
  y = y,
  z = z
)

# 绘制 3D 曲线图
fig <- plot_ly(
  data = data,
  x = ~x,
  y = ~y,
  z = ~z,
  type = 'scatter3d',
  mode = 'lines',
  line = list(width = 4, color = 'blue')
) %>%
  layout(
    scene = list(
      xaxis = list(title = 'X Axis'),
      yaxis = list(title = 'Y Axis'),
      zaxis = list(title = 'Z Axis')
    )
  )

# 显示图形
fig
解析
1. 生成 3D 螺旋曲线数据:
- t 是参数,用于生成曲线的点
- x 和 y 是通过 sin(t) 和 cos(t) 生成的曲线的横纵坐标
- z 是随 t 增长的直线分量,用于使曲线在 z 轴上上升
2. 创建数据框:
- 将生成的数据存储在数据框 data 中,以便用于绘图
3. 绘制 3D 曲线图:
- plot_ly() 函数用于创建图形对象,type = ‘scatter3d’ 表示绘制 3D 散点图,而 mode = ‘lines’ 指定将点连接成线形成曲线
- line 参数用于设置线条的宽度和颜色
4. 设置布局:
- layout() 函数用于设置坐标轴的标题以及其他图形布局选项
效果
热力图
示例
# 加载必要的包
library(plotly)

# 生成模拟数据
set.seed(123)
x <- seq(-10, 10, length.out = 30)
y <- seq(-10, 10, length.out = 30)
z <- seq(-10, 10, length.out = 30)
data <- expand.grid(x = x, y = y, z = z)

# 计算热力图值,这里使用一个简单的函数作为例子
data$values <- with(data, sin(sqrt(x^2 + y^2 + z^2)))

# 绘制 3D 热力图
fig <- plot_ly(
  data,
  x = ~x,
  y = ~y,
  z = ~z,
  color = ~values,
  colors = colorRamp(c('blue', 'green', 'yellow', 'red')),
  type = 'mesh3d',
  intensity = ~values
) %>%
  layout(
    scene = list(
      xaxis = list(title = 'X Axis'),
      yaxis = list(title = 'Y Axis'),
      zaxis = list(title = 'Z Axis')
    ),
    coloraxis = list(colorbar = list(title = 'Intensity'))
  )

# 显示图形
fig
解析
1. 生成模拟数据:
- x、y 和 z 是三维网格的坐标轴,使用 seq() 函数生成从 -10 到 10 的数据
- expand.grid() 函数生成所有可能的 (x, y, z) 组合
2. 计算热力图值:
- data$values 是我们用来表示热力图强度的数据,这里使用一个简单的 sin(sqrt(x^2 + y^2 + z^2)) 函数计算值,可以根据需要替换为实际数据或其他函数
3. 绘制 3D 热力图:
- plot_ly() 函数创建图形对象,type = ‘mesh3d’ 指定绘制 3D 网格图,intensity 参数设置为热力图的值
- colorRamp() 函数定义颜色渐变,展示不同强度的区域
4. 设置布局:
- layout() 函数用于设置坐标轴标题和颜色条
效果
雷达图
示例
library(plotly)
library(dplyr)

# 生成示例数据
data <- data.frame(
  axis = c("A", "B", "C", "D", "E"),
  value = c(3, 4, 2, 5, 4)
)

# 转换数据为适合绘图的格式
n <- nrow(data)
theta <- seq(0, 2 * pi, length.out = n + 1)
r <- c(data$value, data$value[1])
x <- r * cos(theta)
y <- r * sin(theta)

# 创建3D雷达图
plot_ly(
  x = ~x,
  y = ~y,
  z = ~rep(0, length(x)),
  type = 'scatter3d',
  mode = 'lines+markers',
  line = list(color = 'blue'),
  marker = list(size = 5, color = 'blue')
) %>%
  layout(
    scene = list(
      xaxis = list(title = 'X'),
      yaxis = list(title = 'Y'),
      zaxis = list(title = 'Z', visible = FALSE)
    ),
    title = '3D Radar Plot'
  )
效果
韦恩图
示例
# 加载必要的包
library(plotly)

# 定义 3D 圆的参数
circle_radius <- 1
n_points <- 100
theta <- seq(0, 2 * pi, length.out = n_points)

# 计算圆的 x 和 y 坐标
circle_x <- circle_radius * cos(theta)
circle_y <- circle_radius * sin(theta)

# 生成 3 个圆的坐标
circle1 <- data.frame(x = circle_x, y = circle_y, z = 0)
circle2 <- data.frame(x = circle_x - 0.5, y = circle_y - 0.5, z = 0)
circle3 <- data.frame(x = circle_x + 0.5, y = circle_y - 0.5, z = 0)

# 创建一个 3D 图形
fig <- plot_ly() %>%
  # 添加圆1
  add_trace(
    x = circle1$x,
    y = circle1$y,
    z = circle1$z,
    type = 'scatter3d',
    mode = 'lines',
    line = list(width = 2, color = 'blue'),
    name = 'Circle 1'
  ) %>%
  # 添加圆2
  add_trace(
    x = circle2$x,
    y = circle2$y,
    z = circle2$z,
    type = 'scatter3d',
    mode = 'lines',
    line = list(width = 2, color = 'green'),
    name = 'Circle 2'
  ) %>%
  # 添加圆3
  add_trace(
    x = circle3$x,
    y = circle3$y,
    z = circle3$z,
    type = 'scatter3d',
    mode = 'lines',
    line = list(width = 2, color = 'red'),
    name = 'Circle 3'
  ) %>%
  layout(
    scene = list(
      xaxis = list(title = 'X Axis'),
      yaxis = list(title = 'Y Axis'),
      zaxis = list(title = 'Z Axis')
    ),
    title = '3D Venn Diagram'
  )

# 显示图形
fig
解析
1. 定义圆的参数:
- circle_radius 为圆的半径
- n_points 设置圆上点的数量以确保圆的平滑
2. 计算圆的坐标:
- 使用 cos 和 sin 函数计算圆的 x 和 y 坐标
- 创建三个不同位置的圆(通过调整 x 和 y 的位置)
3. 创建 3D 图形:
- 使用 plot_ly() 创建图形对象
- add_trace() 函数用于添加每个圆的坐标
- layout() 设置坐标轴标题和图形标题
效果
