系列第二篇,话不多说,直接进入正题
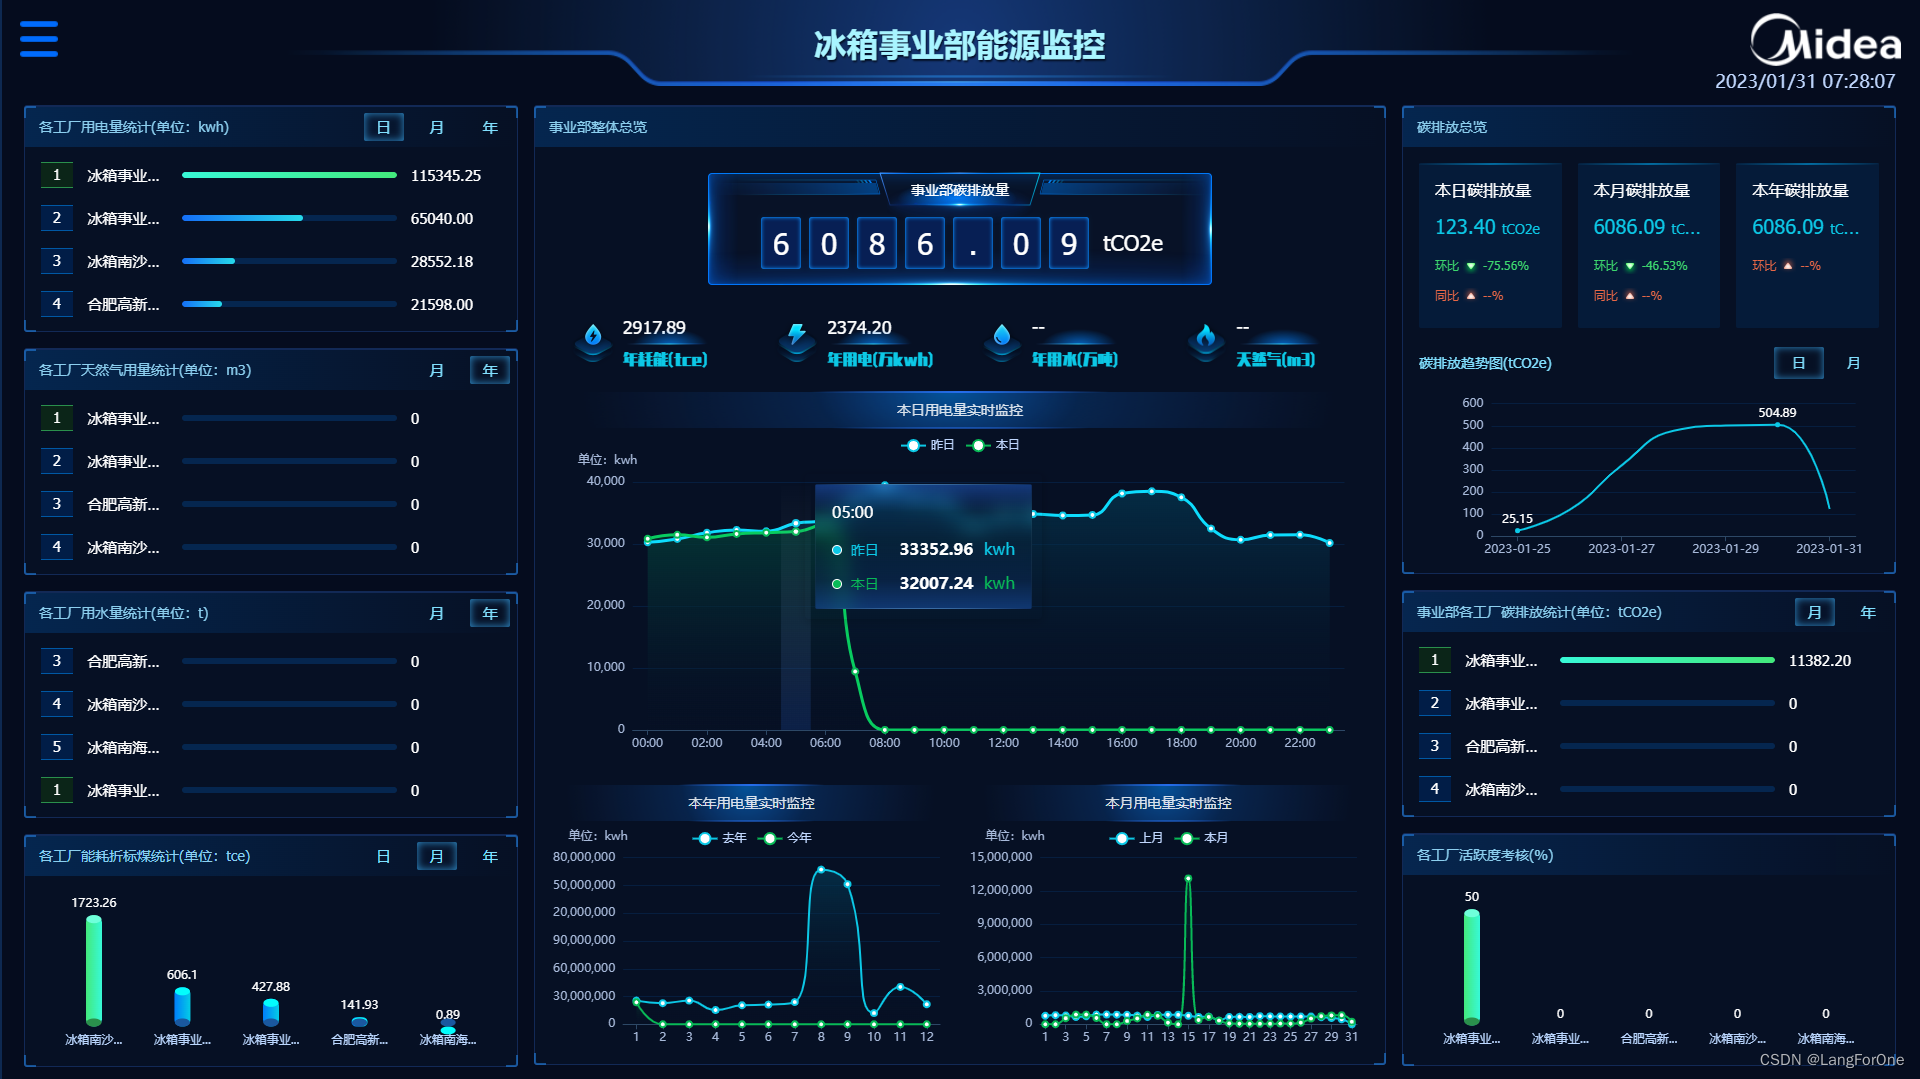
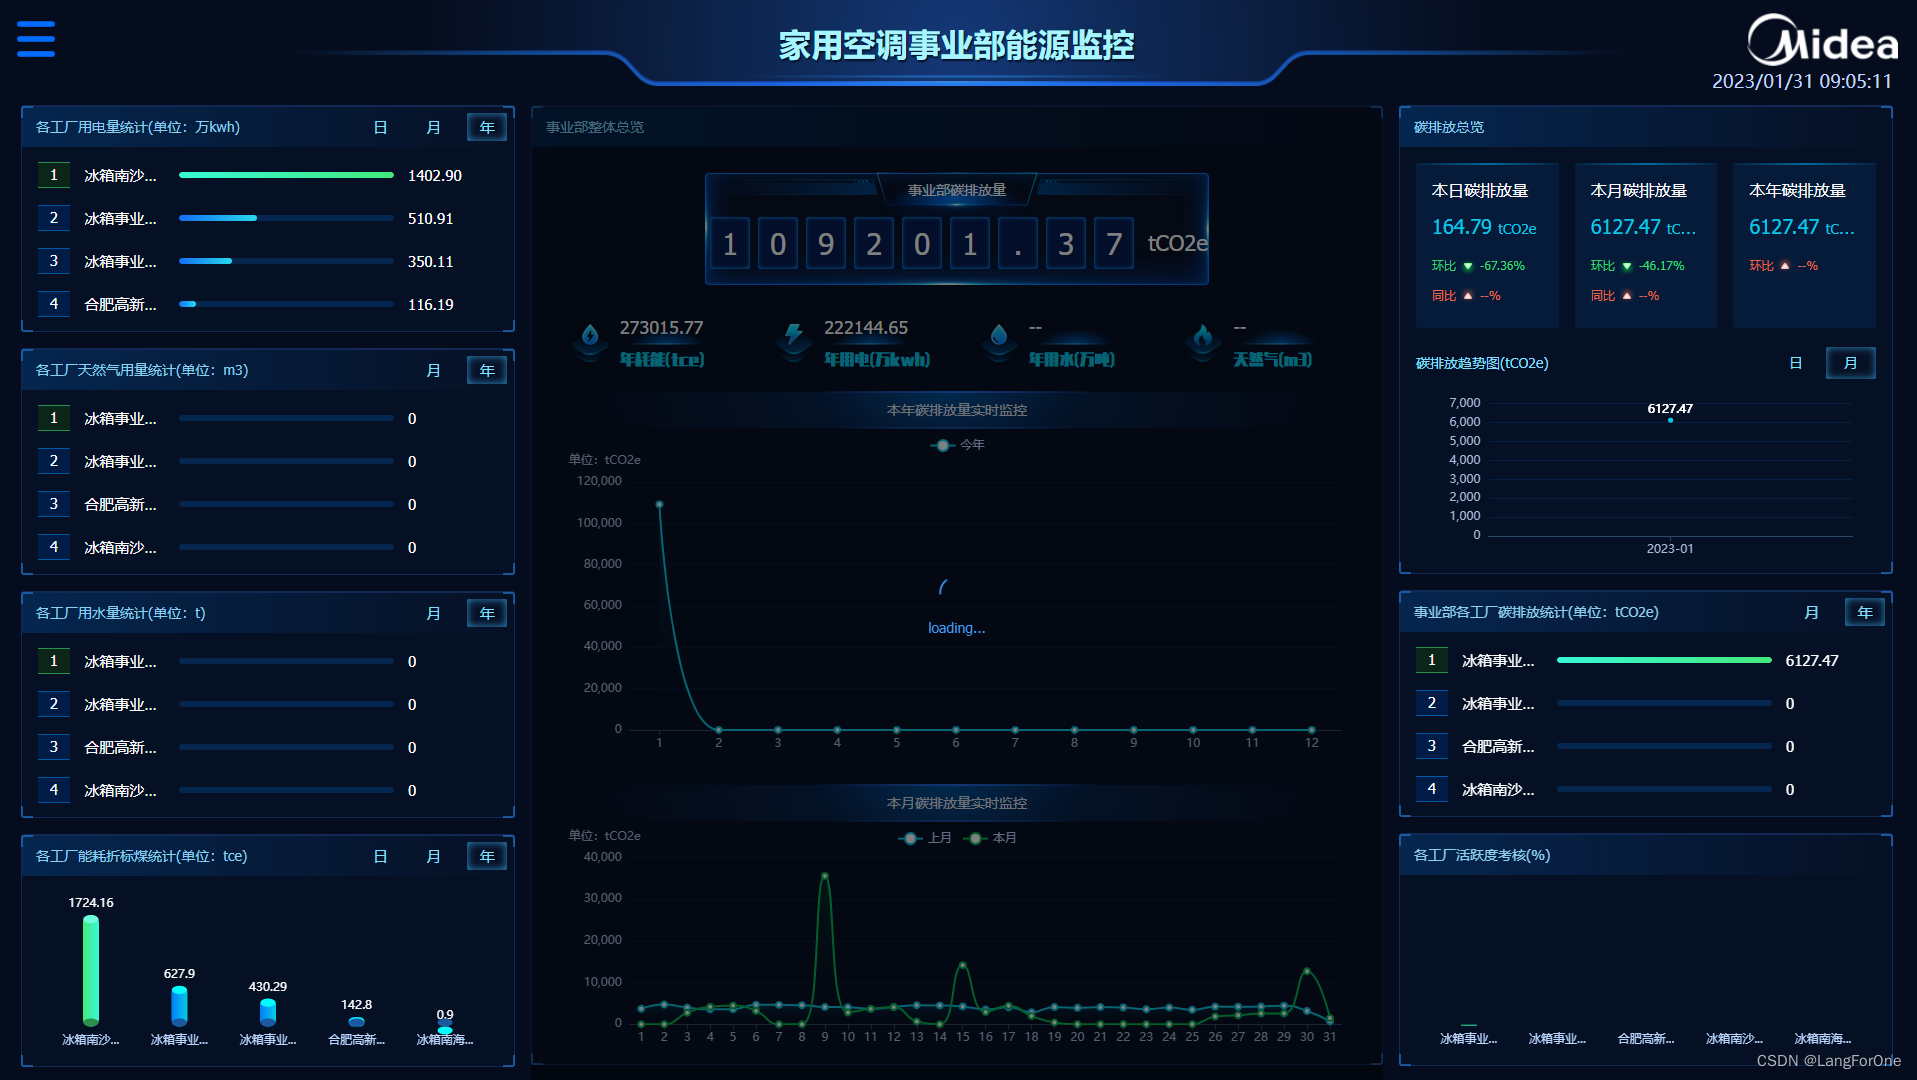
事业部能源监控看板展示视频
1、进度条组件
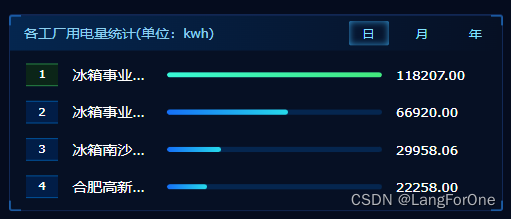
因为整个看板有四处地方用到,结合上一期提到的内容,我们优先考虑将这个模块做成组件
UED给的样式用echarts会很麻烦,我们优先考虑用element-UI的进度条组件el-progress结合v-for来做
进度条组件弄成渐变色样式的方法具体可以参考我的另一篇文章:element实现el-progress线形进度条渐变色
同一个组件最多展示四条数据,若需要罗列的超过四条,则每3秒循环滚动一次,实现方法:
  data() {
    return {
      progressTimer: null, // 循环滚动计时器

      //   sliceData: [
      //     {
      //       rank: 1,
      //       name: '顺德工厂-顺德顺德',
      //       value: 300000000,
      //       percent: 100,
      //       //   color: '#43E97B',
      //     },
      //     {
      //       rank: 2,
      //       name: '顺德工厂-顺德顺德',
      //       value: 300000000,
      //       percent: 80,
      //       //   color: '#26DAEA',
      //     },
      //     {
      //       rank: 3,
      //       name: '顺德工厂-顺德顺德',
      //       value: 300000000,
      //       percent: 50,
      //       //   color: '#26DAEA',
      //     },
      //     {
      //       rank: 4,
      //       name: '顺德工厂-顺德顺德',
      //       value: 300000000,
      //       percent: 30,
      //       //   color: '#26DAEA',
      //     },
      //   ],
      // 开发时,我们先写一些死数据供我们调试,后期再接入请求回来的接口数据
      sliceData: [], // 遍历的进度条列表
      scrollIndex: 0, // 当前滚动到第几条数据
    };
  },

  watch: {
    barData: {
      deep: true,
      //   immediate: true,
      handler: "progressScroll",  // 监听父页面传入的barData数据,当发生变化时重新从第一条开始滚动
    },
  },
  methods: {
    // 上下滚动
    progressScroll(isOut) {
      let self = this;
      if (this.progressTimer) {
        clearInterval(this.progressTimer); // 重新执行方法时清除计时器
      }
      if (isOut != 'mouseout') {
        this.scrollIndex = 0; // 为之后的鼠标移入移出功能准备,触发时若不是鼠标移出事件,则索引置0
      }
      let arrLength = this.barData.length;
      if (arrLength <= 4) {  // 数组小于4的滚动逻辑
        this.sliceData = this.barData;
      } else {
        if (this.scrollIndex >= arrLength - 1) {
          this.sliceData = [this.barData[arrLength - 1], this.barData[0], this.barData[1], this.barData[2]];
        } else if (this.scrollIndex == arrLength - 2) {
          this.sliceData = [this.barData[arrLength - 2], this.barData[arrLength - 1], this.barData[0], this.barData[1]];
        } else if (this.scrollIndex == arrLength - 3) {
          this.sliceData = [this.barData[arrLength - 3], this.barData[arrLength - 2], this.barData[arrLength - 1], this.barData[0]];
        } else {  // 数组大于4的滚动逻辑
          this.sliceData = this.barData.slice(this.scrollIndex, this.scrollIndex + 4);
        }
        this.progressTimer = setInterval(() => {
          if (self.scrollIndex >= arrLength - 1) {
            self.sliceData = [self.barData[arrLength - 1], self.barData[0], self.barData[1], self.barData[2]];
            self.scrollIndex = 0;
          } else if (self.scrollIndex == arrLength - 2) {
            self.sliceData = [self.barData[arrLength - 2], self.barData[arrLength - 1], self.barData[0], self.barData[1]];
            self.scrollIndex += 1;
          } else if (self.scrollIndex == arrLength - 3) {
            self.sliceData = [self.barData[arrLength - 3], self.barData[arrLength - 2], self.barData[arrLength - 1], self.barData[0]];
            self.scrollIndex += 1;
          } else {
            self.sliceData = self.barData.slice(self.scrollIndex, self.scrollIndex + 4);
            self.scrollIndex += 1;
          }
        }, 3000);
      }
    },
  }
为方便观察数据,用户希望在鼠标移入时暂停该部分的滚动,鼠标移出时继续滚动,则追加鼠标移入移出事件:
    // 鼠标移入
    handleOver() {
      if (this.barData.length >= 4 && this.progressTimer) {
        clearInterval(this.progressTimer);
      }
    },
    // 鼠标移出
    handleOut() {
      if (this.barData.length >= 4) {
        this.progressScroll('mouseout');
      }
    }
完整的组件代码:
<template>
  <div class="progress_bar" @mouseenter="handleOver" @mouseleave="handleOut">
    <div class="row" v-for="(item,index) in sliceData" :key="index">
      <div :class="`rank_num ${item.rank==1?'best':''}`">{{item.rank}}</div>
      <div class="org_name" :title="item.name">{{item.name}}</div>
      <div class="progress">
        <div class="progress_box">
          <el-progress :percentage="item.percent" v-if="!isNaN(parseInt(item.percent))" :class="item.rank==1?'green':'blue'" :show-text="false"></el-progress>
        </div>
      </div>
      <!-- <div class="energy_value" :title="'300000000kwh'">
        <div class="value">300000000</div>
        <div class="unit">kwh</div>
      </div>-->
      <div class="energy_value" :title="item.value + item.unit">{{item.value}}</div>
    </div>
  </div>
</template>
    <script>
export default {
  props: {
    barData: {
      type: Array,
      default: () => { return []; },
    },
  },
  data() {
    return {
      progressTimer: null,
      //   sliceData: [
      //     {
      //       rank: 1,
      //       name: '顺德工厂-顺德顺德',
      //       value: 300000000,
      //       percent: 100,
      //       //   color: '#43E97B',
      //     },
      //     {
      //       rank: 2,
      //       name: '顺德工厂-顺德顺德',
      //       value: 300000000,
      //       percent: 80,
      //       //   color: '#26DAEA',
      //     },
      //     {
      //       rank: 3,
      //       name: '顺德工厂-顺德顺德',
      //       value: 300000000,
      //       percent: 50,
      //       //   color: '#26DAEA',
      //     },
      //     {
      //       rank: 4,
      //       name: '顺德工厂-顺德顺德',
      //       value: 300000000,
      //       percent: 30,
      //       //   color: '#26DAEA',
      //     },
      //   ],
      sliceData: [],
      scrollIndex: 0,
    };
  },
  computed: {

  },
  watch: {
    barData: {
      deep: true,
      //   immediate: true,
      handler: "progressScroll",
    },
  },
  methods: {
    // 上下滚动
    progressScroll(isOut) {
      let self = this;
      if (this.progressTimer) {
        clearInterval(this.progressTimer);
      }
      if (isOut != 'mouseout') {
        this.scrollIndex = 0;
      }
      let arrLength = this.barData.length;
      if (arrLength <= 4) {
        this.sliceData = this.barData;
      } else {
        if (this.scrollIndex >= arrLength - 1) {
          this.sliceData = [this.barData[arrLength - 1], this.barData[0], this.barData[1], this.barData[2]];
        } else if (this.scrollIndex == arrLength - 2) {
          this.sliceData = [this.barData[arrLength - 2], this.barData[arrLength - 1], this.barData[0], this.barData[1]];
        } else if (this.scrollIndex == arrLength - 3) {
          this.sliceData = [this.barData[arrLength - 3], this.barData[arrLength - 2], this.barData[arrLength - 1], this.barData[0]];
        } else {
          this.sliceData = this.barData.slice(this.scrollIndex, this.scrollIndex + 4);
        }
        this.progressTimer = setInterval(() => {
          if (self.scrollIndex >= arrLength - 1) {
            self.sliceData = [self.barData[arrLength - 1], self.barData[0], self.barData[1], self.barData[2]];
            self.scrollIndex = 0;
          } else if (self.scrollIndex == arrLength - 2) {
            self.sliceData = [self.barData[arrLength - 2], self.barData[arrLength - 1], self.barData[0], self.barData[1]];
            self.scrollIndex += 1;
          } else if (self.scrollIndex == arrLength - 3) {
            self.sliceData = [self.barData[arrLength - 3], self.barData[arrLength - 2], self.barData[arrLength - 1], self.barData[0]];
            self.scrollIndex += 1;
          } else {
            self.sliceData = self.barData.slice(self.scrollIndex, self.scrollIndex + 4);
            self.scrollIndex += 1;
          }
        }, 3000);
      }
    },
    // 鼠标移入
    handleOver() {
      if (this.barData.length >= 4 && this.progressTimer) {
        clearInterval(this.progressTimer);
      }
    },
    // 鼠标移出
    handleOut() {
      if (this.barData.length >= 4) {
        this.progressScroll('mouseout');
      }
    }
  },
  mounted() {
    this.progressScroll();
  },
  beforeDestroy() {
    clearInterval(this.progressTimer);
  },
};
</script>
<style lang="less">
.el-progress-bar__outer {
  background-color: rgba(0, 126, 250, 0.2) !important;
}
.progress_bar {
  height: 100%;
  //   display: flex;
  //   flex-direction: column;
  //   justify-content: space-around;
  padding: 13px 16px 0;
  .row {
    height: 30px;
    margin-bottom: 13px;
    display: flex;
    justify-content: space-between;
    align-items: center;
    .rank_num {
      width: 32px;
      height: 26px;
      line-height: 23px;
      text-align: center;
      background: #011d47;
      border-top: 1px #0058a4 solid;
      border-bottom: 1px #0058a4 solid;
    }
    .best {
      background: #0b2518;
      border-top: 1px #2a904c solid;
      border-bottom: 1px #2a904c solid;
    }
    .org_name {
      height: 30px;
      width: 80px;
      line-height: 30px;
      font-size: 15px;
      text-align: center;
      overflow: hidden;
      white-space: nowrap;
      text-overflow: ellipsis;
    }
    .progress {
      width: 215px;
      display: flex;
      align-items: center;
      .progress_box {
        width: 100%;
        .green {
          .el-progress-bar__inner {
            background-color: unset;
            background-image: linear-gradient(90deg, #38f9d7 0%, #43e97b 100%);
          }
        }
        .blue {
          .el-progress-bar__inner {
            background-color: unset;
            background-image: linear-gradient(270deg, #26daea 0%, #156ff7 100%);
          }
        }
      }
    }

    .energy_value {
      width: 90px;
      height: 30px;
      font-size: 15px;
      overflow: hidden;
      white-space: nowrap;
      text-overflow: ellipsis;
      line-height: 30px;
      //   display: flex;
      //   align-items: center;
      //   .value {
      //     display: inline-block;
      //     width: 65px;
      //     overflow: hidden;
      //     white-space: nowrap;
      //     text-overflow: ellipsis;
      //   }
    }
  }
}
</style>
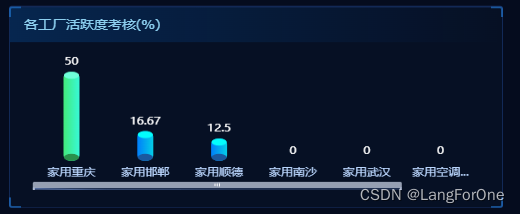
2、圆柱形柱状图
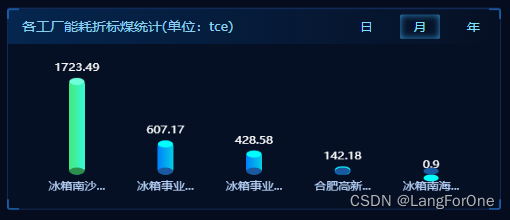
最多展示6项,超过6项时出现滚动条供左右滚动查看数据
说实话,这玩意数据很小的时候样式看起来是有点小bug的,我将就先用着了,如果你的项目很规范严谨的话需要自己想想怎么解决或者看看其他圆柱体怎么绘制。
    // 左侧下方折标煤统计
    coalPower(dimension) {
      if (this.coal_charts) { // 图表相关的都应该在绘制前先销毁前图表
        this.coal_charts.clear();
        this.coal_charts.dispose();
      }
      axios.getConvertElectricity({ dimension }).then((res) => {
        if (res.data && res.data.body && res.data.body.length) {
          let xdata = [];
          let ydata = [];
          res.data.body.forEach((item, index) => {
            xdata.push(item.orgName.length > 5 ? item.orgName.substring(0, 4) + '...' : item.orgName);
            // 每一项的名称超长时则省略展示,不然字体重叠了多不好看
            ydata.push(item.value ? Math.floor((item.value / 1000) * 100) / 100 : 0);
          });
          this.setBarCharts(xdata, ydata, 'coal_charts');
        }
      })
    },

    // 绘制圆柱图
    setBarCharts(xdata, ydata, ref) {
      let zoomShow = ydata.length > 6 ? true : false;
      let option = {
        grid: {
          top: '20%',
          right: '5%',
          bottom: ydata.length > 6 ? '20%' : '12%',
          left: '5%',
        },
        xAxis: {
          type: 'category',
          axisLine: {
            show: false
          },
          axisTick: {
            show: false
          },
          axisLabel: {
            color: '#BBD7FF',
          },
          data: xdata,
        },
        yAxis: {
          type: 'value',
          show: false,
        },
        dataZoom: [
        //滚动条,按要求最多展示6条数据,超过6条则给图表增加滚动条供用户左右拖动查看
          {
            show: zoomShow,
            type: 'slider',
            realtime: true,
            startValue: 0,
            endValue: 5,
            xAxisIndex: [0],
            bottom: '5',
            left: '20',
            height: 5,
            borderColor: 'rgba(0,0,0,0)',
            textStyle: {
              color: 'rgba(0,0,0,0)',
            },
          },
        ],
        series: [
          {
            data: ydata,
            type: 'bar',
            barWidth: 16,
            label: {
              show: true,
              position: 'top',
              color: '#fff',
              formatter: function (params) {
                return params.value;
              }
            },
            itemStyle: {
              barBorderRadius: 7,
              color: function (params) {
                if (params.dataIndex == 0) {
                  //右,下,左,上
                  return new echarts.graphic.LinearGradient(0, 0, 1, 0, [{
                    offset: 0, color: '#43E97B'
                  }, {
                    offset: 1, color: '#38F9D7'
                  }])
                } else {
                  return new echarts.graphic.LinearGradient(0, 0, 1, 0, [{
                    offset: 0, color: '#007EFA'
                  }, {
                    offset: 1, color: '#04CDE6'
                  }])
                }
              }
            }
          },
          {
            name: 'a',
            tooltip: {
              show: false
            },
            type: 'pictorialBar',
            itemStyle: {
              normal: {
                color: function (params) {
                  if (params.dataIndex == 0) {
                    return '#6FFFDA'
                  } else {
                    return '#03FDFD'
                  }
                }
              }
            },
            symbol: 'circle',
            symbolSize: ['15', '8'],
            symbolPosition: 'end', // 圆柱上面的小盖子
            data: ydata,
            z: 3
          },
          {
            name: 'a',
            tooltip: {
              show: false
            },
            type: 'pictorialBar',
            itemStyle: {
              normal: {
                color: function (params) {
                  if (params.dataIndex == 0) {
                    return '#2A904C'
                  } else {
                    return '#1A589F'
                  }
                }
              }
            },
            symbol: 'circle',
            symbolSize: ['15', '8'],
            symbolPosition: 'start', // 圆柱底
            data: ydata,
            z: 3
          }
        ]
      };
      if (this[ref]) {
        this[ref].clear();
        this[ref].dispose();
      }
      this[ref] = echarts.init(this.$refs[ref]);
      this[ref].setOption(option, true);
    },
3、渐变色折线图与渐变色tooltip
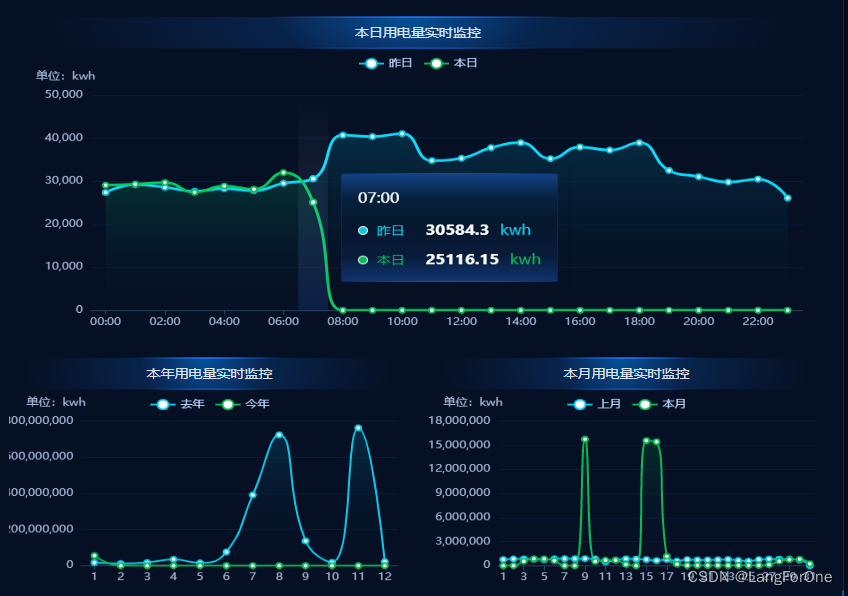
之前有专门写过两篇文章介绍这块,因为我觉得弄得还挺好看的(笑),就不多赘述了
传送门:echarts折线图与柱状图等绘成渐变色的方法
echarts中tooltip设为渐变色与模糊背景滤镜
4、一些简单的布局
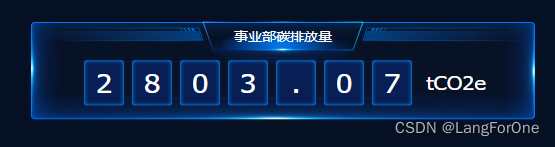
中间这个地方就是在computed里把拿到的碳排放量数据先转化成字符串,再切割后加工成一个字符数组。html里展示用v-for遍历,给每个字符加一个框框样式,再利用flex布局均匀分布就可以了。不管数据有几位数都是能居中对其的。
html:
<div class="main_carbon">
  <div class="carbon_btn" @click="handleTabs(4)">
    <div class="carbon_title">事业部碳排放量</div>
    <div class="carbon_value">
      <div class="carbon_num">
        <div class="number_box" v-for="(item,index) in carbonTotalArr" :key="index">{{item}}</div>
      </div>
      <div class="carbon_unit">tCO2e</div>
    </div>
  </div>
</div>
css:
                        .main_carbon {
                            height: 162px;
                            display: flex;
                            align-items: center;
                            justify-content: center;

                            .carbon_btn {
                                width: 504px;
                                height: 113px;
                                background-image: url(../../assets/businessMonitoring/main_board.png);
                                background-repeat: no-repeat;
                                background-size: 100% 100%;
                                cursor: pointer;

                                .carbon_title {
                                    margin: 10px 0 15px;
                                    text-align: center;
                                    font-size: 14px;
                                }

                                .carbon_value {
                                    display: flex;
                                    justify-content: center;
                                    align-items: center;

                                    .carbon_num {
                                        height: 60px;
                                        display: flex;
                                        justify-content: center;
                                        align-items: center;
                                        margin-right: 10px;

                                        .number_box {
                                            width: 48px;
                                            height: 60px;
                                            line-height: 60px;
                                            text-align: center;
                                            font-size: 30px;
                                            font-weight: 500;
                                            background-image: url(../../assets/businessMonitoring/value_border.png);
                                            background-repeat: no-repeat;
                                            background-size: 100% 100%;
                                        }
                                    }

                                    .carbon_unit {
                                        font-size: 22px
                                    }
                                }
                            }
                        }
js:
  computed: {
    carbonTotalArr() {
      let arr = this.tabs_list[4].value == '--' ? '--' : (Math.floor((this.tabs_list[4].value / 1000) * 100) / 100).toString().split('');
      return arr;
    },
  },
5、循环轮播并可点击切换的导航按钮
算是一个初稿做出来后续被砍掉的方案,个人挺喜欢的,就也一起放出来吧
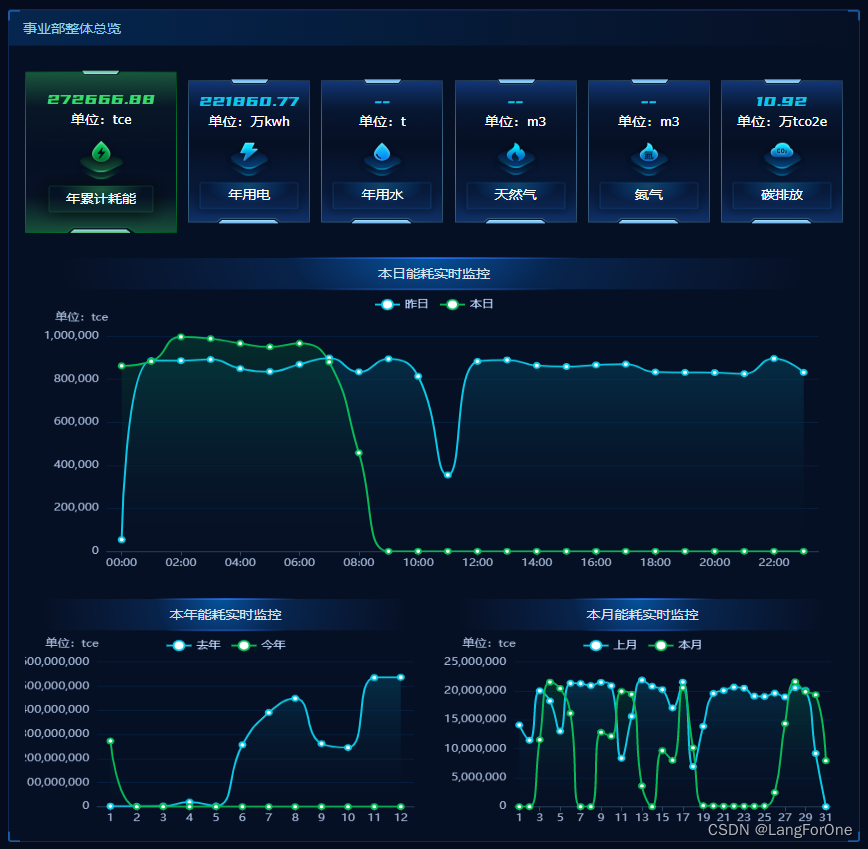
动态图浏览:

依旧采用flex布局,给当前正在激活的按钮增加类名active,供样式的变化,激活的框框长宽变化后会自动挤开一点位置而不会影响整体居中,这就是flex给我带来的自信,并配合transition过渡动画效果使得变化更平滑。
html:
                <div class="energy_tabs">
                  <div
                    v-for="(item,index) in tabs_list"
                    :key="index"
                    :class="`tab_btn ${item.isActive?'active':''}`"
                    :style="{backgroundImage:`url(${item.isActive?item.acImg:item.img})`}"
                    @click="handleTabs(index)"
                  >
                    <div class="value" :title="item.value">{{item.value}}</div>
                    <div class="unit">单位:{{item.unit}}</div>
                    <div class="name">{{item.name}}</div>
                  </div>
                </div>
css:
                        .tab_btn {
                            width: 122px;
                            height: 166px;
                            background-repeat: no-repeat;
                            background-size: 100% 100%;
                            transition: width 0.2s;
                            transition: height 0.2s;
                            cursor: pointer;
                            text-align: center;

                            .value {
                                font-family: 'YouSheBiaoTiHei', sans-serif;
                                color: #0cc8e6;
                                font-size: 18px;
                                margin-top: 16px;
                                padding: 0 5px;
                                white-space: nowrap;
                                text-overflow: ellipsis;
                                overflow: hidden;
                            }

                            .unit {
                                font-size: 14px;
                                margin-top: 4px;
                                margin-bottom: 68px;
                            }

                            .name {
                                font-size: 14px;
                            }
                        }

                        .active {
                            width: 152px;
                            height: 187px;

                            .value {
                                color: #3cd76e;
                                margin-top: 24px;
                            }

                            .unit {
                                margin-bottom: 76px;
                            }
                        }
js:
    // 点击tabs
    handleTabs(i) {
      this.tabs_list.forEach((item, index) => {
        item.isActive = i == index ? true : false;
      });
      this.chartUnit = this.tabs_list[i].chartUnit;
      this.chartTitle = this.tabs_list[i].title;
      this.tabChoose = i;
      this.getElectricLine(this.tabs_list[i].prop); // 切换按钮后重新绘制下面的图表
      this.tabScroll();
    },

	// 中间tabs轮播,具体实现与最开始的进度条组件类似
    tabScroll() {
      if (this.tabTimer) {
        clearInterval(this.tabTimer);
      }
      let self = this;
      this.tabTimer = setInterval(() => {
        if (self.tabChoose < self.tabs_list.length - 1) {
          self.tabChoose += 1;
        } else {
          self.tabChoose = 0;
        }
        this.chartUnit = this.tabs_list[self.tabChoose].chartUnit;
        this.chartTitle = this.tabs_list[self.tabChoose].title;
        self.tabs_list.forEach((item, index) => {
          item.isActive = index == self.tabChoose ? true : false;
        })
        this.getElectricLine(self.tabs_list[self.tabChoose].prop);
      }, 10 * 1000);
    },
系列第二期也圆满完工了,奈斯
(看板每五分钟重新加载一次数据)
完整代码:
<template>
<Home :isFullScreen="true">
<div class="kanban_business_monitoring">
<div class="kanban__body">
<!-- 左侧 -->
<div class="body_left">
<div class="total_progress">
<plate :title="`各工厂用电量统计(单位:${electricTotal[0].unit||'kwh'})`">
<div class="content">
<progressBar :barData="electricTotal"></progressBar>
<div class="dimension_box">
<div :class="`btn ${electricDimension == 'DAY'?'active':''}`" @click="chageDimension('DAY','electric')">日</div>
<div :class="`btn ${electricDimension == 'MONTH'?'active':''}`" @click="chageDimension('MONTH','electric')">月</div>
<div :class="`btn ${electricDimension == 'YEAR'?'active':''}`" @click="chageDimension('YEAR','electric')">年</div>
</div>
</div>
</plate>
</div>
<div class="total_progress">
<plate :title="'各工厂天然气用量统计(单位:m3)'">
<div class="content">
<progressBar :barData="gasTotal"></progressBar>
<div class="dimension_box">
<!-- <div :class="`btn ${gasDimension == 'DAY'?'active':''}`" @click="chageDimension('DAY','gas')">日</div> -->
<div class="btn"></div>
<div :class="`btn ${gasDimension == 'MONTH'?'active':''}`" @click="chageDimension('MONTH','gas')">月</div>
<div :class="`btn ${gasDimension == 'YEAR'?'active':''}`" @click="chageDimension('YEAR','gas')">年</div>
</div>
</div>
</plate>
</div>
<div class="total_progress">
<plate :title="'各工厂用水量统计(单位:t)'">
<div class="content">
<progressBar :barData="waterTotal"></progressBar>
<div class="dimension_box">
<!-- <div :class="`btn ${waterDimension == 'DAY'?'active':''}`" @click="chageDimension('DAY','water')">日</div> -->
<div class="btn"></div>
<div :class="`btn ${waterDimension == 'MONTH'?'active':''}`" @click="chageDimension('MONTH','water')">月</div>
<div :class="`btn ${waterDimension == 'YEAR'?'active':''}`" @click="chageDimension('YEAR','water')">年</div>
</div>
</div>
</plate>
</div>
<div class="total_bar">
<plate :title="'各工厂能耗折标煤统计(单位:tce)'">
<div class="content">
<div class="coal_charts" ref="coal_charts"></div>
<div class="dimension_box">
<div :class="`btn ${coalDimension == 'DAY'?'active':''}`" @click="chageDimension('DAY','coal')">日</div>
<div :class="`btn ${coalDimension == 'MONTH'?'active':''}`" @click="chageDimension('MONTH','coal')">月</div>
<div :class="`btn ${coalDimension == 'YEAR'?'active':''}`" @click="chageDimension('YEAR','coal')">年</div>
</div>
</div>
</plate>
</div>
</div>
<!-- 中间 -->
<div class="body_center" v-loading="loading" element-loading-text="loading..." element-loading-background="rgba(0, 0, 0, 0.5)">
<div class="center_box">
<plate :title="'事业部整体总览'">
<div class="content">
<div class="energy_tabs_new">
<div class="main_carbon">
<div class="carbon_btn" @click="handleTabs(4)">
<div class="carbon_title">事业部碳排放量</div>
<div class="carbon_value">
<div class="carbon_num">
<div class="number_box" v-for="(item,index) in carbonTotalArr" :key="index">{{item}}</div>
</div>
<div class="carbon_unit">tCO2e</div>
</div>
</div>
</div>
<div class="main_other">
<div class="other_btn" v-for="(item,index) in tabs_list.slice(0,-1)" :key="index" @click="handleTabs(index)">
<img :src="item.img" />
<div class="btn_content">
<div class="value">{{item.value}}</div>
<div class="hikari"></div>
<div class="name">{{item.name}}({{item.unit}})</div>
</div>
</div>
</div>
</div>
<div class="day_line">
<panel :title="`${tabChoose == 4 ? '本年' : '本日'}${chartTitle}实时监控`"></panel>
<div class="day_charts" ref="day_charts"></div>
</div>
<div class="month_year">
<div class="line" v-if="(tabChoose !== 4)">
<panel :title="`本年${chartTitle}实时监控`"></panel>
<div class="year_charts" ref="year_charts"></div>
</div>
<div class="line" :style="`width:${tabChoose == 4?'100%':'49%'}`">
<panel :title="`本月${chartTitle}实时监控`"></panel>
<div class="month_charts" ref="month_charts"></div>
</div>
</div>
</div>
</plate>
</div>
</div>
<!-- 右侧 -->
<div class="body_right">
<carbonTotal ref="carbonTotal"></carbonTotal>
<div class="total_progress">
<plate :title="'事业部各工厂碳排放统计(单位:tCO2e)'">
<div class="content">
<progressBar :barData="carbonTotalTotal"></progressBar>
<div class="dimension_box">
<!-- <div :class="`btn ${carbonTotalDimension == 'DAY'?'active':''}`" @click="chageDimension('DAY','carbonTotal')">日</div> -->
<div class="btn"></div>
<div :class="`btn ${carbonTotalDimension == 'MONTH'?'active':''}`" @click="chageDimension('MONTH','carbonTotal')">月</div>
<div :class="`btn ${carbonTotalDimension == 'YEAR'?'active':''}`" @click="chageDimension('YEAR','carbonTotal')">年</div>
</div>
</div>
</plate>
</div>
<div class="total_bar">
<plate :title="'各工厂活跃度考核(%)'">
<div class="content">
<div class="activity_charts" ref="activity_charts"></div>
</div>
</plate>
</div>
</div>
</div>
</div>
</Home>
</template>
<script>
import ResizeObserver from "resize-observer-polyfill";
import * as echarts from "echarts";
import 'echarts-gl';
import axios from "../../api/index";
import panel from './components/panel';
import progressBar from './components/progress_bar';
import carbonTotal from './components/carbon_total';
import "moment/locale/zh-cn";
export default {
name: "kanban_business_monitoring",
components: {
panel,
progressBar,
carbonTotal
},
data() {
return {
loading: false,
searchTime: null,
buName: '', // 事业部名称
// 左侧
electricTotal: [
{
rank: 1,
name: '无工厂数据',
value: 0,
percent: 0,
unit: 'kwh',
}
], // 左侧工厂电能耗排名
gasTotal: [], // 左侧工厂气能耗排名
waterTotal: [], // 左侧工厂水能耗排名
carbonTotalTotal: [], // 右侧下方工厂碳排放统计排名
electricDimension: 'YEAR',
waterDimension: 'YEAR',
gasDimension: 'YEAR',
coalDimension: 'YEAR',
carbonTotalDimension: 'YEAR',
coal_charts: null,
// 中间
tabs_list: [{
prop: 'accumulated',
name: '年耗能',
value: '--',
unit: 'tce',
chartUnit: 'tce',
title: '能耗',
img: require('./../../assets/businessMonitoring/accumulated_btn.png'),
}, {
prop: 'electricity',
name: '年用电',
value: '--',
unit: '万kwh',
chartUnit: 'kwh',
title: '用电量',
img: require('./../../assets/businessMonitoring/elec_btn.png'),
}, {
prop: 'water',
name: '年用水',
value: '--',
unit: '万吨',
chartUnit: 't',
title: '用水量',
img: require('./../../assets/businessMonitoring/water_btn.png'),
}, {
prop: 'natGas',
name: '天然气',
value: '--',
unit: 'm3',
chartUnit: 'm3',
title: '天然气用量',
img: require('./../../assets/businessMonitoring/gas_btn.png'),
},
{
prop: 'carbon',
name: '事业部碳排放量',
value: '--',
unit: '万tco2e',
chartUnit: 'tCO2e',
title: '碳排放量',
},],
tabChoose: 4,
day_charts: null,
month_charts: null,
year_charts: null,
chartUnit: '万吨',
chartTitle: '碳排放量',
// 右侧
activity_charts: null,
dictionaryData: {}
};
},
computed: {
carbonTotalArr() {
let arr = this.tabs_list[4].value == '--' ? '--' : (Math.floor((this.tabs_list[4].value / 1000) * 100) / 100).toString().split('');
return arr;
},
},
methods: {
// 每5分钟自动更新
searchAuto() {
clearTimeout(this.searchTime);
this.loading = false;
this.search();
let self = this;
this.searchTime = setTimeout(function () {
self.searchAuto();
}, 1000 * 60 * 5);
},
search() {
this.getOverviewOfDepartmental();
this.$refs.carbonTotal.getCarbonTotal();
['electric', 'gas', 'water', 'carbonTotal', 'coal'].forEach(type => {
this[`${type}Power`](this[`${type}Dimension`]); // 初始值都为day
})
this.getRankingActivity();
},
// 各统计模块切换维度
chageDimension(dimension, type) {
this[`${type}Dimension`] = dimension;
this[`${type}Power`](dimension);
},
// 左侧工厂电能耗排名
electricPower(dimension) {
axios.getPowerElectricity({ dimension }).then((res) => {
if (res.data && res.data.body && res.data.body.length) {
let arr = [];
let max = res.data.body[0].value;
res.data.body.forEach((item, index) => {
arr.push({
rank: index + 1,
name: item.orgName,
value: dimension == 'YEAR' ? (item.value / 10000).toFixed(2) : item.value.toFixed(2),
percent: item.value && max ? (item.value / max) * 100 : 0,
unit: dimension == 'YEAR' ? '万kwh' : 'kwh',
});
})
this.electricTotal = arr;
} else {
this.electricTotal = [];
}
})
},
// 左侧工厂气能耗排名
gasPower(dimension) {
axios.getGasOrWaterElectricity({ dimension, energyType: 3 }).then((res) => {
if (res.data && res.data.body && res.data.body.length) {
let arr = [];
let max = res.data.body[0].value;
res.data.body.forEach((item, index) => {
if (item.orgId != 37) {
let obj = {
rank: index + 1,
name: item.orgName,
value: item.value ? item.value.toFixed(2) : 0,
percent: item.value && max ? (item.value / max) * 100 : 0,
unit: 'm3',
}
if (this.dictionaryData['d_' + item.orgId + '_' + dimension.toLowerCase() + 'gas']) {
obj.value = this.dictionaryData['d_' + item.orgId + '_' + dimension.toLowerCase() + 'gas']
// obj.percent = obj.value && this.dictionaryData.d_6_yeargas ? (obj.value / (this.dictionaryData.yeargas - 0)) * 100 : 0;
}
arr.push(obj);
}
})
this.gasTotal = arr;
} else {
this.gasTotal = [];
}
})
},
// 左侧工厂水能耗排名
waterPower(dimension) {
axios.getGasOrWaterElectricity({ dimension, energyType: 2 }).then((res) => {
if (res.data && res.data.body && res.data.body.length) {
let arr = [];
let max = res.data.body[0].value;
let weiMax = 0
Object.keys(this.dictionaryData).forEach(it => {
if (it.includes(dimension.toLowerCase() + 'water') && weiMax < this.dictionaryData[it]) {
weiMax = this.dictionaryData[it]
}
})
// console.log(weiMax);
res.data.body.forEach((item, index) => {
let obj = {
rank: index + 1,
name: item.orgName,
value: item.value ? item.value.toFixed(2) : 0,
percent: item.value && max ? (item.value / max) * 100 : 0,
unit: 't',
}
if (this.dictionaryData['d_' + item.orgId + '_' + dimension.toLowerCase() + 'water']) {
obj.value = this.dictionaryData['d_' + item.orgId + '_' + dimension.toLowerCase() + 'water'] - 0
obj.percent = obj.value && weiMax ? (obj.value / weiMax) * 100 : 0;
}
arr.push(obj);
})
this.waterTotal = arr;
} else {
this.waterTotal = [];
}
})
},
// 左侧下方折标煤统计
coalPower(dimension) {
if (this.coal_charts) {
this.coal_charts.clear();
this.coal_charts.dispose();
}
// 取前六个工厂
axios.getConvertElectricity({ dimension }).then((res) => {
if (res.data && res.data.body && res.data.body.length) {
let xdata = [];
let ydata = [];
res.data.body.forEach((item, index) => {
xdata.push(item.orgName.length > 5 ? item.orgName.substring(0, 4) + '...' : item.orgName);
ydata.push(item.value ? Math.floor((item.value / 1000) * 100) / 100 : 0);
});
this.setBarCharts(xdata, ydata, 'coal_charts');
}
})
},
// 绘制柱状图
setBarCharts(xdata, ydata, ref) {
let zoomShow = ydata.length > 6 ? true : false;
let option = {
grid: {
top: '20%',
right: '5%',
bottom: ydata.length > 6 ? '20%' : '12%',
left: '5%',
},
xAxis: {
type: 'category',
axisLine: {
show: false
},
axisTick: {
show: false
},
axisLabel: {
color: '#BBD7FF',
},
data: xdata,
},
yAxis: {
type: 'value',
show: false,
},
dataZoom: [//滚动条
{
show: zoomShow,
type: 'slider',
realtime: true,
startValue: 0,
endValue: 5,
xAxisIndex: [0],
bottom: '5',
left: '20',
height: 5,
borderColor: 'rgba(0,0,0,0)',
textStyle: {
color: 'rgba(0,0,0,0)',
},
},
],
series: [
{
data: ydata,
type: 'bar',
barWidth: 16,
label: {
show: true,
position: 'top',
color: '#fff',
formatter: function (params) {
return params.value;
}
},
itemStyle: {
barBorderRadius: 7,
color: function (params) {
if (params.dataIndex == 0) {
//右,下,左,上
return new echarts.graphic.LinearGradient(0, 0, 1, 0, [{
offset: 0, color: '#43E97B'
}, {
offset: 1, color: '#38F9D7'
}])
} else {
return new echarts.graphic.LinearGradient(0, 0, 1, 0, [{
offset: 0, color: '#007EFA'
}, {
offset: 1, color: '#04CDE6'
}])
}
}
}
},
{
name: 'a',
tooltip: {
show: false
},
type: 'pictorialBar',
itemStyle: {
normal: {
color: function (params) {
if (params.dataIndex == 0) {
return '#6FFFDA'
} else {
return '#03FDFD'
}
}
}
},
symbol: 'circle',
symbolSize: ['15', '8'],
symbolPosition: 'end', // 圆柱上面的小盖子
data: ydata,
z: 3
},
{
name: 'a',
tooltip: {
show: false
},
type: 'pictorialBar',
itemStyle: {
normal: {
color: function (params) {
if (params.dataIndex == 0) {
return '#2A904C'
} else {
return '#1A589F'
}
}
}
},
symbol: 'circle',
symbolSize: ['15', '8'],
symbolPosition: 'start', // 圆柱底
data: ydata,
z: 3
}
]
};
if (this[ref]) {
this[ref].clear();
this[ref].dispose();
}
this[ref] = echarts.init(this.$refs[ref]);
this[ref].setOption(option, true);
},
// 右侧 获取部门下相关的碳排放统计排名
carbonTotalPower(dimension) {
axios.getRankingCarbonOfBusiness({ dimension }).then((res) => {
if (res.data && res.data.body && res.data.body.length) {
let arr = [];
let max = res.data.body[0].value;
res.data.body.forEach((item, index) => {
arr.push({
rank: index + 1,
name: item.orgName,
value: item.value ? (item.value / 1000).toFixed(2) : 0,
percent: item.value && max ? (item.value / max) * 100 : 0,
unit: 'tCO2e',
});
})
this.carbonTotalTotal = arr;
} else {
this.carbonTotalTotal = [];
}
})
},
// 右侧下方-各工厂活跃度考核
getRankingActivity() {
// 取前六个工厂
axios.getRankingActivity().then((res) => {
if (res.data && res.data.body && res.data.body.length) {
let xdata = [];
let ydata = [];
res.data.body.forEach((item, index) => {
xdata.push(item.orgName.length > 5 ? item.orgName.substring(0, 4) + '...' : item.orgName);
ydata.push(item.value ? Math.floor(item.value * 100) / 100 : 0);
});
this.setBarCharts(xdata, ydata, 'activity_charts');
}
})
},
// 中间整一块发电总览
getOverviewOfDepartmental() {
this.loading = true;
axios.getOverviewOfDepartmental().then((res) => {
if (res.data && res.data.body) {
this.buName = res.data.body.buName;
this.overviewData = res.data.body;
this.handleTabs(this.tabChoose);
this.$store.state.femsStore.kanban_name = this.buName + "能源监控";
this.tabs_list.forEach((item, index) => {
let value = res.data.body[item.prop] && res.data.body[item.prop].value ? res.data.body[item.prop].value : '--';
if (item.prop == 'accumulated') {
item.value = (value / 1000).toFixed(2);
} else if (item.prop == 'electricity') {
item.value = (value / 10000).toFixed(2);
} else if (item.prop == 'carbon') {
item.value = value;
} else {
item.value = value;
};
})
if (this.buName == '微波和清洁事业部') {
let watervalue = 0
let gasvalue = 0
Object.keys(this.dictionaryData).forEach(it => {
if (it.includes('water') && it.includes('year')) {
watervalue += this.dictionaryData[it] - 0
} if (it.includes('gas') && it.includes('year')) {
gasvalue += this.dictionaryData[it] - 0
}
})
this.tabs_list[2].value = (watervalue / 10000).toFixed(2)
this.tabs_list[3].value = gasvalue
}
this.loading = false;
} else {
this.$message({
message: "返回数据有误或为空。",
type: "error",
});
this.loading = false;
}
})
},
getDictionary() {//获取字典配置数值
let yearGasTotal = 0
let yearWaterTotal = 0
axios.searchDictionary({ dictionaryType: 'SHIYEBUKANBAN' }).then(res => {
res.forEach(item => {
this.dictionaryData['d_' + item.index] = item.value - 0
})
})
},
// 获取年月日电用能折线图数据
getElectricLine(prop) {
['day', 'year', 'month'].forEach(dimension => {
if (this[`${dimension}_charts`]) {
this[`${dimension}_charts`].clear();
this[`${dimension}_charts`].dispose();
}
})
if (this.overviewData[prop]) {
if (prop == 'carbon') {
// let ydataOfLastDay = this.overviewData[prop].ydataOfLastDay ? this.overviewData[prop].ydataOfLastDay.map(x => x == null ? null : Math.floor((x / 1000) * 100) / 100) : [];
// let ydataOfDay = this.overviewData[prop].ydataOfDay ? this.overviewData[prop].ydataOfDay.map(x => x == null ? null : Math.floor((x / 1000) * 100) / 100) : [];
let ydataOfLastYear = this.overviewData[prop].ydataOfLastYear ? this.overviewData[prop].ydataOfLastYear.map(x => x == null ? null : Math.floor((x / 1000) * 100) / 100) : [];
let ydataOfYear = this.overviewData[prop].ydataOfYear ? this.overviewData[prop].ydataOfYear.map(x => x == null ? null : Math.floor((x / 1000) * 100) / 100) : [];
let ydataOfLastMonth = this.overviewData[prop].ydataOfLastMonth ? this.overviewData[prop].ydataOfLastMonth.map(x => x == null ? null : Math.floor((x / 1000) * 100) / 100) : [];
let ydataOfMonth = this.overviewData[prop].ydataOfMonth ? this.overviewData[prop].ydataOfMonth.map(x => x == null ? null : Math.floor((x / 1000) * 100) / 100) : [];
setTimeout(() => {
// this.setElectricLine(this.overviewData.xDataOfDay || [], [ydataOfLastDay || [], ydataOfDay || [],], 'day_charts', ['昨日', '本日']);
this.setElectricLine(this.overviewData.xDataOfYear || [], [ydataOfYear || [],], 'day_charts', ['今年']);
this.setElectricLine(this.overviewData.xDataOfMonth || [], [ydataOfLastMonth || [], ydataOfMonth || [],], 'month_charts', ['上月', '本月']);
}, 50);
} else {
setTimeout(() => {
this.setElectricLine(this.overviewData.xDataOfDay || [], [this.overviewData[prop].ydataOfLastDay || [], this.overviewData[prop].ydataOfDay || [],], 'day_charts', ['昨日', '本日']);
this.setElectricLine(this.overviewData.xDataOfYear || [], [this.overviewData[prop].ydataOfLastYear || [], this.overviewData[prop].ydataOfYear || [],], 'year_charts', ['去年', '今年']);
this.setElectricLine(this.overviewData.xDataOfMonth || [], [this.overviewData[prop].ydataOfLastMonth || [], this.overviewData[prop].ydataOfMonth || [],], 'month_charts', ['上月', '本月']);
}, 50);
}
}
},
// 绘制电用能折线图
setElectricLine(xdata, ydata, ref, name) {
let unit = this.chartUnit;
let option = {
grid: {
top: '15%',
right: '3%',
bottom: '15%',
left: this.tabChoose !== 4 && ref !== 'day_charts' ? '18%' : '10%',
},
legend: {
textStyle: {
color: '#C0D7FE'
},
padding: [10, 0, 0, 0]
},
tooltip: {
trigger: 'axis',
axisPointer: {
type: 'shadow',
shadowStyle: {
color: new echarts.graphic.LinearGradient(
0, 0, 0, 1,
[
{ offset: 0, color: 'rgba(255, 255, 255, 0)' },
{ offset: 1, color: 'rgba(37, 107, 230, 0.18)' }
]
),
}
},
backgroundColor: 'rgba(50,50,50,0)',
borderWidth: 0,
formatter: function (params) {
let html = '';
if (params.length == 2) {
html += `<div style="color: #fff;font-size: 16px;height: 125px;padding: 16px;
background: linear-gradient(180deg, rgba(37,108,233,0.44) 0%, rgba(23,80,169,0.1) 22%, rgba(20,64,137,0) 46%, rgba(16,51,111,0.28) 77%, rgba(30,101,213,0.4) 100%);
border-radius: 2px;border: 1px solid;border-image: radial-gradient(circle, rgba(111, 185, 242, 0.86), rgba(0, 0, 0, 0.2)) 1 1;
backdrop-filter: blur(10px);">
<div>
<div style="margin-bottom: 16px">${params[0].name}${ref == 'year_charts' ? '月' : ref == 'month_charts' ? '日' : ''}</div>
<div style="margin-bottom: 12px;color: #0CC8E6;">
<span style="display:inline-block;margin-right:4px;border:1px solid #fff;border-radius:10px;width:10px;height:10px;background-color:#0CC8E6;"></span>
<span style="font-size: 14px;">${params[0].seriesName}</span>
<span style="margin-left: 16px;font-weight: bold;color: #fff;">${params[0].value}</span>
<span style="margin-left: 6px;">${unit}</span>
</div>
<div style="color: #08BA57;">
<span style="display:inline-block;margin-right:4px;border:1px solid #fff;border-radius:10px;width:10px;height:10px;background-color:#08BA57;"></span>
<span style="font-size: 14px;">${params[1].seriesName}</span>
<span style="margin-left: 16px;font-weight: bold;color: #fff;">${params[1].value}</span>
<span style="margin-left: 6px;">${unit}</span>
</div>
</div>
</div>`;
} else if (params.length == 1) {
html += `<div style="color: #fff;font-size: 16px;height: 125px;padding: 16px;
background: linear-gradient(180deg, rgba(37,108,233,0.44) 0%, rgba(23,80,169,0.1) 22%, rgba(20,64,137,0) 46%, rgba(16,51,111,0.28) 77%, rgba(30,101,213,0.4) 100%);
border-radius: 2px;border: 1px solid;border-image: radial-gradient(circle, rgba(111, 185, 242, 0.86), rgba(0, 0, 0, 0.2)) 1 1;
backdrop-filter: blur(10px);">
<div>
<div style="margin-bottom: 16px">${params[0].name}${ref == 'year_charts' ? '月' : ref == 'month_charts' ? '日' : ''}</div>
<div style="margin-bottom: 12px;color: #0CC8E6;">
<span style="display:inline-block;margin-right:4px;border:1px solid #fff;border-radius:10px;width:10px;height:10px;background-color:#0CC8E6;"></span>
<span style="font-size: 14px;">${params[0].seriesName}</span>
<span style="margin-left: 16px;color: #fff;">${params[0].value}</span>
<span style="margin-left: 6px;">${unit}</span>
</div>
</div>
</div>`;
}
return html
},
},
xAxis: {
type: 'category',
boundaryGap: ['2%', '2%'],
axisTick: {
alignWithLabel: true
},
axisLine: {
onZero: false,
lineStyle: { color: '#2D4866' }
},
axisLabel: {
color: '#A8BADA',
},
data: xdata
},
yAxis: {
type: 'value',
name: `单位:${this.chartUnit}`,
nameTextStyle: {
padding: [0, 0, 0, -50],
color: '#A8BADA',
},
axisLabel: {
color: '#A8BADA'
},
splitLine: {
lineStyle: { color: '#061e3f', type: 'solid' }
},
},
series: [
{
name: name[0],
data: ydata[0] || [],
type: 'line',
symbolSize: 6,
smooth: true,
itemStyle: {
normal: {
color: "#0CC8E6",
},
},
lineStyle: {
normal: {
width: 2,
color: '#0CC8E6'
},
},
areaStyle: {
normal: {
//右,下,左,上
color: new echarts.graphic.LinearGradient(0, 0, 0, 1, [
{
offset: 0,
color: '#043953'
},
{
offset: 1,
color: 'rgba(7, 17, 38, 0)'
}
])
}
},
},
{
name: name[1],
data: ydata[1] || [],
type: 'line',
symbolSize: 6,
smooth: true,
itemStyle: {
normal: {
color: "#08BA57",
},
},
lineStyle: {
normal: {
width: 2,
color: '#08BA57'
},
},
areaStyle: {
normal: {
//右,下,左,上
color: new echarts.graphic.LinearGradient(0, 0, 0, 1, [
{
offset: 0,
color: '#04392f'
},
{
offset: 1,
color: 'rgba(7, 17, 38, 0)'
}
])
}
},
}
]
};
if (this[ref]) {
this[ref].clear();
this[ref].dispose();
}
this[ref] = echarts.init(this.$refs[ref]);
this[ref].setOption(option, true);
},
// 点击tabs
handleTabs(index) {
let i = this.buName == '微波和清洁事业部' ? 4 : index
this.chartUnit = this.tabs_list[i].chartUnit;
this.chartTitle = this.tabs_list[i].title;
this.tabChoose = i;
this.getElectricLine(this.tabs_list[i].prop);
},
},
mounted() {
let self = this;
this.$handleSize();
this.getDictionary()
this.$store.state.femsStore.kanban_name = this.buName + "事业部能源监控";
this.$eventbus.$on("fems_up_orgid", () => {
this.$nextTick(() => {
self.searchAuto();
});
});
const viewElem = document.body;
const resizeObserver = new ResizeObserver(() => {
this.$handleSize();
});
resizeObserver.observe(viewElem);
},
beforeDestroy() {
this.$eventbus.$off("fems_up_orgid");
clearTimeout(this.searchTime);
},
};
</script>
<style lang="less">
@import './index.less';
</style>
全体样式index.less
.kanban_business_monitoring {
height: 1080px;
width: 1920px;
.newplate {
margin-bottom: 16px;
margin-top: 0;
.newplate_title {
height: 40px;
line-height: 40px;
font-size: 14px;
}
}
.plate {
margin-top: 0;
}
.kanban__body {
width: 100%;
height: 100%;
display: flex;
justify-content: space-between;
padding: 105px 24px 0;
.body_left {
width: 494px;
height: 100%;
}
.body_center {
width: 852px;
height: 100%;
.center_box {
.content {
height: 917px;
padding: 0 16px;
.energy_tabs {
height: 244px;
display: flex;
justify-content: space-between;
align-items: center;
.tab_btn {
width: 122px;
height: 166px;
background-repeat: no-repeat;
background-size: 100% 100%;
transition: width 0.2s;
transition: height 0.2s;
cursor: pointer;
text-align: center;
.value {
font-family: 'YouSheBiaoTiHei', sans-serif;
color: #0cc8e6;
font-size: 18px;
margin-top: 16px;
padding: 0 5px;
white-space: nowrap;
text-overflow: ellipsis;
overflow: hidden;
}
.unit {
font-size: 14px;
margin-top: 4px;
margin-bottom: 68px;
}
.name {
font-size: 14px;
}
}
.active {
width: 152px;
height: 187px;
.value {
color: #3cd76e;
margin-top: 24px;
}
.unit {
margin-bottom: 76px;
}
}
}
.energy_tabs_new {
height: 244px;
.main_carbon {
height: 162px;
display: flex;
align-items: center;
justify-content: center;
.carbon_btn {
width: 504px;
height: 113px;
background-image: url(../../assets/businessMonitoring/main_board.png);
background-repeat: no-repeat;
background-size: 100% 100%;
cursor: pointer;
.carbon_title {
margin: 10px 0 15px;
text-align: center;
font-size: 14px;
}
.carbon_value {
display: flex;
justify-content: center;
align-items: center;
.carbon_num {
height: 60px;
display: flex;
justify-content: center;
align-items: center;
margin-right: 10px;
.number_box {
width: 48px;
height: 60px;
line-height: 60px;
text-align: center;
font-size: 30px;
font-weight: 500;
background-image: url(../../assets/businessMonitoring/value_border.png);
background-repeat: no-repeat;
background-size: 100% 100%;
}
}
.carbon_unit {
font-size: 22px
}
}
}
}
.main_other {
display: flex;
justify-content: space-around;
.other_btn {
width: 193px;
height: 68px;
padding: 8px 11px;
display: flex;
cursor: pointer;
img {
width: 50px;
height: 52px;
margin-right: 5px;
}
.btn_content {
position: relative;
.value {
font-size: 18px;
}
.hikari {
position: absolute;
top: 11px;
width: 90px;
height: 17px;
background-image: url(../../assets/businessMonitoring/hikari.png);
background-repeat: no-repeat;
background-size: 100% 100%;
}
.name {
margin-top: 14px;
font-size: 15px;
color: #0CC8E6;
font-family: 'RuiZiZhenYan', sans-serif;
}
}
}
}
}
.day_line {
height: 393px;
width: 100%;
.day_charts {
height: 90%;
width: 100%;
}
}
.month_year {
height: 280px;
width: 100%;
display: flex;
justify-content: space-between;
.line {
width: 49%;
height: 100%;
.month_charts {
height: 85%;
width: 100%;
}
.year_charts {
height: 85%;
width: 100%;
}
}
}
}
}
}
.body_right {
width: 494px;
height: 100%;
.carbon_total {
.carbon_box {
height: 426px;
.carbon_state {
display: flex;
justify-content: space-between;
overflow: hidden;
box-sizing: border-box;
padding: 16px 16px 0 16px;
>div {
height: 165px;
width: 31%;
background-color: rgba(0, 126, 250, 0.1);
border-radius: 2px;
.border_top {
width: 100%;
height: 2px;
background: linear-gradient(349deg,
rgba(0, 126, 250, 0) 0%,
rgba(0, 171, 241, 0.55) 49%,
rgba(0, 195, 236, 0) 100%);
}
.carbon_content {
padding: 16px;
font-size: 16px;
white-space: nowrap;
text-overflow: ellipsis;
overflow: hidden;
.value {
color: #0cc8e6;
font-size: 20px;
margin: 16px 0 20px 0;
white-space: nowrap;
text-overflow: ellipsis;
overflow: hidden;
span {
font-size: 14px;
}
}
.radio {
font-size: 12px;
margin-bottom: 14px;
white-space: nowrap;
text-overflow: ellipsis;
overflow: hidden;
display: flex;
align-items: center;
img {
width: 16px;
height: 16px;
margin: 0 4px;
}
}
.increase {
color: #E76746;
}
.decrease {
color: #3cd76e;
}
}
}
}
.charts_box {
height: 50%;
margin-top: 24px;
.title_box {
height: 10%;
display: flex;
justify-content: space-between;
align-items: center;
color: #81e0ff;
font-size: 14px;
padding: 0 16px;
.btn_box {
display: flex;
.btn {
width: 50px;
height: 32px;
line-height: 32px;
margin-left: 5px;
text-align: center;
cursor: pointer;
}
.active {
box-shadow: inset 0px 0px 8px 0px #3191cf;
border-radius: 2px;
}
}
}
.line_charts {
height: 90%;
width: 100%;
}
}
}
}
}
.content {
position: relative;
.dimension_box {
position: absolute;
height: 40px;
width: 160px;
top: -40px;
right: 0px;
display: flex;
justify-content: space-around;
align-items: center;
.btn {
width: 40px;
height: 28px;
line-height: 28px;
text-align: center;
color: #81e0ff;
cursor: pointer;
}
.active {
box-shadow: inset 0px 0px 8px 0px #3191cf;
border-radius: 2px;
}
}
}
.total_progress {
.content {
height: 184px;
}
}
.total_bar {
.content {
height: 190px;
.coal_charts {
width: 100%;
height: 90%;
}
.activity_charts {
width: 100%;
height: 90%;
}
}
}
}
}
右上组件:
<template>
  <div class="carbon_total">
    <plate :title="'碳排放总览'">
      <div class="carbon_box">
        <div class="carbon_state">
          <div v-for="(item, index) in carbon_state" :key="index">
            <div class="border_top"></div>
            <div class="carbon_content">
              <div>{{ item.name }}</div>
              <div class="value" :title="item.value+item.unit">
                {{item.value}}
                <span>{{item.unit}}</span>
              </div>
              <div :class="`radio ${item.yoY < 0 ? 'decrease' : 'increase'}`">
                环比
                <!-- <i :class="`${item.yoY < 0?'el-icon-caret-bottom':'el-icon-caret-top'}`"></i> -->
                <img :src="item.yoY < 0 ? arrow_down:arrow_up" alt />
                {{item.yoY || '--'}}%
              </div>
              <div v-if="item.prop!='year'" :class="`radio ${item.moM < 0 ? 'decrease' : 'increase'}`">
                同比
                <!-- <i :class="`${item.moM < 0?'el-icon-caret-bottom':'el-icon-caret-top'}`"></i> -->
                <img :src="item.moM < 0 ? arrow_down : arrow_up" alt />
                {{item.moM || '--'}}%
              </div>
            </div>
          </div>
        </div>
        <div class="charts_box">
          <div class="title_box">
            <div class="text">碳排放趋势图(tCO2e)</div>
            <div class="btn_box">
              <div :class="`btn ${carbonDimension == 'day'?'active':''}`" @click="handleCarbonBtn('day')">日</div>
              <div :class="`btn ${carbonDimension == 'month'?'active':''}`" @click="handleCarbonBtn('month')">月</div>
            </div>
          </div>
          <div class="line_charts" ref="line_charts"></div>
        </div>
      </div>
    </plate>
  </div>
</template>
<script>
import * as echarts from "echarts";
import axios from "../../../api/index";
export default {
  props: {
  },
  data() {
    return {
      carbon_state: [{ prop: 'day', name: "本日碳排放量", value: '--', moM: '--', yoY: '--', unit: '吨' }, { prop: 'month', name: "本月碳排放量", value: '--', moM: '--', yoY: '--', unit: '吨' }, { prop: 'year', name: "本年碳排放量", value: '--', moM: '--', yoY: '--', unit: '吨' },],
      carbonDimension: 'month',
      arrow_up: require('./../../../assets/businessMonitoring/arrow_up.png'),
      arrow_down: require('./../../../assets/businessMonitoring/arrow_down.png'),

      dayData: {
        xdata: [],
        ydata: []
      },
      monthData: {
        xdata: [],
        ydata: []
      }
    };
  },
  computed: {

  },
  watch: {
    barData: {
      deep: true,
      //   immediate: true,
      handler: "progressScroll",
    },
  },
  methods: {
    // 碳排放总览切换维度
    handleCarbonBtn(dimension) {
      this.carbonDimension = dimension;
      this.getCarbonData(dimension);
    },
    // 获取折线图最大最小值
    getDataSymbol(arr) {
      let maxNum = Math.max(...arr);
      let minNum = Math.min(...arr);
      let [maxIndex, minIndex] = [arr.indexOf(maxNum), arr.indexOf(minNum)];
      let newArr = arr;
      newArr[maxIndex] = { value: arr[maxIndex], symbol: 'circle', symbolSize: 5 };
      if (maxIndex !== minIndex) {
        newArr[minIndex] = { value: arr[minIndex], symbol: 'circle', symbolSize: 5 };
      }
      return newArr;
    },
    // 获取碳排放总览趋势图数据
    getCarbonData(dimension) {
      if (this.line_charts) {
        this.line_charts.clear();
        this.line_charts.dispose();
      }
      this.setLineCharts(this[`${dimension}Data`], "line_charts");
    },
    // 获取碳排放总览排放量数据
    getCarbonTotal() {
      this.carbon_state = [
        {
          prop: 'day',
          name: "本日碳排放量",
          value: '--',
          moM: '--',
          yoY: '--',
          unit: '吨'
        },
        {
          prop: 'month',
          name: "本月碳排放量",
          value: '--',
          moM: '--',
          yoY: '--',
          unit: '吨'
        },
        {
          prop: 'year',
          name: "本年碳排放量",
          value: '--',
          moM: '--',
          yoY: '--',
          unit: '吨'
        },
      ],
        axios.getCarbonOfBusiness().then((res) => {
          if (res.data.body) {
            if (res.data.body.carbonOfDay) {
              this.carbon_state[0].value = res.data.body.carbonOfDay > 10000000 ? (res.data.body.carbonOfDay / 10000000).toFixed(2) : (res.data.body.carbonOfDay / 1000).toFixed(2);
            } else {
              this.carbon_state[0].value = '--';
            }
            this.carbon_state[0].unit = res.data.body.carbonOfDay > 10000000 ? '万tCO2e' : 'tCO2e';
            this.carbon_state[0].moM = res.data.body.momCarbonOfDay;
            this.carbon_state[0].yoY = res.data.body.yoyCarbonOfDay;
            if (res.data.body.carbonOfMonth) {
              this.carbon_state[1].value = res.data.body.carbonOfMonth > 10000000 ? (res.data.body.carbonOfMonth / 10000000).toFixed(2) : (res.data.body.carbonOfMonth / 1000).toFixed(2);
            } else {
              this.carbon_state[1].value = '--';
            }
            this.carbon_state[1].unit = res.data.body.carbonOfMonth > 10000000 ? '万tCO2e' : 'tCO2e';
            this.carbon_state[1].moM = res.data.body.momCarbonOfMonth;
            this.carbon_state[1].yoY = res.data.body.yoyCarbonOfMonth;
            if (res.data.body.carbonOfYear) {
              this.carbon_state[2].value = res.data.body.carbonOfYear > 10000000 ? (res.data.body.carbonOfYear / 10000000).toFixed(2) : (res.data.body.carbonOfYear / 1000).toFixed(2);
            } else {
              this.carbon_state[2].value = '--';
            }
            this.carbon_state[2].unit = res.data.body.carbonOfYear > 10000000 ? '万tCO2e' : 'tCO2e';
            this.carbon_state[2].moM = res.data.body.momCarbonOfYear;

            this.dayData = {
              xdata: res.data.body.xday,
              ydata: res.data.body.day.map(item => {
                return Math.floor((item / 1000) * 100) / 100;
              }),
            }
            this.monthData = {
              xdata: res.data.body.xyear,
              ydata: res.data.body.year.map(item => {
                return Math.floor((item / 1000) * 100) / 100;
              }),
            }
            this.getCarbonData(this.carbonDimension);
          }
        })
    },
    // 绘制碳排放总览趋势图
    setLineCharts(data, ref) {
      let option = {
        grid: {
          top: '16%',
          right: '8%',
          bottom: '15%',
          left: '18%',
        },
        tooltip: {
          trigger: 'axis',
          axisPointer: {
            type: 'line',
            label: {
              backgroundColor: '#6a7985'
            }
          },
          formatter: function (params) {
            return params[0].name + '<br>' + params[0].marker + '碳排放量:' + params[0].value + ' tCO2e';
          }
        },
        xAxis: {
          type: 'category',
          boundaryGap: ['2%', '2%'],
          axisTick: {
            alignWithLabel: true
          },
          axisLine: {
            onZero: false,
            lineStyle: { color: '#2D4866' }
          },
          axisLabel: {
            color: '#A8BADA',
          },
          data: data.xdata
        },
        yAxis: {
          axisLabel: {
            color: '#A8BADA'
          },
          splitLine: {
            lineStyle: { color: '#061e3f', type: 'solid' }
          },
          type: 'value'
        },
        series: [
          {
            symbol: 'none',
            data: this.getDataSymbol(data.ydata),
            // data: [820, 932, 901, 934, 1290, { value: 1330, symbol: 'circle', symbolSize: 5 }, 1320],
            markPoint: {
              symbolSize: 20,
              itemStyle: {
                normal: {
                  color: 'rgba(0,0,0,0)'
                }
              },
              label: {
                show: true,
                color: '#fff'
              },
              data: [
                { type: 'max', name: 'Max' },
                { type: 'min', name: 'Min' }
              ]
            },
            type: 'line',
            smooth: true,
            // showSymbol: false,
            itemStyle: {
              normal: {
                color: "#0CC8E6", //改变折线点的颜色
              },
            },
            lineStyle: {
              normal: {
                width: 2,
                color: '#0CC8E6'
              },
            },
          }
        ]
      };
      if (this[ref]) {
        this[ref].clear();
        this[ref].dispose();
      }
      this[ref] = echarts.init(this.$refs[ref]);
      this[ref].setOption(option, true);
    },
  },
  mounted() {

  },
  beforeDestroy() {

  },
};
</script>
<style lang="less">
</style>
下期完结篇,分享电子车间能源监控看板,敬请期待~