使用vue + canvas绘制仪表盘
效果图:
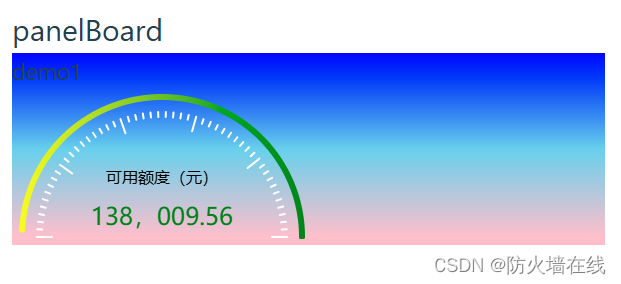
父容器
<template>
  <div class="panelBoard-page">
    <h1>panelBoard</h1>
    <Demo1 :rate="rate" />
  </div>
</template>
<script setup>
import { ref } from 'vue'
import Demo1 from './components/Demo1.vue'
const rate = ref(100)
</script>

<style lang="scss" scoped></style>
子容器中:
<template>
  <div class="demo1Container">
    <h2>demo1</h2>
    <div class="canvar-warp" ref="canvasWarp"></div>
  </div>
</template>

<script setup>
import { onMounted, ref } from 'vue'
const demo1 = ref(null)
const canvasWarp = ref(null)
const props = defineProps({
  rate: Number,
  default: 20
})
onMounted(async () => {
  const canvas = document.createElement('canvas')
  canvas.width = 300
  canvas.height = 150
  demo1.value = canvas
  canvasWarp.value.appendChild(canvas)
  // console.log(demo1.value.attributes, 'demo1')
  const ctx = demo1.value.getContext('2d')
  // let value = demo1.value.attributes['data-score'].value
  let value = props.rate
  const x0 = 150 // 圆心坐标
  const y0 = 148 // 圆心坐标
  const r1 = 140 // 半径
  const startAng = 180 // 起始角度
  const endAng = 0
  const numTicks = 51 // 刻度数量
  let blueAng = 180 + (value / 100) * 180
  ctx.beginPath()
  ctx.arc(x0, y0, r1, (Math.PI / 180) * 183, (Math.PI / 180) * blueAng, false)
  let linearGradient = ctx.createLinearGradient(0, 0, 300, 0)
  linearGradient.addColorStop(0, 'yellow')
  linearGradient.addColorStop(1, 'green')
  ctx.strokeStyle = linearGradient
  ctx.lineWidth = 6
  ctx.lineCap = 'round' // 线的末端设置
  ctx.stroke()
  // //添加刻度
  for (let i = 0; i <= numTicks; i++) {
    let angle = startAng + ((startAng - endAng) * i) / numTicks
    let innerRadius = r1 - 30 // 刻度内半径
    let outerRadius = r1 - 15 // 刻度外半径
    if ([0, 10, 20, 30, 40, 51].includes(i)) {
      innerRadius = r1 - 30 // 刻度内半径
      outerRadius = r1 - 15 // 刻度外半径
    } else {
      innerRadius = r1 - 20 // 刻度内半径
      outerRadius = r1 - 15 // 刻度外半径
    }
    let xInner = x0 + innerRadius * Math.cos((angle * Math.PI) / 180)
    let yInner = y0 + innerRadius * Math.sin((angle * Math.PI) / 180)
    let xOuter = x0 + outerRadius * Math.cos((angle * Math.PI) / 180)
    let yOuter = y0 + outerRadius * Math.sin((angle * Math.PI) / 180)

    ctx.beginPath()
    ctx.moveTo(xInner, yInner)
    ctx.lineTo(xOuter, yOuter)
    ctx.strokeStyle = '#fff'
    ctx.lineWidth = 2
    ctx.stroke()
  }
  // canvas中间的文字
  ctx.font = 'normal 16px PingFangSC-Medium' // 字体大小,样式
  ctx.fillStyle = '#000' // 颜色
  ctx.textAlign = 'center' // 位置
  ctx.textBaseline = 'middle' // 位置
  ctx.moveTo(50, 155) // 文字填充位置
  ctx.fillText('可用额度(元)', 150, 90)
  ctx.font = 'normal 24px PingFangSC-Regular' // 字体大小,样式
  ctx.fillStyle = 'green' // 颜色
  ctx.fillText('138,009.56', 150, 130)
})
</script>

<style lang="scss" scoped>
.demo1Container {
  width: 100%;
  background: linear-gradient(0deg, pink, skyblue, #00f);
}
</style>
