目录
- 1.Qt 配置qcustomplot
- 2.图像拖拽功能
- 3.图像框选放大
- 4.曲线自动缩放
- 5.图像游标
- 6.【完整代码】将曲线抽象成一个类,以便复用
1.Qt 配置qcustomplot
首先下载qcustomplot官网(qcustomplot下载地址)下载最近的源码,我用的是2.1.1版本。下载完成后解压,得到如下文件。

将.h和.cpp文件加入到工程中

如果使用的是Qt creator的话,在.pro文件中加入printsupport。

打开.ui文件,选中Widget模块拖入到界面当中

右键这个Widget,选择【提升为】
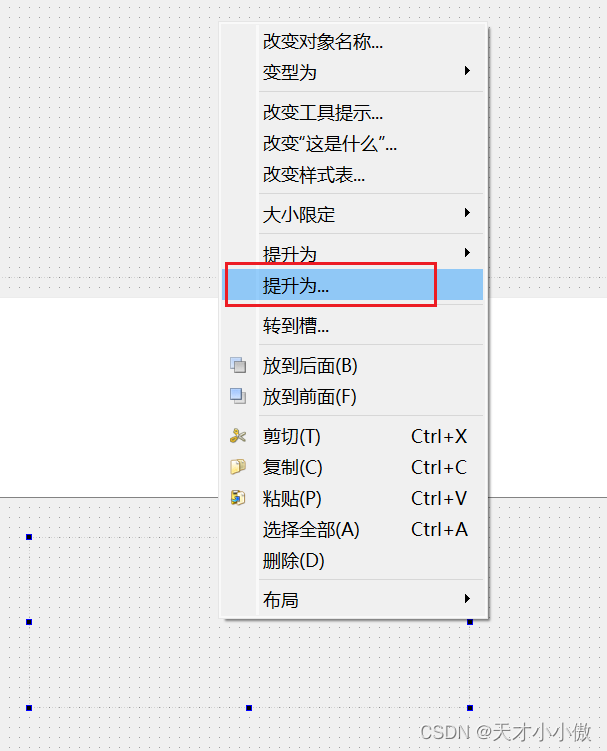
输入 QCustomPlot,点击添加、提升为

之后我们为这个控件改个名字就可以操作它啦。这里我给他重命名为widget_Force。
2.图像拖拽功能
首先在主线程中声明qcustomplot类,并实现一个对象。
    QTimer *plotTimer;//曲线刷新定时器
    /***************曲线绘制**********************/
    /*选中的曲线画笔*/
    QVector<QPen> selectedPen;
    /*选中的图例字体*/
    QFont YHfontBold;
    /*力曲线*/
    QCustomPlot *widget_Force;
    CurvePlot *curves_Force;
图像拖拽功能
		//禁用选择矩形
 		widget_Force->setSelectionRectMode(QCP::SelectionRectMode::srmNone);
 		//使能拖动
        widget_Force->setInteraction(QCP::iRangeDrag, true);
演示

3.图像框选放大
        widget_Force->setInteraction(QCP::iRangeDrag, false);//取消拖动
        widget_Force->setSelectionRectMode(QCP::SelectionRectMode::srmZoom);
演示

4.曲线自动缩放
右键曲线实现自动缩放功能需要添加一个右键菜单栏。
首先定义信号槽
    //右键菜单
    connect(widget_Force, &QCustomPlot::customContextMenuRequested, this, &MainWindow::contextMenuRequestForce);
槽函数如下
void MainWindow::contextMenuRequestForce(QPoint pos)
{
    QMenu *menu = new QMenu(this);
    menu->setStyleSheet("font:11pt;font-family:Microsoft YaHei");
    menu->setAttribute(Qt::WA_DeleteOnClose);
    menu->popup(widget_Force->mapToGlobal(pos));
    menu->addAction("调整范围", curves_Force, &CurvePlot::rescaleAxes);
    menu->addAction("清除选中曲线", curves_Force, &CurvePlot::clearCurve);
}
rescaleAxes 函数如下
void CurvePlot::rescaleAxes()//曲线全部显示
{
	//给第一个graph设置rescaleAxes(),后续所有graph都设置rescaleAxes(true)即可实现显示所有曲线。
	//rescaleAxes(true)时如果plot的X或Y轴本来能容纳下本graph的X或Y数据点,
	//那么plot的X或Y轴的可视范围就无需调整,只有plot容纳不下本graph时,才扩展plot两个轴的显示范围。
	//见博客https://www.csdn.net/gather_26/MtTaYg2sMzgxNDgtYmxvZwO0O0OO0O0O.html
	myPlot->graph(0)->rescaleAxes();
	myPlot->graph(1)->rescaleAxes(true);
	myPlot->replot();
}
演示

5.图像游标
使用游标的话需要配合鼠标事件完成
首先声明一下游标
	/*************游标*************/
	bool tracerEnable;//游标使能
	QCPItemTracer *tracer0 = nullptr; // 0号曲线游标
	QCPItemTracer *tracer1 = nullptr; // 1号曲线游标
	QCPItemText *tracer0Label = nullptr; // 0号曲线X游标标签
    QCPItemText *tracer1Label = nullptr;// 1号曲线Y轴游标标签
	void setVisibleTracer(bool trueorfalse);//游标可见/不可见 true/false
然后配置游标的属性
if (arg1)
	{
		qDebug() << "act_tracer is on!";
		tracerEnable = true;
		tracer0 = new QCPItemTracer(myPlot);
		tracer0->setStyle(QCPItemTracer::tsCrosshair);//游标样式:十字星、圆圈、方框
		tracer0->setPen(QPen(Qt::green));//设置tracer的颜色绿色
		tracer0->setPen(QPen(Qt::DashLine));//虚线游标
		tracer0->setBrush(QBrush(Qt::red));
		tracer0->setSize(10);
		tracer0->setInterpolating(true);//false禁用插值

		tracer1 = new QCPItemTracer(myPlot);
		tracer1->setStyle(QCPItemTracer::tsCrosshair);//游标样式:十字星、圆圈、方框
		tracer1->setPen(QPen(Qt::green));//设置tracer的颜色绿色
		tracer1->setPen(QPen(Qt::DashLine));//虚线游标
		tracer1->setBrush(QBrush(Qt::red));
		tracer1->setSize(10);
		tracer1->setInterpolating(true);//false禁用插值

		tracer0Label = new QCPItemText(myPlot);
		tracer0Label->setClipToAxisRect(false);
		tracer0Label->setLayer("overlay");
		tracer0Label->setPen(QPen(Qt::green));
		tracer0Label->setFont(QFont("Microsoft YaHei", 10));
		tracer0Label->setPadding(QMargins(2, 2, 2, 2));
		tracer0Label->setPositionAlignment(Qt::AlignLeft | Qt::AlignTop);
		//下面这个语句很重要,它将游标说明锚固在tracer位置处,实现自动跟随
		tracer0Label->position->setType(QCPItemPosition::ptAxisRectRatio);//位置类型(当前轴范围的比例为单位/实际坐标为单位)
		tracer0Label->position->setParentAnchor(tracer0->position);

		tracer1Label = new QCPItemText(myPlot);
		tracer1Label->setClipToAxisRect(false);
		tracer1Label->setLayer("overlay");
		tracer1Label->setPen(QPen(Qt::red));
		tracer1Label->setFont(QFont("Microsoft YaHei", 10));
		tracer1Label->setPadding(QMargins(2, 2, 2, 2));
		tracer1Label->setPositionAlignment(Qt::AlignLeft | Qt::AlignTop);
		//下面这个语句很重要,它将游标说明锚固在tracer位置处,实现自动跟随
		tracer1Label->position->setType(QCPItemPosition::ptAxisRectRatio);//位置类型(当前轴范围的比例为单位/实际坐标为单位)
		tracer1Label->position->setParentAnchor(tracer1->position);
	}
	else
	{
		qDebug() << "act_tracer is off !";
		tracerEnable = false;
		setVisibleTracer(false);
	}
然后编写鼠标事件,并进行信号槽绑定。
   //游标鼠标事件信号槽
    connect(widget_Force, &QCustomPlot::mouseMove, curves_Force, &CurvePlot::myMouseMoveEvent);
void CurvePlot::myMouseMoveEvent(QMouseEvent * event)//鼠标移动事件
{
	if (tracerEnable)//游标使能判断
	{
		double x = myPlot->xAxis->pixelToCoord(event->pos().x());//鼠标点的像素坐标转plot坐标

		foundRange = true;
		QrangeX0 = myPlot->graph(0)->getKeyRange(foundRange, QCP::sdBoth);//获取0号曲线X轴坐标范围
		QrangeX0_lower = QrangeX0.lower;
		QrangeX0_upper = QrangeX0.upper;

		QrangeX1 = myPlot->graph(1)->getKeyRange(foundRange, QCP::sdBoth);//获取1号曲线X轴坐标范围
		QrangeX1_lower = QrangeX1.lower;
		QrangeX1_upper = QrangeX1.upper;
		//如果鼠标移动超出0号曲线X轴范围,则0号曲线隐藏游标
		if (x < QrangeX0_upper && x > QrangeX0_lower)
		{
			tracer0->setGraph(myPlot->graph(0));//设置游标吸附在traceGraph这条曲线上
			tracer0->setGraphKey(x);//将游标横坐标(key)设置成刚获得的横坐标数据x (这就是游标随动的关键代码)
			tracer0->updatePosition(); //使得刚设置游标的横纵坐标位置生效
			double traceX0 = tracer0->position->key();
			double traceY0 = tracer0->position->value();

			tracer0Label->setText(QString::number(traceX0, 'f', 3));//游标文本框,指示游标的X值
			tracer0Label->setText(QString("x = %1\ny = %2").arg(QString::number(traceX0, 'f', 3)).arg(QString::number(traceY0, 'f', 3)));
			tracer0->setVisible(true);
			tracer0Label->setVisible(true);
		}
		else
		{
			tracer0->setVisible(false);
			tracer0Label->setVisible(false);
		}
		//如果鼠标移动超出1号曲线X轴范围,则1号曲线隐藏游标
		if (x < QrangeX1_upper && x > QrangeX1_lower)
		{
			double traceX1 = tracer1->position->key();
			double traceY1 = tracer1->position->value();
			tracer1->setGraph(myPlot->graph(1));//设置游标吸附在traceGraph这条曲线上
			tracer1->setGraphKey(x);
			tracer1->updatePosition(); //使得刚设置游标的横纵坐标位置生效

			tracer1Label->setText(QString("x = %1\ny = %2").arg(QString::number(traceX1, 'f', 3)).arg(QString::number(traceY1, 'f', 3)));

			tracer1->setVisible(true);
			tracer1Label->setVisible(true);
		}
		else
		{
			tracer1->setVisible(false);
			tracer1Label->setVisible(false);
		}
		myPlot->replot(QCustomPlot::rpQueuedReplot); //刷新图标,不能省略
	}
}
效果展示
6.【完整代码】将曲线抽象成一个类,以便复用
这里我写了一个CurvePlot的类,如果界面上同时有多个绘图窗口,那么就可以方便的进行复用。通过这个类可以设置曲线范围等参数,也将一些鼠标事件写了进去。这个是根据之前的一个项目做的,绘图框中绘制两条曲线,一条是目标曲线,一条是实时采集到的曲线。.大家可以在这个基础上进行修改。
CurvePlot.h如下
#ifndef CURVEPLOT_H
#define CURVEPLOT_H
#include "qcustomplot.h"

#pragma execution_character_set("utf-8")
class CurvePlot :public QObject
{
	Q_OBJECT
public:
	explicit CurvePlot(QCustomPlot * Plot);
	virtual ~CurvePlot();


	void setxAxisName(QString name);
	void setyAxisName(QString name);
	void setxAxisRange(double lower, double upper);
	void setyAxisRange(double lower, double upper);
	void setGraphName(QString name0, QString name1);
	void setSelectLegend(bool enabled);
	void setLegendFont(QFont font);

	/*************曲线数据*************/
	int curIndex;//当前曲线号 = 0, = 1, = -1时未选中曲线
	//0号曲线(目标曲线)
	QVector<double> x0;//存储x坐标的向量
	QVector<double> y0;//存储y坐标的向量
	QList<QList<QVariant>> x_y0;
	//1号曲线(采集曲线)
	QVector<double> x1;//存储x坐标的向量
	QVector<double> y1;//存储y坐标的向量
	QList<QList<QVariant>> x_y1;

public slots:
	void on_act_tracerToggled(bool arg1);
	void myMouseMoveEvent(QMouseEvent* event);//鼠标事件
	void rescaleAxes();//自动调整
	void clearCurve();//清除曲线
	void clearAllCurves();//清除所有曲线
private:
	/*绘图窗口*/
	QCustomPlot * myPlot = nullptr;

	/*画笔*/
	QVector<QPen> pen;
	/*************游标*************/
	bool tracerEnable;//游标使能
	QCPItemTracer *tracer0 = nullptr; // 0号曲线游标
	QCPItemTracer *tracer1 = nullptr; // 1号曲线游标
	QCPItemText *tracer0Label = nullptr; // 0号曲线X游标标签
    QCPItemText *tracer1Label = nullptr;// 1号曲线Y轴游标标签
	void setVisibleTracer(bool trueorfalse);//游标可见/不可见 true/false

	/*********曲线X轴范围**********/
	QCPRange QrangeX0;//0号曲线X轴范围
	double  QrangeX0_lower;
	double  QrangeX0_upper;
	QCPRange QrangeX1;//1号曲线X轴范围
	double  QrangeX1_lower;
	double  QrangeX1_upper;
	bool foundRange;
};

#endif
CurvePlot.cpp如下
#include "CurvePlot.h"

CurvePlot::CurvePlot(QCustomPlot * Plot)
{
	myPlot = Plot;
	tracerEnable = false;
	/*************绘图模块***************/
	//设置坐标轴字体
	QFont YHfont("Microsoft YaHei", 10, QFont::Normal);
	myPlot->setFont(YHfont);
	myPlot->xAxis->setLabelFont(YHfont);
	myPlot->xAxis->setTickLabelFont(YHfont);
	myPlot->yAxis->setLabelFont(YHfont);
	myPlot->yAxis->setTickLabelFont(YHfont);
	//设定右上角图例标注的字体
	myPlot->legend->setFont(YHfont);
	//设定右上角图例标注可见
	myPlot->legend->setVisible(true);

	//添加图形
	myPlot->addGraph();
	myPlot->addGraph();
	//曲线全部可见
	myPlot->graph(0)->rescaleAxes();
	myPlot->graph(1)->rescaleAxes(true);
	//设置画笔
	QPen pen0(Qt::blue, 1, Qt::SolidLine, Qt::RoundCap, Qt::RoundJoin);
	QPen pen1(Qt::red, 1, Qt::SolidLine, Qt::RoundCap, Qt::RoundJoin);
	pen.append(pen0);
	pen.append(pen1);
	myPlot->graph(0)->setPen(pen[0]);
	myPlot->graph(1)->setPen(pen[1]);
	//设置线型
	myPlot->graph(0)->setLineStyle(QCPGraph::lsLine);
	myPlot->graph(1)->setLineStyle(QCPGraph::lsLine);
	//设置线上点的风格
	myPlot->graph(0)->setScatterStyle(QCPScatterStyle::ssNone);
	myPlot->graph(1)->setScatterStyle(QCPScatterStyle::ssNone);
	//右键菜单自定义
	myPlot->setContextMenuPolicy(Qt::CustomContextMenu);
	/**********鼠标操作图像模块************/
	myPlot->selectionRect()->setPen(QPen(Qt::black, 1, Qt::DashLine));//设置选框的样式:虚线
	myPlot->selectionRect()->setBrush(QBrush(QColor(0, 0, 100, 50)));//设置选框的样式:半透明浅蓝
	myPlot->setInteraction(QCP::iRangeDrag, true); //鼠标单击拖动 QCPAxisRect::mousePressEvent() 左键拖动
	myPlot->setInteraction(QCP::iRangeZoom, true); //滚轮滑动缩放
	myPlot->setInteraction(QCP::iSelectAxes, true);
	myPlot->setInteraction(QCP::iSelectLegend, true); //图例可选
	myPlot->selectionRect()->setPen(QPen(Qt::black, 1, Qt::DashLine));
	myPlot->selectionRect()->setBrush(QBrush(QColor(0, 0, 100, 50)));
}

CurvePlot::~CurvePlot()
{
}
//X轴名称
void CurvePlot::setxAxisName(QString name)
{
	myPlot->xAxis->setLabel(name);
}
//Y轴名称
void CurvePlot::setyAxisName(QString name)
{
	myPlot->yAxis->setLabel(name);
}
//X轴范围
void CurvePlot::setxAxisRange(double lower, double upper)
{
	myPlot->xAxis->setRange(lower, upper);
}
//Y轴范围
void CurvePlot::setyAxisRange(double lower, double upper)
{
	myPlot->yAxis->setRange(lower, upper);
}
//曲线图例名称
void CurvePlot::setGraphName(QString name0, QString name1)
{
	//设置右上角图形标注名称
	myPlot->graph(0)->setName(name0);
	myPlot->graph(1)->setName(name1);
}
void CurvePlot::setSelectLegend(bool enabled)
{
	if (enabled)
	{
		myPlot->setInteraction(QCP::iSelectLegend, true); //图例可选
	}
	else
	{
		myPlot->setInteraction(QCP::iSelectLegend, false); //图例可选
	}
}
void CurvePlot::setLegendFont(QFont font)
{
	myPlot->legend->setFont(font);
}
void CurvePlot::on_act_tracerToggled(bool arg1)
{
	if (arg1)
	{
		qDebug() << "act_tracer is on!";
		tracerEnable = true;
		tracer0 = new QCPItemTracer(myPlot);
		tracer0->setStyle(QCPItemTracer::tsCrosshair);//游标样式:十字星、圆圈、方框
		tracer0->setPen(QPen(Qt::green));//设置tracer的颜色绿色
		tracer0->setPen(QPen(Qt::DashLine));//虚线游标
		tracer0->setBrush(QBrush(Qt::red));
		tracer0->setSize(10);
		tracer0->setInterpolating(true);//false禁用插值

		tracer1 = new QCPItemTracer(myPlot);
		tracer1->setStyle(QCPItemTracer::tsCrosshair);//游标样式:十字星、圆圈、方框
		tracer1->setPen(QPen(Qt::green));//设置tracer的颜色绿色
		tracer1->setPen(QPen(Qt::DashLine));//虚线游标
		tracer1->setBrush(QBrush(Qt::red));
		tracer1->setSize(10);
		tracer1->setInterpolating(true);//false禁用插值

		tracer0Label = new QCPItemText(myPlot);
		tracer0Label->setClipToAxisRect(false);
		tracer0Label->setLayer("overlay");
		tracer0Label->setPen(QPen(Qt::green));
		tracer0Label->setFont(QFont("Microsoft YaHei", 10));
		tracer0Label->setPadding(QMargins(2, 2, 2, 2));
		tracer0Label->setPositionAlignment(Qt::AlignLeft | Qt::AlignTop);
		//下面这个语句很重要,它将游标说明锚固在tracer位置处,实现自动跟随
		tracer0Label->position->setType(QCPItemPosition::ptAxisRectRatio);//位置类型(当前轴范围的比例为单位/实际坐标为单位)
		tracer0Label->position->setParentAnchor(tracer0->position);

		tracer1Label = new QCPItemText(myPlot);
		tracer1Label->setClipToAxisRect(false);
		tracer1Label->setLayer("overlay");
		tracer1Label->setPen(QPen(Qt::red));
		tracer1Label->setFont(QFont("Microsoft YaHei", 10));
		tracer1Label->setPadding(QMargins(2, 2, 2, 2));
		tracer1Label->setPositionAlignment(Qt::AlignLeft | Qt::AlignTop);
		//下面这个语句很重要,它将游标说明锚固在tracer位置处,实现自动跟随
		tracer1Label->position->setType(QCPItemPosition::ptAxisRectRatio);//位置类型(当前轴范围的比例为单位/实际坐标为单位)
		tracer1Label->position->setParentAnchor(tracer1->position);
	}
	else
	{
		qDebug() << "act_tracer is off !";
		tracerEnable = false;
		setVisibleTracer(false);
	}
}
void CurvePlot::myMouseMoveEvent(QMouseEvent * event)//鼠标移动事件
{
	if (tracerEnable)//游标使能判断
	{
		double x = myPlot->xAxis->pixelToCoord(event->pos().x());//鼠标点的像素坐标转plot坐标

		foundRange = true;
		QrangeX0 = myPlot->graph(0)->getKeyRange(foundRange, QCP::sdBoth);//获取0号曲线X轴坐标范围
		QrangeX0_lower = QrangeX0.lower;
		QrangeX0_upper = QrangeX0.upper;

		QrangeX1 = myPlot->graph(1)->getKeyRange(foundRange, QCP::sdBoth);//获取1号曲线X轴坐标范围
		QrangeX1_lower = QrangeX1.lower;
		QrangeX1_upper = QrangeX1.upper;
		//如果鼠标移动超出0号曲线X轴范围,则0号曲线隐藏游标
		if (x < QrangeX0_upper && x > QrangeX0_lower)
		{
			tracer0->setGraph(myPlot->graph(0));//设置游标吸附在traceGraph这条曲线上
			tracer0->setGraphKey(x);//将游标横坐标(key)设置成刚获得的横坐标数据x (这就是游标随动的关键代码)
			tracer0->updatePosition(); //使得刚设置游标的横纵坐标位置生效
			double traceX0 = tracer0->position->key();
			double traceY0 = tracer0->position->value();

			tracer0Label->setText(QString::number(traceX0, 'f', 3));//游标文本框,指示游标的X值
			tracer0Label->setText(QString("x = %1\ny = %2").arg(QString::number(traceX0, 'f', 3)).arg(QString::number(traceY0, 'f', 3)));
			tracer0->setVisible(true);
			tracer0Label->setVisible(true);
		}
		else
		{
			tracer0->setVisible(false);
			tracer0Label->setVisible(false);
		}
		//如果鼠标移动超出1号曲线X轴范围,则1号曲线隐藏游标
		if (x < QrangeX1_upper && x > QrangeX1_lower)
		{
			double traceX1 = tracer1->position->key();
			double traceY1 = tracer1->position->value();
			tracer1->setGraph(myPlot->graph(1));//设置游标吸附在traceGraph这条曲线上
			tracer1->setGraphKey(x);
			tracer1->updatePosition(); //使得刚设置游标的横纵坐标位置生效

			tracer1Label->setText(QString("x = %1\ny = %2").arg(QString::number(traceX1, 'f', 3)).arg(QString::number(traceY1, 'f', 3)));

			tracer1->setVisible(true);
			tracer1Label->setVisible(true);
		}
		else
		{
			tracer1->setVisible(false);
			tracer1Label->setVisible(false);
		}
		myPlot->replot(QCustomPlot::rpQueuedReplot); //刷新图标,不能省略
	}
}

void CurvePlot::rescaleAxes()//曲线全部显示
{
	//给第一个graph设置rescaleAxes(),后续所有graph都设置rescaleAxes(true)即可实现显示所有曲线。
	//rescaleAxes(true)时如果plot的X或Y轴本来能容纳下本graph的X或Y数据点,
	//那么plot的X或Y轴的可视范围就无需调整,只有plot容纳不下本graph时,才扩展plot两个轴的显示范围。
	//见博客https://www.csdn.net/gather_26/MtTaYg2sMzgxNDgtYmxvZwO0O0OO0O0O.html
	myPlot->graph(0)->rescaleAxes();
	myPlot->graph(1)->rescaleAxes(true);
	myPlot->replot();
}

void CurvePlot::clearCurve()
{
	switch (this->curIndex)
	{
	case 0:
		this->x0.clear();
		this->y0.clear();
		this->x_y0.clear();
		myPlot->graph(0)->setData(this->x0, this->y0);
		break;
	case 1:
		this->x1.clear();
		this->y1.clear();
		this->x_y1.clear();
		myPlot->graph(1)->setData(this->x1, this->y1);
		break;
	case -1:
		qDebug() << "未选中曲线!";
		break;
	}
	myPlot->replot(QCustomPlot::rpQueuedReplot);
}

void CurvePlot::clearAllCurves()
{
	//this->x0.clear();
	//this->y0.clear();
	//this->x_y0.clear();
	//myPlot->graph(0)->setData(this->x0, this->y0);
	this->x1.clear();
	this->y1.clear();
	this->x_y1.clear();
	myPlot->graph(1)->setData(this->x1, this->y1);
	myPlot->replot(QCustomPlot::rpQueuedReplot);
}

void CurvePlot::setVisibleTracer(bool trueorfalse)
{
	tracer0->setVisible(trueorfalse);
	tracer1->setVisible(trueorfalse);
	tracer0Label->setVisible(trueorfalse);
	tracer1Label->setVisible(trueorfalse);
	myPlot->replot(QCustomPlot::rpQueuedReplot); //刷新图标,不能省略
}