一、最小二乘法原理

假设目前我们有一些数据,x是输入,y是与之对应的输出。现在想利用这些已有的数据,从中发现出规律,来预测没有出现过的输入会产生什么样的输出。
假设系统为单输入单输出系统,我们想在这个系统里找到数据背后的规律。规律需要通过模型来进行表征。为了表征规律可以使用不同的手段,不同的手段所建立的模型各有差异,有的模型精确度高但是使用麻烦,有的模型精确度欠缺但是使用简便。下面要介绍典型的建模方法——最小二乘法。
这里说的建模是指建立数学模型,即通过数学表达式来表征规律。通常最容易想到的表达式就是一次函数,二次函数了。
设模型: ,通过数据集
(i可以是很多数)来确定k,b
确定k,b只需要两对数据就够了,两点确定一条直线,数据多了会过拟合的。我们采集了很多数据,下面考虑如何将多采集的数据利用起来。
下面有两种思路:
方法一:更换模型,将一次换成高次,如:
方法二:仍用原模型,尽可能让各点靠近直线,或者说找到一组k和b使直线周围分布尽可能多的点。
对于方法一,将一次换成二次,三次还可以接受,但是当数据很多时用该方法计算量太大了,不可取。
最小二乘法采用的就是方法二的思想,目标是让各点靠近直线。下面接着思考用什么评价指标来进行衡量。
下面引出了“误差平方和”的概念。为了完成上面的目标,先想到所有点到直线的距离求和,但是若使用点到直线距离公式会出现根号,计算会比较麻烦,所以对各点距离取平方再求和,这样计算量就小很多了。
L称为目标函数,即上面所提到的最小平方和。通过求导就能求出它的极小值。
推导过程就省略了,下面直接给出结论:
假设有五个样本,要拟合的函数为:
则各参数含义为:
二、MATLAB代码实现
function main()
    % 主程序
    [X, y] = generate_data(100);
    degree = 3;
    X_poly = polynomial_features(X, degree);
    X_new = linspace(0, 2, 100)';
    X_new_poly = polynomial_features(X_new, degree);
    theta_best = least_squares_fit(X_poly, y);

    disp('Theta values:');
    disp(theta_best');

    y_predict = predict(X_new_poly, theta_best);

    plot_data_and_predictions(X, y, X_new, y_predict);
end

function [X, y] = generate_data(num_points)
    % 生成示例数据
    rng(0); % 设置随机数生成器的种子
    X = 2 * rand(num_points, 1);
    y = 4 + 3 * X + randn(num_points, 1);
end

function X_poly = polynomial_features(X, degree)
    % 为给定的X生成多项式特征
    X_poly = [ones(size(X, 1), 1)]; % 添加偏置项(常数项)
    for d = 2:degree+1
        X_poly = [X_poly, X.^d]; % 添加多项式项
    end
end

function theta_best = least_squares_fit(X_poly, y)
    % 使用最小二乘法拟合模型
    theta_best = X_poly' * X_poly \ X_poly' * y;
end

function y_predict = predict(X_poly, theta)
    % 使用拟合的模型进行预测
    y_predict = X_poly * theta;
end

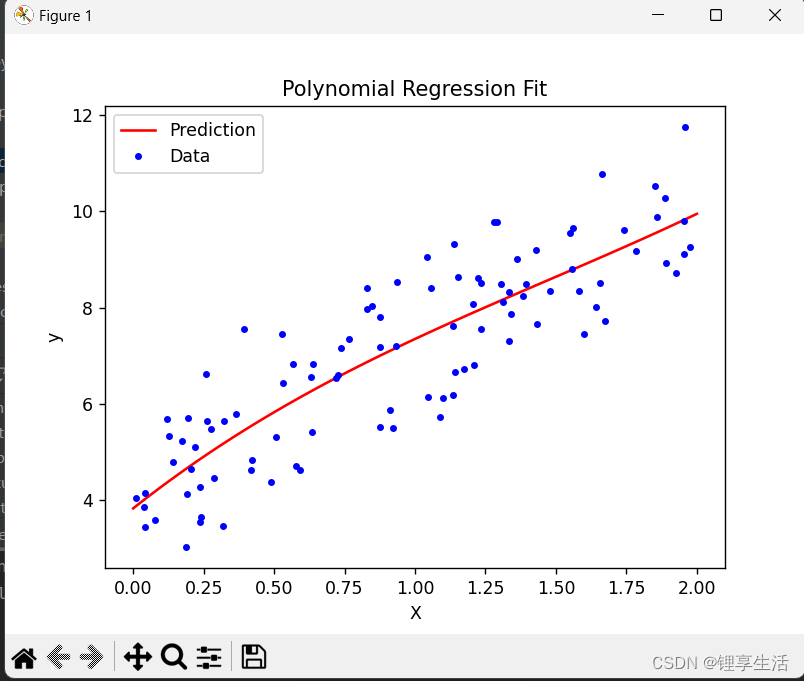
function plot_data_and_predictions(X, y, X_new, y_predict)
    % 可视化数据和预测结果
    figure;
    plot(X_new, y_predict, 'r-', 'DisplayName', 'Prediction');
    hold on;
    plot(X, y, 'b.', 'DisplayName', 'Data');
    hold off;
    xlabel('X');
    ylabel('y');
    title('Polynomial Regression Fit');
    legend('show');
end
三、python代码实现
import numpy as np
import matplotlib.pyplot as plt


def generate_data(num_points=100):
    """
    生成示例数据
    """
    np.random.seed(0)
    X = 2 * np.random.rand(num_points, 1)
    y = 4 + 3 * X + np.random.randn(num_points, 1)
    return X, y


def polynomial_features(X, degree):
    """
    为给定的X生成多项式特征
    """
    # 在多项式特征中添加偏置项(常数项)
    X_poly = np.c_[np.ones((X.shape[0], 1))]
    # range的范围是1-degree,不包括degree+1
    for d in range(1, degree + 1):
        # np.c_ 是 NumPy 中用于按列合并数组的对象
        X_poly = np.c_[X_poly, X ** d]
    return X_poly


def least_squares_fit(X_poly, y):
    """
    使用最小二乘法拟合模型
    """
    # 使用公式求theta
    theta_best = np.linalg.inv(X_poly.T.dot(X_poly)).dot(X_poly.T).dot(y)
    return theta_best


def predict(X_poly, theta):
    """
    使用拟合的模型进行预测
    """
    return X_poly.dot(theta)


def plot_data_and_predictions(X, y, X_new, y_predict):
    """
    可视化数据和预测结果
    """
    plt.plot(X_new, y_predict, "r-", label="Prediction")
    plt.plot(X, y, "b.", label="Data")
    plt.xlabel("X")
    plt.ylabel("y")
    plt.title("Polynomial Regression Fit")
    plt.legend()
    plt.show()


# 主程序
if __name__ == "__main__":
    # 生成数据
    X, y = generate_data()

    # 设置多项式的次数
    degree = 3

    # 为训练数据和新数据生成多项式特征
    X_poly = polynomial_features(X, degree)
    X_new = np.linspace(0, 2, 100).reshape(100, 1)
    X_new_poly = polynomial_features(X_new, degree)

    # 使用最小二乘法拟合模型
    theta_best = least_squares_fit(X_poly, y)

    # 打印计算出的theta值,按顺序显示常数项、一次项、二次项...系数
    print("Theta values:", theta_best.flatten())

    # 进行预测
    y_predict = predict(X_new_poly, theta_best)

    # 可视化结果
    plot_data_and_predictions(X, y, X_new, y_predict)