文章目录
- 一、动画
- 1.1 基本动画
- 1.2 使用 Plotly Express 制作动画条形图
- 1.3 当前动画限制和注意事项
- 二、为动画添加控制按钮
- 2.1 简单的播放按钮
- 2.2 曲线上的移动点
- 2.3 沿平面曲线移动 Frenet 框架
- 2.4 使用滑块和按钮
- 三、MRI 体积切片的可视化
一、动画
使用 Plotly Express 制作的动画
几个Plotly Express 函数支持通过animation_frame和animation_group参数创建动画图形。
这是使用 Plotly Express 创建的动画散点图示例。请注意,您应该始终修复x_range和y_range以确保您的数据在整个动画过程中保持可见。
1.1 基本动画
import plotly.express as px
df = px.data.gapminder()
fig = px.scatter(df, x="gdpPercap", y="lifeExp", animation_frame="year", animation_group="country",
           size="pop", color="continent", hover_name="country",
           log_x=True, size_max=55, range_x=[100,100000], range_y=[25,90])
fig.show()
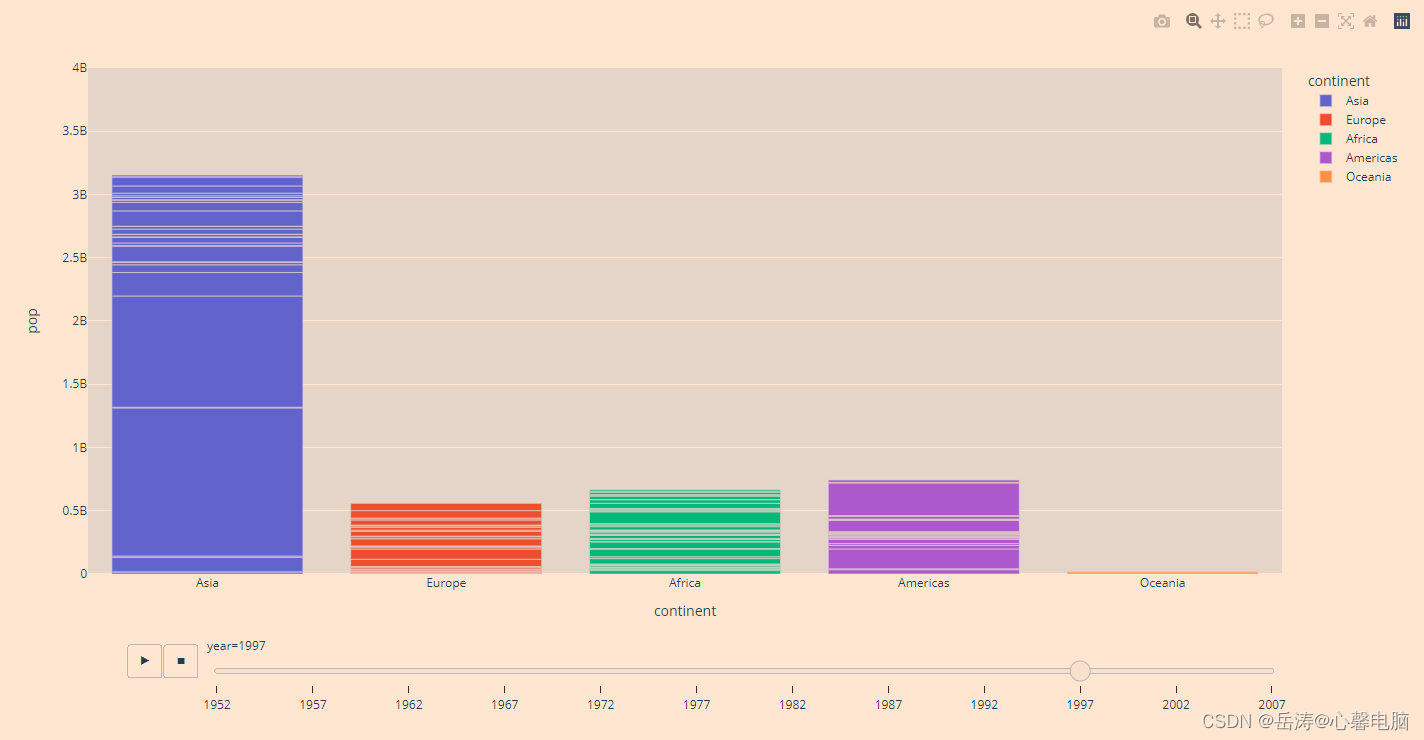
1.2 使用 Plotly Express 制作动画条形图
请注意,您应该始终修复y_range以确保您的数据在整个动画过程中保持可见。
import plotly.express as px

df = px.data.gapminder()

fig = px.bar(df, x="continent", y="pop", color="continent",
  animation_frame="year", animation_group="country", range_y=[0,4000000000])
fig.show()
1.3 当前动画限制和注意事项
- 当每一行输入都存在于所有动画帧中,并且当映射到符号、颜色和构面的分类值在帧中保持不变时,动画设计得很好。如果不满足这些约束,动画可能会产生误导或不一致。
- 尽管 Plotly Express 支持许多图表和地图类型的动画,但如今平滑的帧间过渡仅适用于scatter和bar
- Plotly Express不会自动计算所有 x/y/颜色范围的并集,因此必须手动指定这些范围以避免跨帧的比例跳跃
二、为动画添加控制按钮
您可以通过将updatemenus数组添加layout到figure. Plotly 的updatemenus参考资料中提供了有关按钮样式和位置的更多信息。
按钮定义如下:
"updatemenus": [{"type": "buttons",
                 "buttons": [{"label": "Your Label",
                              "method": "animate",
                              "args": [See Below]}]}]
定义按钮参数
- None:设置"args"为 undefined (ie “args”: [None]) 将创建一个简单的播放按钮,该按钮将为所有帧设置动画。
- string:使用 group 为所有帧设置动画""。这是一种确定动画范围的方法,以防您希望在不显式枚举所有帧的情况下进行动画处理。
- [“frame1”, “frame2”, …]:动画一系列命名帧。
- [{data: [], layout: {}, traces: []}, {…}]:几乎与动画命名帧相同;尽管此变体允许您内联数据而不是将其添加为命名帧。这对于不需要为临时更改添加和管理命名帧的交互很有用。
- [null]:创建暂停按钮的简单方法(需要mode: “immediate”)。此参数转储当前排队的帧 ( mode: “immediate”),然后为空的帧序列 ( [null]) 设置动画。
- 请注意:我们不建议使用:[ ]. 这种语法可能会引起混淆,因为它看起来与“暂停按钮”没有区别,但嵌套属性具有将空数组视为完全可移动的逻辑,因此它将用作播放按钮。
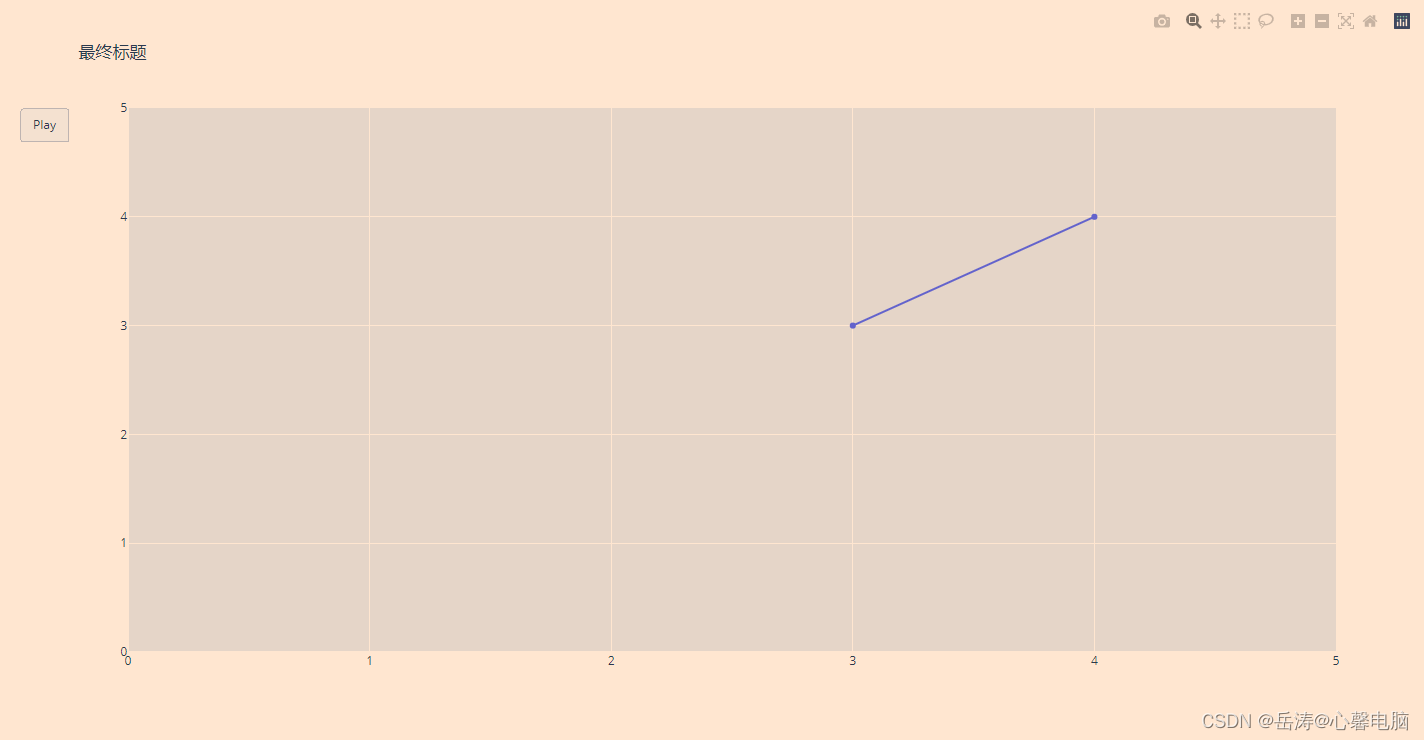
2.1 简单的播放按钮
import plotly.graph_objects as go

fig = go.Figure(
    data=[go.Scatter(x=[0, 1], y=[0, 1])],
    layout=go.Layout(
        xaxis=dict(range=[0, 5], autorange=False),
        yaxis=dict(range=[0, 5], autorange=False),
        title="开始标题",
        updatemenus=[dict(
            type="buttons",
            buttons=[dict(label="Play",
                          method="animate",
                          args=[None])])]
    ),
    frames=[go.Frame(data=[go.Scatter(x=[1, 2], y=[1, 2])]),
            go.Frame(data=[go.Scatter(x=[1, 4], y=[1, 4])]),
            go.Frame(data=[go.Scatter(x=[3, 4], y=[3, 4])],
                     layout=go.Layout(title_text="最终标题"))]
)

fig.show()
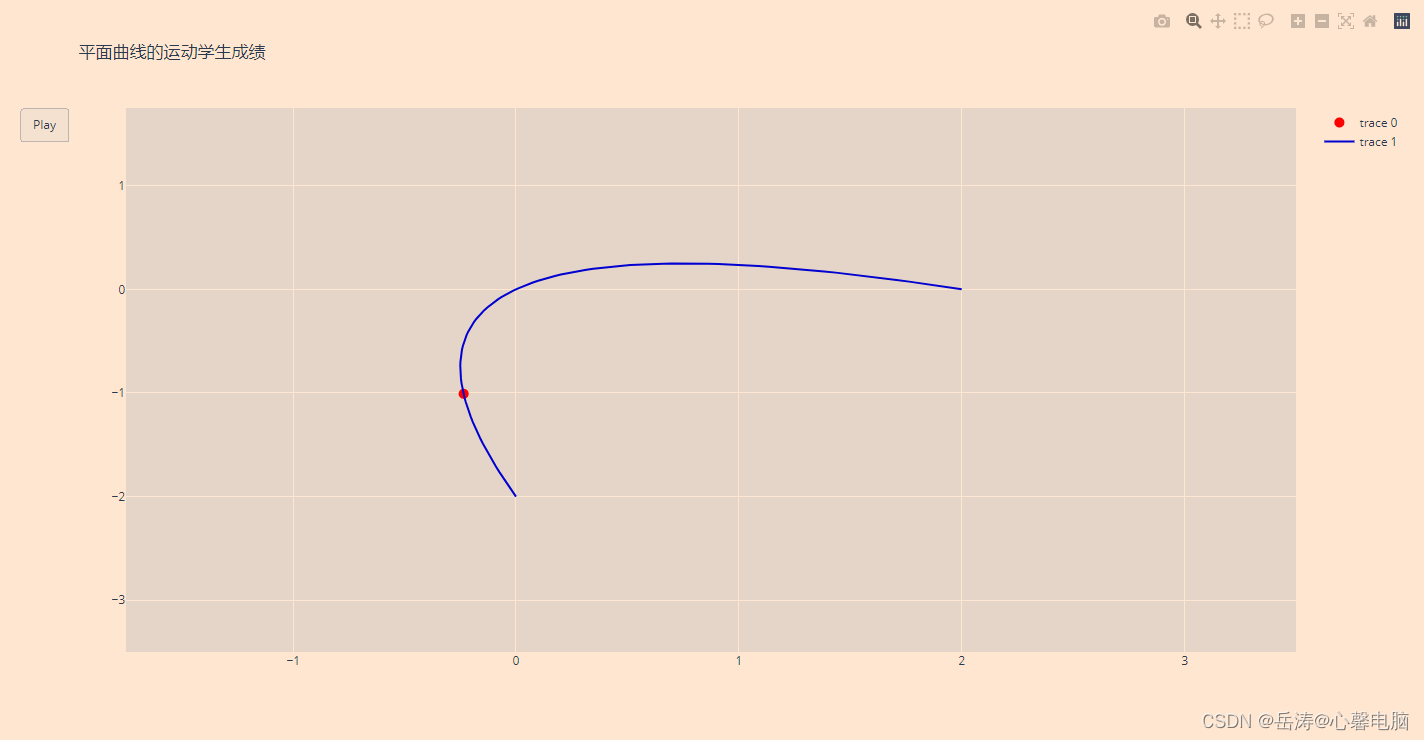
2.2 曲线上的移动点
import plotly.graph_objects as go

import numpy as np

# 生成曲线数据
t = np.linspace(-1, 1, 100)
x = t + t ** 2
y = t - t ** 2
xm = np.min(x) - 1.5
xM = np.max(x) + 1.5
ym = np.min(y) - 1.5
yM = np.max(y) + 1.5
N = 50
s = np.linspace(-1, 1, N)
xx = s + s ** 2
yy = s - s ** 2


# Create figure
fig = go.Figure(
    data=[go.Scatter(x=x, y=y,
                     mode="lines",
                     line=dict(width=2, color="blue")),
          go.Scatter(x=x, y=y,
                     mode="lines",
                     line=dict(width=2, color="blue"))],
    layout=go.Layout(
        xaxis=dict(range=[xm, xM], autorange=False, zeroline=False),
        yaxis=dict(range=[ym, yM], autorange=False, zeroline=False),
        title_text="平面曲线的运动学生成绩", hovermode="closest",
        updatemenus=[dict(type="buttons",
                          buttons=[dict(label="Play",
                                        method="animate",
                                        args=[None])])]),
    frames=[go.Frame(
        data=[go.Scatter(
            x=[xx[k]],
            y=[yy[k]],
            mode="markers",
            marker=dict(color="red", size=10))])

        for k in range(N)]
)

fig.show()
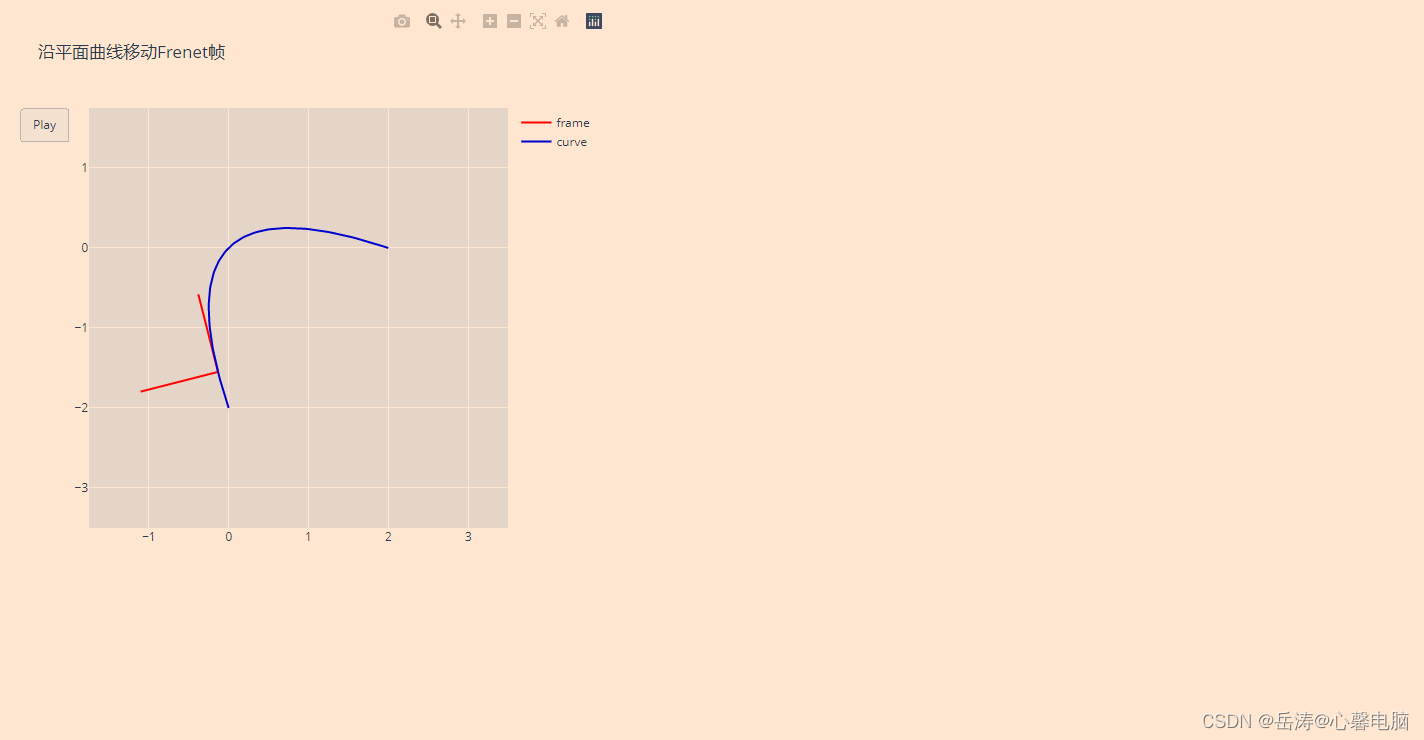
2.3 沿平面曲线移动 Frenet 框架
import plotly.graph_objects as go

import numpy as np


# 生成曲线数据
t = np.linspace(-1, 1, 100)
x = t + t ** 2
y = t - t ** 2
xm = np.min(x) - 1.5
xM = np.max(x) + 1.5
ym = np.min(y) - 1.5
yM = np.max(y) + 1.5
N = 50
s = np.linspace(-1, 1, N)
xx = s + s ** 2
yy = s - s ** 2
vx = 1 + 2 * s
vy = 1 - 2 * s  # v=(vx, vy) is the velocity
speed = np.sqrt(vx ** 2 + vy ** 2)
ux = vx / speed  # (ux, uy) unit tangent vector, (-uy, ux) unit normal vector
uy = vy / speed

xend = xx + ux  # (xx,yy)处单位切线向量的终点坐标
yend = yy + uy

xnoe = xx - uy  # (xx,yy)处单位法向量的结束坐标
ynoe = yy + ux


# Create figure
fig = go.Figure(
    data=[go.Scatter(x=x, y=y,
                     name="frame",
                     mode="lines",
                     line=dict(width=2, color="blue")),
          go.Scatter(x=x, y=y,
                     name="curve",
                     mode="lines",
                     line=dict(width=2, color="blue"))
          ],
    layout=go.Layout(width=600, height=600,
                     xaxis=dict(range=[xm, xM], autorange=False, zeroline=False),
                     yaxis=dict(range=[ym, yM], autorange=False, zeroline=False),
                     title="沿平面曲线移动Frenet帧",
                     hovermode="closest",
                     updatemenus=[dict(type="buttons",
                                       buttons=[dict(label="Play",
                                                     method="animate",
                                                     args=[None])])]),

    frames=[go.Frame(
        data=[go.Scatter(
            x=[xx[k], xend[k], None, xx[k], xnoe[k]],
            y=[yy[k], yend[k], None, yy[k], ynoe[k]],
            mode="lines",
            line=dict(color="red", width=2))
        ]) for k in range(N)]
)

fig.show()
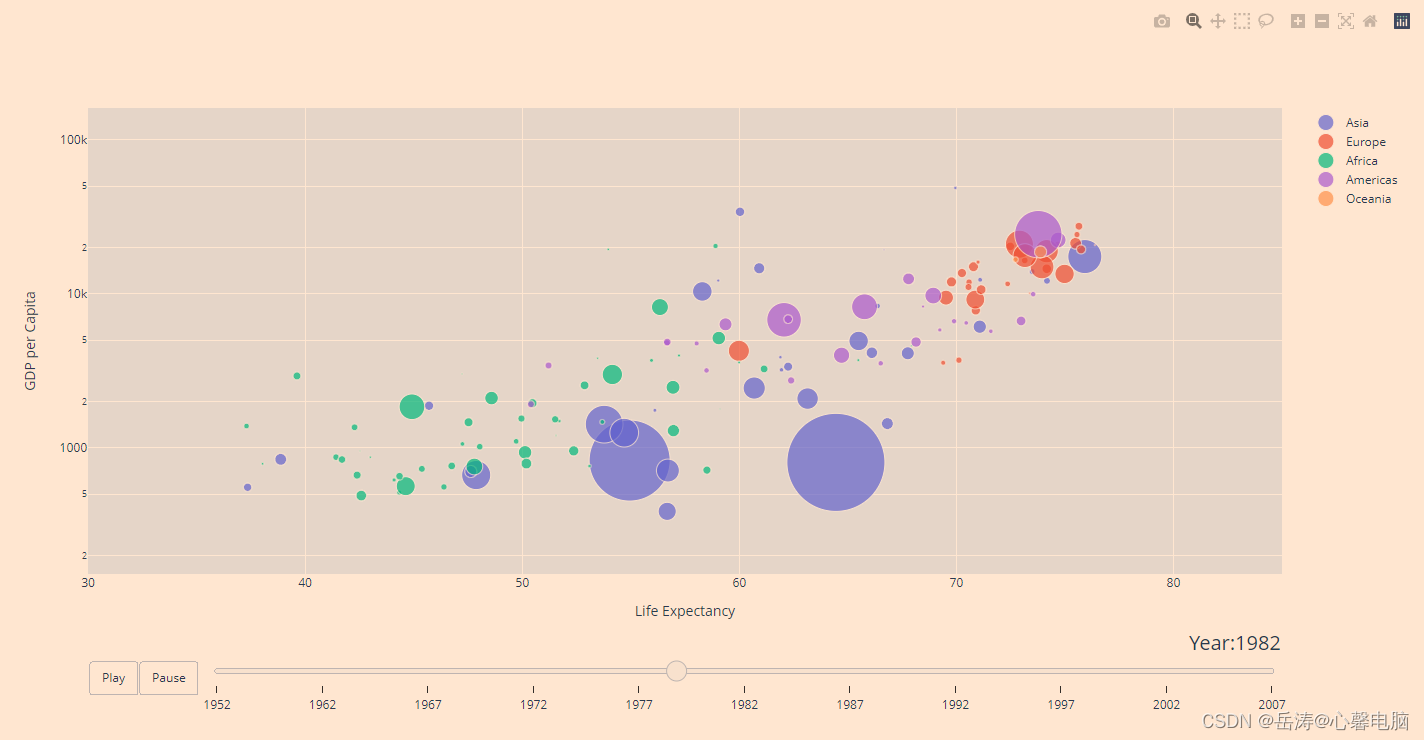
2.4 使用滑块和按钮
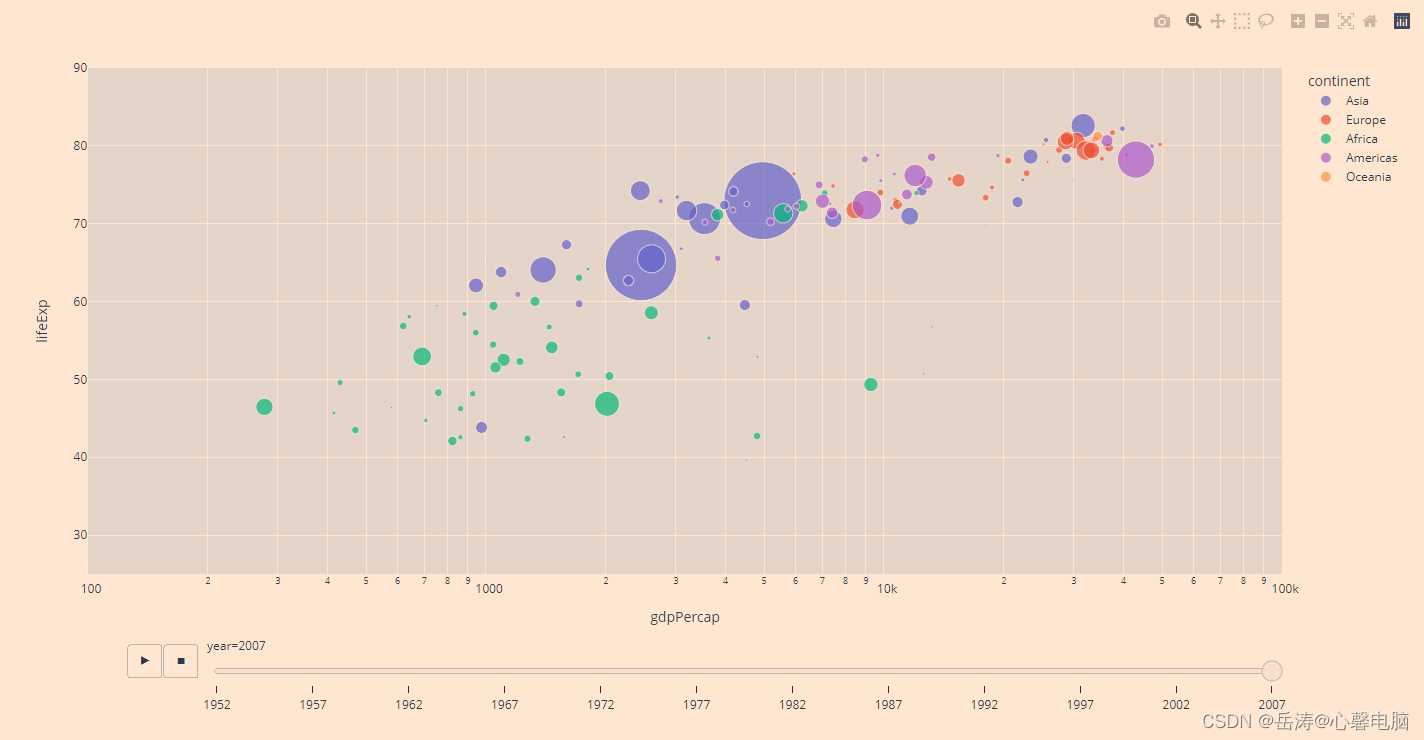
以下示例使用众所周知的Gapminder 数据集来举例说明动画功能。这个气泡图动画显示了从 1952 年到 2007 年,几个国家的“人均 GDP”相对于“预期寿命”的变化,按各自的大陆着色并按人口大小排列。
这也是将图形结构构建为 Python 字典,然后从该字典构造图形对象图形的示例。
import plotly.graph_objects as go

import pandas as pd

url = "https://raw.githubusercontent.com/plotly/datasets/master/gapminderDataFiveYear.csv"
dataset = pd.read_csv('f:/gapminderDataFiveYear.csv')

years = ["1952", "1962", "1967", "1972", "1977", "1982", "1987", "1992", "1997", "2002",
         "2007"]

# make list of continents
continents = []
for continent in dataset["continent"]:
    if continent not in continents:
        continents.append(continent)
# make figure
fig_dict = {
    "data": [],
    "layout": {},
    "frames": []
}

# fill in most of layout
fig_dict["layout"]["xaxis"] = {"range": [30, 85], "title": "Life Expectancy"}
fig_dict["layout"]["yaxis"] = {"title": "GDP per Capita", "type": "log"}
fig_dict["layout"]["hovermode"] = "closest"
fig_dict["layout"]["updatemenus"] = [
    {
        "buttons": [
            {
                "args": [None, {"frame": {"duration": 500, "redraw": False},
                                "fromcurrent": True, "transition": {"duration": 300,
                                                                    "easing": "quadratic-in-out"}}],
                "label": "Play",
                "method": "animate"
            },
            {
                "args": [[None], {"frame": {"duration": 0, "redraw": False},
                                  "mode": "immediate",
                                  "transition": {"duration": 0}}],
                "label": "Pause",
                "method": "animate"
            }
        ],
        "direction": "left",
        "pad": {"r": 10, "t": 87},
        "showactive": False,
        "type": "buttons",
        "x": 0.1,
        "xanchor": "right",
        "y": 0,
        "yanchor": "top"
    }
]

sliders_dict = {
    "active": 0,
    "yanchor": "top",
    "xanchor": "left",
    "currentvalue": {
        "font": {"size": 20},
        "prefix": "Year:",
        "visible": True,
        "xanchor": "right"
    },
    "transition": {"duration": 300, "easing": "cubic-in-out"},
    "pad": {"b": 10, "t": 50},
    "len": 0.9,
    "x": 0.1,
    "y": 0,
    "steps": []
}

# make data
year = 1952
for continent in continents:
    dataset_by_year = dataset[dataset["year"] == year]
    dataset_by_year_and_cont = dataset_by_year[
        dataset_by_year["continent"] == continent]

    data_dict = {
        "x": list(dataset_by_year_and_cont["lifeExp"]),
        "y": list(dataset_by_year_and_cont["gdpPercap"]),
        "mode": "markers",
        "text": list(dataset_by_year_and_cont["country"]),
        "marker": {
            "sizemode": "area",
            "sizeref": 200000,
            "size": list(dataset_by_year_and_cont["pop"])
        },
        "name": continent
    }
    fig_dict["data"].append(data_dict)

# make frames
for year in years:
    frame = {"data": [], "name": str(year)}
    for continent in continents:
        dataset_by_year = dataset[dataset["year"] == int(year)]
        dataset_by_year_and_cont = dataset_by_year[
            dataset_by_year["continent"] == continent]

        data_dict = {
            "x": list(dataset_by_year_and_cont["lifeExp"]),
            "y": list(dataset_by_year_and_cont["gdpPercap"]),
            "mode": "markers",
            "text": list(dataset_by_year_and_cont["country"]),
            "marker": {
                "sizemode": "area",
                "sizeref": 200000,
                "size": list(dataset_by_year_and_cont["pop"])
            },
            "name": continent
        }
        frame["data"].append(data_dict)

    fig_dict["frames"].append(frame)
    slider_step = {"args": [
        [year],
        {"frame": {"duration": 300, "redraw": False},
         "mode": "immediate",
         "transition": {"duration": 300}}
    ],
        "label": year,
        "method": "animate"}
    sliders_dict["steps"].append(slider_step)


fig_dict["layout"]["sliders"] = [sliders_dict]

fig = go.Figure(fig_dict)

fig.show()
三、MRI 体积切片的可视化
# 导入数据
import time
import numpy as np

from skimage import io
# 'https://s3.amazonaws.com/assets.datacamp.com/blog_assets/attention-mri.tif'
vol = io.imread("f:/attention-mri.tif")
volume = vol.T
r, c = volume[0].shape

# 定义框架
import plotly.graph_objects as go
nb_frames = 68

fig = go.Figure(frames=[go.Frame(data=go.Surface(
    z=(6.7 - k * 0.1) * np.ones((r, c)),
    surfacecolor=np.flipud(volume[67 - k]),
    cmin=0, cmax=200
    ),
    name=str(k) # 需要命名帧,动画才能正常运行
    )
    for k in range(nb_frames)])

# 添加动画开始前要显示的数据
fig.add_trace(go.Surface(
    z=6.7 * np.ones((r, c)),
    surfacecolor=np.flipud(volume[67]),
    colorscale='Gray',
    cmin=0, cmax=200,
    colorbar=dict(thickness=20, ticklen=4)
    ))


def frame_args(duration):
    return {
            "frame": {"duration": duration},
            "mode": "immediate",
            "fromcurrent": True,
            "transition": {"duration": duration, "easing": "linear"},
        }

sliders = [
            {
                "pad": {"b": 10, "t": 60},
                "len": 0.9,
                "x": 0.1,
                "y": 0,
                "steps": [
                    {
                        "args": [[f.name], frame_args(0)],
                        "label": str(k),
                        "method": "animate",
                    }
                    for k, f in enumerate(fig.frames)
                ],
            }
        ]

# Layout
fig.update_layout(
         title='体积数据中的切片',
         width=600,
         height=600,
         scene=dict(
                    zaxis=dict(range=[-0.1, 6.8], autorange=False),
                    aspectratio=dict(x=1, y=1, z=1),
                    ),
         updatemenus = [
            {
                "buttons": [
                    {
                        "args": [None, frame_args(50)],
                        "label": "▶", # play symbol
                        "method": "animate",
                    },
                    {
                        "args": [[None], frame_args(0)],
                        "label": "◼", # pause symbol
                        "method": "animate",
                    },
                ],
                "direction": "left",
                "pad": {"r": 10, "t": 70},
                "type": "buttons",
                "x": 0.1,
                "y": 0,
            }
         ],
         sliders=sliders
)

fig.show()