一、VectorTile 层
我们现在知道如何加载切片图像,并且已经看到了加载和渲染矢量数据的不同方法。但是,如果我们能够拥有快速传输到浏览器的切片,并且可以动态样式化,那该多好啊?这就是矢量切片的用途。OpenLayers 通过 VectorTile 图层支持矢量切片。
注意:这里有很多瓦片和切片两个名称混用,都已相同的含义tile
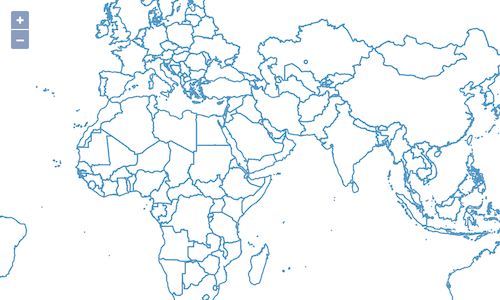
由矢量数据渲染的世界地图
我们将从 index.html 中与基础练习中相同的标签开始。
<!DOCTYPE html>
<html>
  <head>
    <meta charset="utf-8">
    <title>OpenLayers</title>
    <style>
      @import "node_modules/ol/ol.css";
    </style>
    <style>
      html, body, #map-container {
        margin: 0;
        height: 100%;
        width: 100%;
        font-family: sans-serif;
      }
    </style>
  </head>
  <body>
    <div id="map-container"></div>
    <script src="./main.js" type="module"></script>
  </body>
</html>
像往常一样,我们将 index.html 保存在workshop文件夹的根目录中。
对于该应用程序,我们将从 Workshop 文件夹根目录中的新 main.js 开始,并添加所需的导入:
import MVT from 'ol/format/MVT';
import VectorTileLayer from 'ol/layer/VectorTile';
import VectorTileSource from 'ol/source/VectorTile';
import {Map, View} from 'ol';
import {fromLonLat} from 'ol/proj';
- VectorTileLayer代表一个矢量瓦片图层,允许高效地显示大量地理数据。
- VectorTileSource代表矢量瓦片的源,用于提供瓦片数据。
- MVT格式模块,用于解析和处理MVT格式的数据。MVT(MapBox Vector Tile)
- fromLonLat 是一个用于将 WGS84 坐标(经度/纬度)转换为地图投影坐标的函数。
我们将使用来自 Natural Earth 数据的世界各国简易地图作为数据源,由 GeoServer 提供矢量切片服务。
我们要在此处创建的地图设置与我们在之前的练习中使用的相同:
const map = new Map({
  target: 'map-container',
  view: new View({
    center: fromLonLat([0, 0]),
    zoom: 2,
  }),
});
这次我们要使用的图层类型是 VectorTileLayer ,以及 VectorTileSource :
const layer = new VectorTileLayer({
  source: new VectorTileSource({
    format: new MVT(),
    url:
      'https://ahocevar.com/geoserver/gwc/service/tms/1.0.0/' +
      'ne:ne_10m_admin_0_countries@EPSG%3A900913@pbf/{z}/{x}/{-y}.pbf',
    maxZoom: 14,
  }),
});
map.addLayer(layer);
我们的数据源仅提供缩放级别 0 到 14 ,因此我们需要将此信息传递给源。矢量切片图层通常针对 512 像素的切片大小进行优化,这也是 VectorTile 源的切片网格的默认值。数据提供者要求我们显示一些 attributions ,我们也将其添加到源配置中。
VectorTileSource 与 VectorSource 一样配置了format和 URL。MVT 格式解析 Mapbox 矢量切片。与栅格瓦片一样,通过瓦片的缩放级别和 x、y 坐标来访问瓦片数据。因此,URL 包含了 {z} 占位符表示缩放级别,以及 {x} 和 {y} 占位符表示瓦片坐标。
http://localhost:5173/ 上的工作示例显示了一个无样式的矢量切片地图,如下所示:


094:素数回文095:活动安排096:合唱团](https://img-blog.csdnimg.cn/direct/f7384f757a4a4800bf884ac0d20cf1d2.png)
