QT 中的 Graphics View 系统. 是一个相对成熟的渲染引擎的上层框架,通常也可以会叫做 Scene - View。
通常会有 QGraphicsView, QGraphicsScene, QGraphicsItem 这几个类构成。
view是视口(viewport);scene是一个场景,负责容纳各种item;而item就是可见的这些元件。
一般来说,绘图可以使用 QPainter直接在重绘事件中进行绘制,但是,当我们想要选择绘制的图形的时候,就犯难了。我们的painter是直接在屏幕上写写画画,没有人来管理,在当前的mouse事件中也不知道如何处理这些项。
这个时候,Graphics View 就解决了这个问题,通过scene来管理各种图元item项。item在scene上绘制,scene在view上显示。
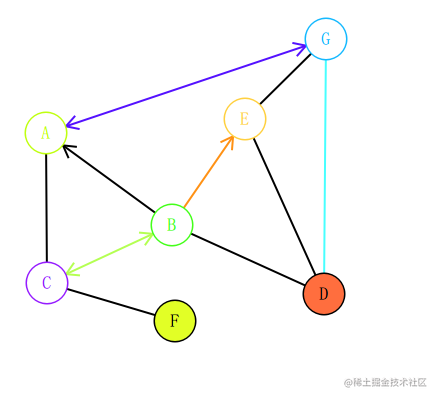
本文,就是利用Graphics View 系统来实现了一个简单的 有向图/无向图 编辑器。
编辑的图输出效果如下:
绘制点和绘制线是一个图元,那么就是一个 QGraphicsItem,继承自 QGraphicsItem,然后去重写绘制方法
在绘制点和线的时候,需要重写QGraphicsItem的绘制函数,也就是 paint(QPainter *painter, const QStyleOptionGraphicsItem *option, QWidget *widget)
如何绘制点
graphNode类的设计:
class graphNode : public QObject, public QGraphicsItem
{
    Q_OBJECT
public:
    graphNode(QPointF point, int r = 10, QString str = "0");

    // QGraphicsItem interface
public:
    QRectF boundingRect() const override;
    void paint(QPainter *painter, const QStyleOptionGraphicsItem *option, QWidget *widget) override;

    QPointF getPoint() const;
    int getR() const;
    void setR(int newR);
    const QString &getText() const;
    void setText(const QString &newText);
    const QColor &getFrontColor() const;
    void setFrontColor(const QColor &newFrontColor);
    const QColor &getBackColor() const;
    void setBackColor(const QColor &newBackColor);

    int getRoundWidth() const;
    void setRoundWidth(int newRoundWidth);

private:
    QPointF point;          // 绘制的初始点
    int r;                  // 半径
    QString text;           // 点的文字
    QColor frontColor;      // 前景色Ⅰ
    QColor backColor;       // 背景色Ⅰ
    int roundWidth;         // 圆的宽Ⅰ
};
在这个类中,我自定义了一些属性,方便配置点的颜色,大小等等。
核心还是在于paint函数,其余都是辅助功能
下面是paint函数的实现:
void graphNode::paint(QPainter *painter, const QStyleOptionGraphicsItem *option, QWidget *widget)
{
    QPen pen;
    pen.setWidth(roundWidth);

    painter->setRenderHint(QPainter::HighQualityAntialiasing);
    if (option->state & QStyle::State_Selected)
        pen.setColor(QColor((frontColor.red() + 125) % 255,
                            (frontColor.green() ) % 255,
                            (frontColor.blue() + 125) % 255)); // 选中时颜色变化
    else pen.setColor(frontColor);

    painter->setPen(pen);
    painter->drawEllipse(QRectF(point.x() - r, point.y() - r, r * 2, r * 2));


    QPainterPath path;
    path.addEllipse(QRectF(point.x() - r, point.y() - r, r * 2, r * 2));
    painter->fillPath(path, QBrush(backColor));


    painter->drawText(boundingRect(),
                      Qt::AlignHCenter |
                      Qt::AlignVCenter, text);

}
paint一共做了两件事情,第一件事情绘制一个圆,第二件事情就是绘制一个标识文字。
 其中的A就是标识文字
如何绘制线
graphLine类设计如下
class graphLine : public QObject, public QGraphicsLineItem
{
    Q_OBJECT

public:
    enum LineType {
        LeftToRight, // ==>
        RightToLeft, // <==
        TwoWayArrow, // <=>
        NoArrow,     // <=>
    };
    explicit graphLine(graphNode *begin,
                       graphNode *end,
                       LineType type = NoArrow,
                       QObject *parent = nullptr);
private:
    graphNode *begin;
    graphNode *end;
    int length;
    QColor color;
    LineType lineType;
private:
    void paintArrow(graphNode* begin, graphNode* end, QPainter* painter);

public:
    QPainterPath shape() const override;
    void paint(QPainter *painter, const QStyleOptionGraphicsItem *option, QWidget *widget) override;
    const QColor &getColor() const;
    void setColor(const QColor &newColor);
    LineType getLineType() const;
    void setLineType(LineType newType);
    graphNode *getBegin() const;
    graphNode *getEnd() const;
};
其中paintArrow用来绘制箭头
绘制线的线有两种,一种是不带箭头的,一种是带方向箭头的。
不带箭头
不带箭头的比较好绘制,计算一下起点和终点的坐标,画一条线就是。
    auto r_begin = begin->getPoint() + begin->pos();
    auto r_end = end->getPoint() + end->pos();
    QLineF lines(r_begin, r_end);
    setLine(lines);

    QPen pen;
    pen.setWidth(2);

    painter->setPen(pen);
    painter->setRenderHint(QPainter::HighQualityAntialiasing);
    painter->drawLine(line());
带箭头
绘制箭头可能需要一些计算,不过由于我们这里这个图形选择的圆,其实还是比较容易计算的。
如果是多边形,要麻烦一点。
在这里,我们想要的效果是箭头始终紧贴着其指向的圆。
比如这种效果:
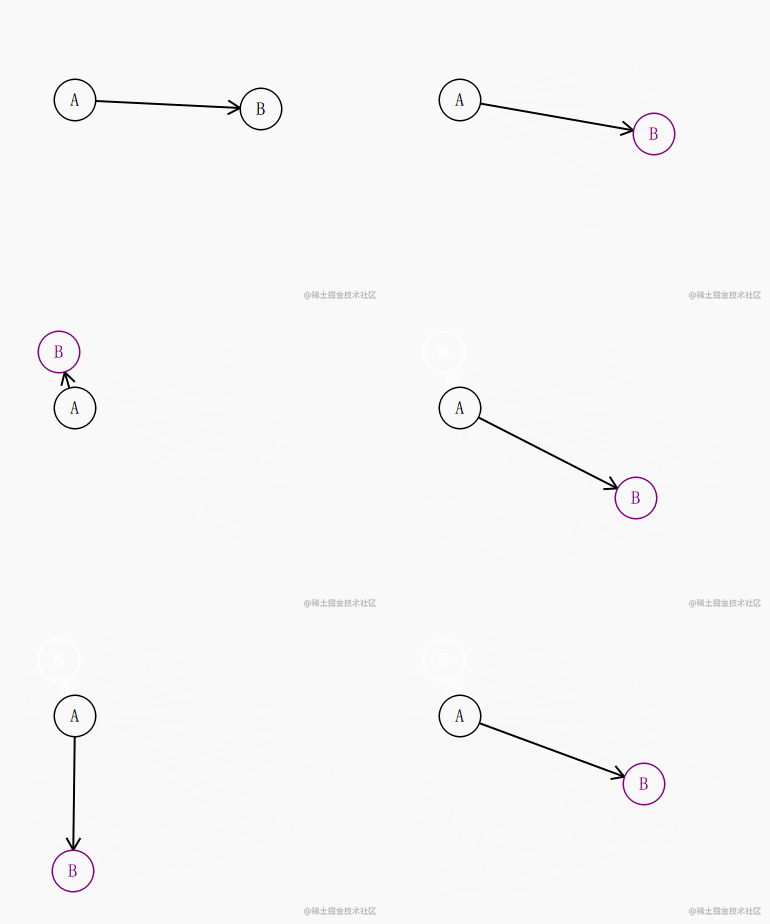
我们知道 起点 a 和 终点 b的坐标,知道圆的半径,其实就很容易的推导出 圆和这条直线的交点是多少了。
大概是这样:
点 a 坐标为 ( x 1 , y 1 ) , 点 b 坐标为 ( x 2 , y 2 ) 现在, a b 的距离 = ( x 2 − x 1 ) 2 + ( y 2 − y 1 ) 2 直线 a b 的斜率为 k = ( y 2 − y 1 ) / ( x 2 − x 1 ) 现在点 c ( x , y ) 在 a b 上,若与 a 的距离为 c 的话。则有: { ( x − x 1 ) 2 + ( y − y 1 ) 2 = c 2 ( y − y 1 ) / ( x − x 1 ) = k 点 a 已知,距离 c 已知,斜率 k 已知 联立方程可以解得: { x = ± c 1 + k 2 + x 1 y = ± c k 1 + k 2 + y 1 点 a 坐标为 (x_1, y_1), 点b坐标为(x_2, y_2) \\ 现在,a b的距离 = (x_2 - x_1)^2 +(y_2 - y_1)^2 \\ 直线 ab的斜率为 k = (y_2-y_1) / (x_2-x_1) \\ 现在点c(x, y)在ab上,若与a的距离为c的话。则有:\\ \begin{cases} (x - x_1)^2 +(y - y_1)^2 = c^2 \\ (y-y_1) / (x-x_1) = k \end{cases} 点a已知,距离c已知,斜率k已知 \\ 联立方程可以解得:\\ \begin{cases} x = \pm \frac{c}{\sqrt{1 + k^2}} +x_1\\ y = \pm \frac{c k}{\sqrt{1 + k^2}} +y_1 \end{cases} 点a坐标为(x1,y1),点b坐标为(x2,y2)现在,ab的距离=(x2−x1)2+(y2−y1)2直线ab的斜率为k=(y2−y1)/(x2−x1)现在点c(x,y)在ab上,若与a的距离为c的话。则有:{(x−x1)2+(y−y1)2=c2(y−y1)/(x−x1)=k点a已知,距离c已知,斜率k已知联立方程可以解得:{x=±1+k2c+x1y=±1+k2ck+y1
直线和圆相交的点圆两个,只有一个是合法的,这里只需要判断一下即可
bool __graphLine__containsLine(QPointF begin, QPointF end, QPointF now) {
    QLineF a(begin, end);
    QLineF b(begin, now);
    QLineF c(now, end);
    if (fabs(a.length() - b.length() - c.length()) < 1e-6) return true;
    return false;
}
计算出圆与直线的交点之后,绘制两根直线,分别向上和向下偏移30°来充当箭头即可。
void graphLine::paintArrow(graphNode* begin, graphNode* end, QPainter* painter)
{
    auto r_begin = begin->getPoint() + begin->pos();
    auto r_end = end->getPoint() + end->pos();
    QLineF lines(r_begin, r_end);
    auto length = end->getR() + end->getRoundWidth() / 2;
    // 宽度是内圈外圈各渲染一部分
    qreal dx, dy;
    if (fabs(lines.dx()) < 1e-6) {
        dx = 0;
        dy = length;
    } else {
        auto k = lines.dy() / lines.dx();
        qreal base = sqrt(k * k + 1);
        dx = length / base;
        dy = length * k / base;
    }

    QPointF dis(dx, dy);
    QPointF now;
    if (__graphLine__containsLine(r_begin, r_end, QPointF(r_end + dis))) {
        now = QPointF(r_end + dis);
    } else {
        now = QPointF(r_end - dis);
    }

    QLineF arrowHead(now, r_begin);
    arrowHead.setLength(10 + end->getRoundWidth());

    arrowHead.setAngle(arrowHead.angle() - 30); // 上方
    painter->drawLine(arrowHead);

    arrowHead.setAngle(arrowHead.angle() + 60); // 下方
    painter->drawLine(arrowHead);
}
知道如何绘制箭头之后,和绘制直线组合起来,就可以了;
paint完整代码
void graphLine::paint(QPainter *painter, const QStyleOptionGraphicsItem *option, QWidget *widget)
{
    auto r_begin = begin->getPoint() + begin->pos();
    auto r_end = end->getPoint() + end->pos();
    QLineF lines(r_begin, r_end);
    setLine(lines);

    QPen pen;
    pen.setWidth(2);

    if (isSelected())
    {
        pen.setColor(QColor((color.red() + 125) % 255,
                            (color.green() ) % 255,
                            (color.blue() + 125) % 255));
    }
    else
    {
        pen.setColor(color);
    }

    painter->setPen(pen);
    painter->setRenderHint(QPainter::HighQualityAntialiasing);
    painter->drawLine(line());
    switch (lineType) {
    case LeftToRight: paintArrow(begin, end, painter); break;
    case RightToLeft: paintArrow(end, begin, painter); break;
    case TwoWayArrow: paintArrow(begin, end, painter);
                      paintArrow(end, begin, painter); break;
    case NoArrow: ;
    default:;
    }
}
在这里,添加点我选择使用右键单击添加,连接点是选择两个点就自动添加一根线
这些处理将直接在 view类里面进行处理,因此,我自定义了一个graph类
class graph : public QGraphicsView
{
    Q_OBJECT
public:
    enum SelectItemMode {
        Line,
        Node,

        None = 10086,
    };
    explicit graph(QWidget *parent = nullptr);
    QList<graphLine*> Lines();
    QList<graphNode*> Nodes();
    void setMode(SelectItemMode);
private:
    SelectItemMode selectItemMode;
    QSet<graphLine*> graphLines;
    QSet<graphNode*> graphNodes;
    QHash<graphNode*, QSet<graphNode*>> graphMap;
private:
    void mouseLButtonClick(QMouseEvent *event);
    void mouseRButtonClick(QMouseEvent *event);
protected:
    void mousePressEvent(QMouseEvent *event) override;
    void mouseMoveEvent(QMouseEvent *event) override;
    void mouseReleaseEvent(QMouseEvent *event) override;
signals:
    void mouseClickEvent(QPoint point);
    void mouseMoveEvent(QPoint point);
    void selectItem(QGraphicsItem *);
    // QWidget interface
protected:
    void resizeEvent(QResizeEvent *event) override;
    void paintEvent(QPaintEvent *event) override;

private slots:
    void on_scene_select_change();
    void on_selection_change(QGraphicsItem *, QGraphicsItem *, Qt::FocusReason);
};
添加点
graph类重写 mousePressEvent 方法。
void graph::mousePressEvent(QMouseEvent *event)
{
    switch (event->button()) {
    case Qt::MouseButton::RightButton: mouseRButtonClick(event); break;
    default:
        QGraphicsView::mousePressEvent(event);
    }
}
然后在mouseRButtonClick中处理右键事件
void graph::mouseRButtonClick(QMouseEvent *event)
{
    auto pointScene = mapToScene(event->pos());
    auto item = new graphNode(pointScene, 20, QString("A")));
    item->setFlag(QGraphicsItem::ItemIsMovable, true);
    if (selectItemMode == Node) {
        item->setFlags( item->flags() |
                        QGraphicsItem::ItemIsFocusable |
                        QGraphicsItem::ItemIsSelectable);
    }

    scene()->addItem(item);
    graphNodes.insert(item);
}
添加线
添加线需要通过处理 selectionChanged
connect(scene(), SIGNAL(selectionChanged()), this, SLOT(on_scene_select_change()));
当选择的item为2时,则连接一条直线
void graph::on_scene_select_change()
{   // mode select graphNode
    auto list = scene()->selectedItems();

    if (selectItemMode == Node)
    {
        static decltype(list) old_list;
        if (list.size() > 2) {
            scene()->clearSelection();
            return;
        }
        if (list.size() == 2) {
            auto a{dynamic_cast<graphNode*>(list[0])},
            b{dynamic_cast<graphNode*>(list[1])};
            if (old_list[0] != list[0]) std::swap(a, b);
            if (graphMap[a].contains(b)) return; // 两点之间有线不需要连接Ⅰ
            graphMap[a].insert(b);
            graphMap[b].insert(a);
            auto now = new graphLine(a, b);

            if (selectItemMode == Line) {
                now->setFlags( now->flags() |
                               QGraphicsItem::ItemIsFocusable |
                               QGraphicsItem::ItemIsSelectable);
            }
            scene()->addItem(now);
            graphLines.insert(now);
        }
        old_list = list;
    }
    else if (selectItemMode == Line) {
        if (list.size() > 1) {
            scene()->clearSelection();
            return;
        }
    }
    auto item = scene()->mouseGrabberItem();
    emit selectItem(item);
}
到这里,基本上,核心的东西就完成了,剩下的是ui界面了。
我的ui界面比较丑,大概长这样:
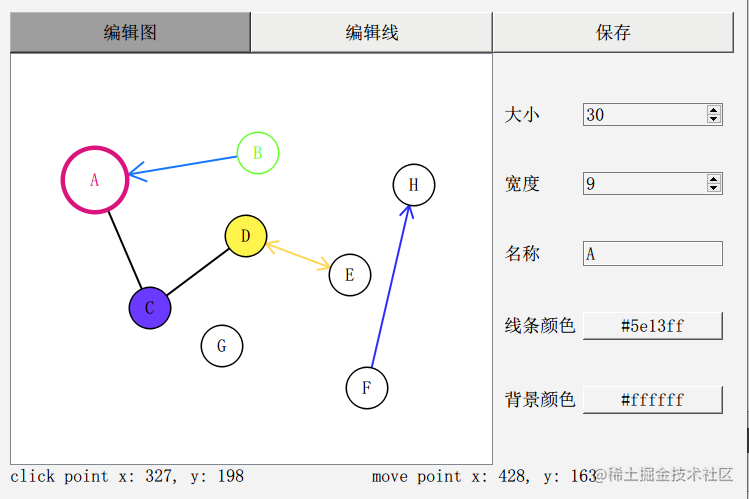
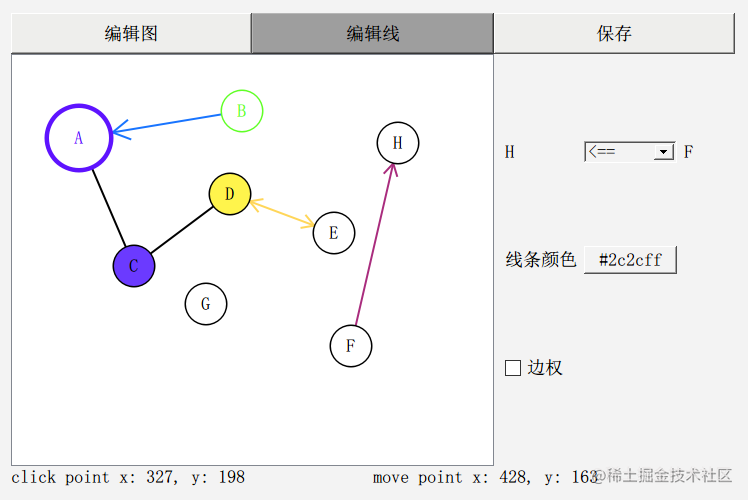
这就是一个最基本的 图 编辑器了
{来自 amjieker }


