1.matplotlib介绍
一个2D绘图库;

2.Pandas介绍:
Pandas一个分析结构化数据的工具;

3.NumPy
一个处理n纬数组的包;
4.实践:绘图matplotlip
figure()生成一个图像实例
%matplotlib inline:图形直接在控制台展示出来
xlabel(‘’):横坐标
plot():图像绘制

from matplotlib import pyplot as plt
import numpy as np

# 1. 生成 x 轴数据,从 0 到 2π,步长为 30°
x = np.arange(0, 2 * np.pi, np.pi / 6)
# 2. 计算正弦函数值
y = np.sin(x)
# 3. 创建新的窗口实例
plt.figure(figsize=(5, 5))
# 4. 绘制正弦曲线,设置了一个标签 label='sin(x)'
plt.plot(x, y, label='sin(x)show', color='blue', linewidth=1)
plt.xlabel('x (π)')
plt.ylabel('sin(x)')
# 5. 绘制网格线
plt.grid(True)
# 6. 添加图例,帮助将标签显示为图例
plt.legend()
plt.show()

散点图:
**scatter():**散点图的生成

from matplotlib import pyplot as plt
import numpy as np

# 1.设置随机数生成种子,以保证每次运行生成的随机数相同
np.random.seed(0)
# 2.生成100个x轴坐标
x = np.random.randn(100)
# 3.生成100个y轴坐标
y = np.random.randn(100)
# 4.创建一个新的图形窗口,设置大小尺寸
plt.figure(figsize=(6, 6))
plt.scatter(x, y, color='blue', label='Random Data')
# 5.设置 x 轴标签
plt.xlabel('X')
# 设置 y 轴标签
plt.ylabel('Y')
# 6.设置图形标题
plt.title('Scatter Plot Demo')
# 7.打开网格线
plt.grid(True)
# 8.添加图例,显示标签为'Random Data'的图例
plt.legend()
# 9.展示图形
plt.show()

5.numpy绘图
1.生成数组:

2.基于数组的运算:
- 生成一个5行5列的数组,且值为1:
np.ones([5,5])

- 基于ab数组的运算:


6.pandas的使用
强大之处在于读取文件,可以基于文件数据生成具体图像
常用函数:
from pandas as pd
import matplotlib.pyplot as plt

pd.read_csv() // 利用pandas读取csv文件
ax=plt.subplots(figsize=(10,10)) //利用matplotlib的subplot方法创建图像
ax.plot(data['year'],data['dp'],color='blue',linestyle='-',marker='0',label='dp') //绘制折线图,linestyle为实线,marker为节点类型

ax.set_title() //添加标题
ax.set_xlabel() //x标题
# 设置 x 轴刻度间隔
ax.set_xticks(data['year'])
ax.grid(True) //设置网格线
plt.tight_layout() //利用matplotlib的tight_layout自动调整布局
plt.show()
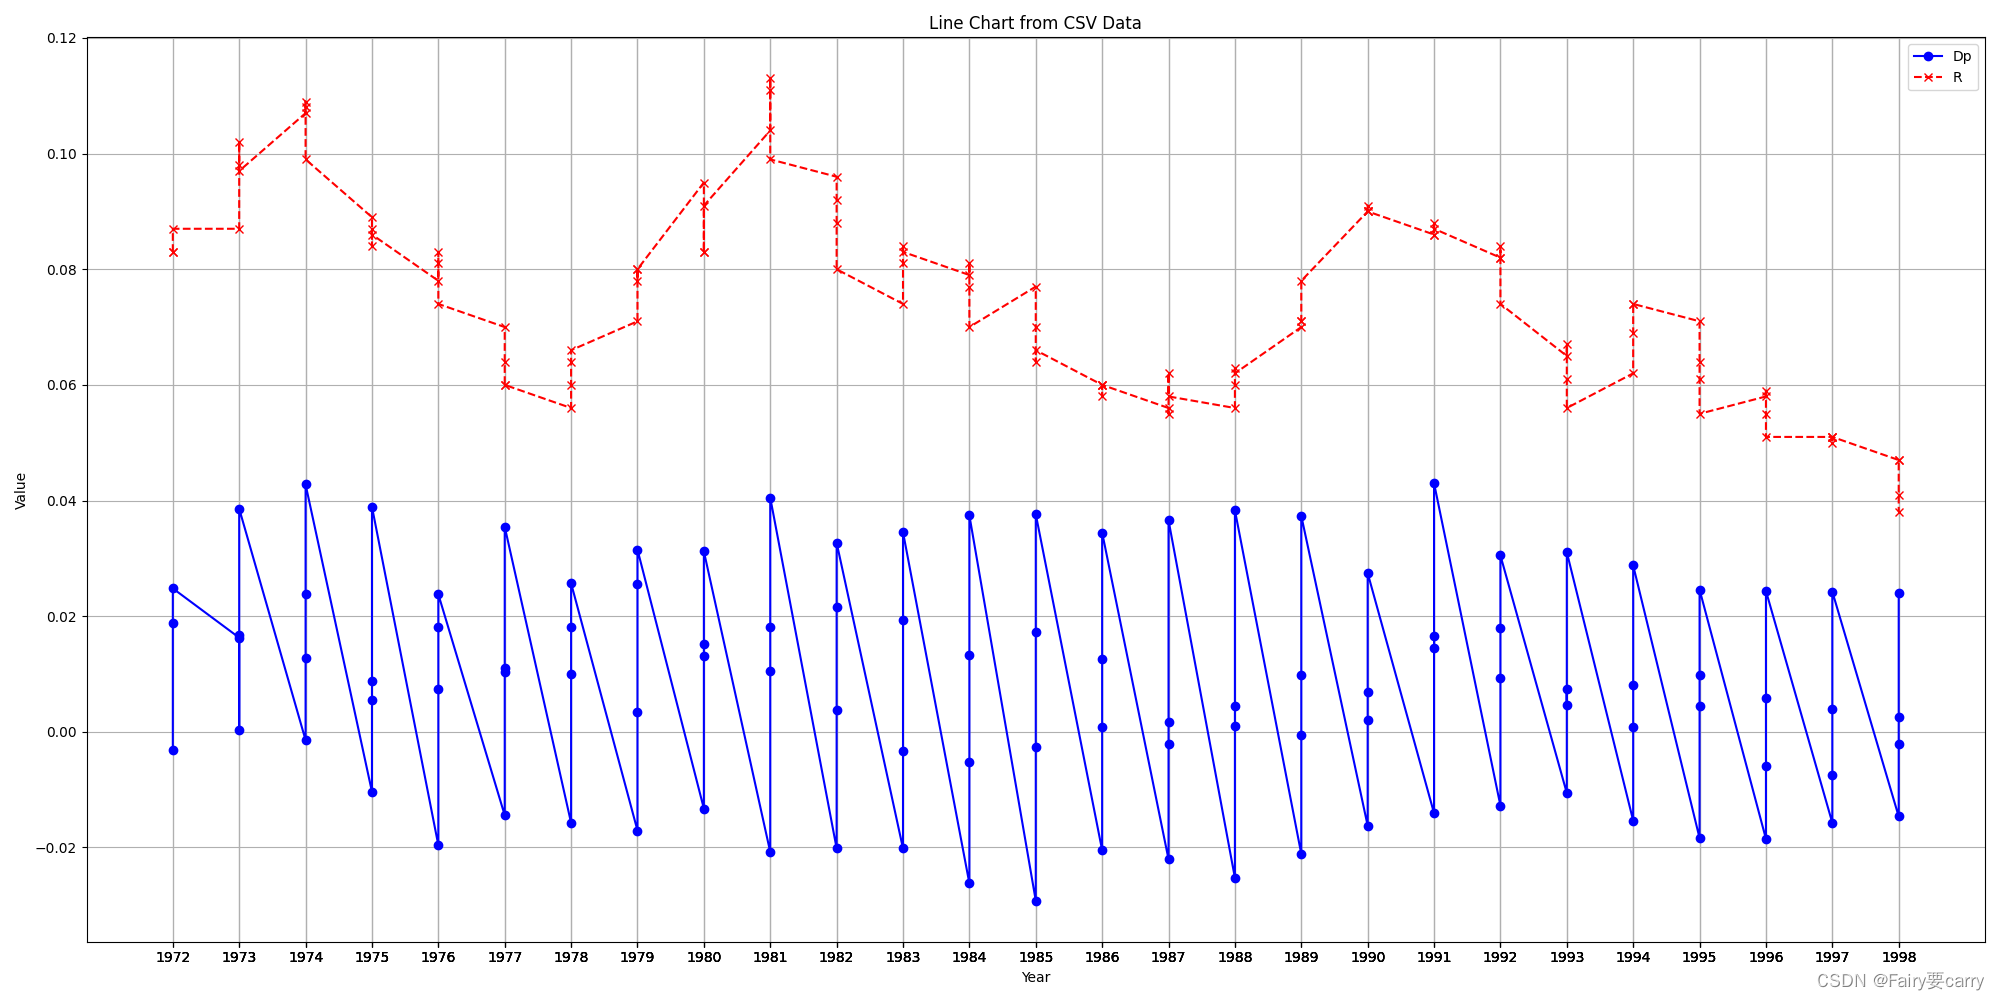
import pandas as pd
from matplotlib import pyplot as plt

# 1.读取 CSV 文件到 Pandas DataFrame
data = pd.read_csv('D:/pythonDATA/E6.csv')
# 2.查看数据的前几行
print(data.head())
# 3.创建图形和子图
fig, ax = plt.subplots(figsize=(20, 10))
# 4.绘制折线图,x 轴为年份,y 轴为 Dp 值,颜色为蓝色,线型为实线,设置标签为'Dp'
ax.plot(data['year'], data['Dp'], color='blue', linestyle='-', marker='o', label='Dp')
# 5.绘制折线图,x 轴为年份,y 轴为 R 值,颜色为红色,线型为虚线,设置标签为'R'
ax.plot(data['year'], data['R'], color='red', linestyle='--', marker='x', label='R')
# 6.添加标题和标签
ax.set_title('Line Chart from CSV Data')
ax.set_xlabel('Year')
ax.set_ylabel('Value')
# 7.设置 x 轴刻度间隔
ax.set_xticks(data['year'])
# 8.显示网格线
ax.grid(True)
# 9.添加图例
ax.legend()
# 10.自动调整布局
plt.tight_layout()
# 显示图形
plt.show()
