前言
系列专栏:【机器学习:项目实战100+】【2024】✨︎
在本专栏中不仅包含一些适合初学者的最新机器学习项目,每个项目都处理一组不同的问题,包括监督和无监督学习、分类、回归和聚类,而且涉及创建深度学习模型、处理非结构化数据以及指导复杂的模型,如卷积神经网络、门控循环单元、大型语言模型和强化学习模型
预测是使用过去的值和许多其他因素来预测未来的值。在本文中,我们将使用 Keras 功能 API 创建一个销售预测模型。
目录
- 1. 相关库和数据集
- 1.1 相关库介绍
- 1.2 数据集介绍
- 2.数据处理
- 2.2.1 数据预处理
- 2.2.2 数据预处理
- 3. 数据建模(LSTM)
- 3.1 数据准备
- 3.2 使用 RMSprop 编译模型
- 3.3 拟合模型
- 3.4 模型评估
1. 相关库和数据集
1.1 相关库介绍
Python 库使我们能够非常轻松地处理数据并使用一行代码执行典型和复杂的任务。
Pandas– 该库有助于以 2D 数组格式加载数据框,并具有多种功能,可一次性执行分析任务。Numpy– Numpy 数组速度非常快,可以在很短的时间内执行大型计算。Matplotlib/Seaborn– 此库用于绘制可视化效果,用于展现数据之间的相互关系。Keras– 是一个由Python编写的开源人工神经网络库,可以作为Tensorflow、Microsoft-CNTK和Theano的高阶应用程序接口。
import pandas as pd                     # to extract data from dataset(.csv file)
import csv                              #used to read and write to csv files
import numpy as np                      #used to convert input into numpy arrays to be fed to the model
import matplotlib.pyplot as plt         #to plot/visualize sales data and sales forecasting
import tensorflow as tf                 # acts as the framework upon which this model is built
from tensorflow import keras            #defines layers and functions in the model
from tensorflow.keras.models import Model
from tensorflow.keras.layers import Input, Dense,LSTM,Flatten
from tensorflow.keras.layers import concatenate
#here the csv file has been copied into three lists to allow better availability
list_row,date,traffic = get_data('/home/abh/Documents/Python/Untitled Folder/Sales_dataset')
外部库的使用已经保持在最低限度,以提供一个更简单的界面,您可以用已经存在于已建立的库中的函数替换本教程中使用的函数。
1.2 数据集介绍
它使用过去的销售额、季节性、节日、经济状况等数据来确定当前或未来的销售额。所以,这个模型在提供了一定的输入后,会预测某一天的销售额。
5 年销售数据原始数据集:
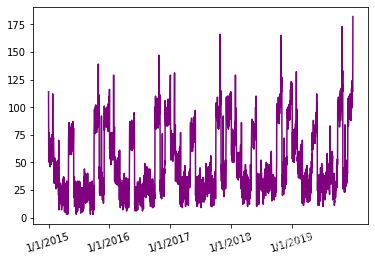
2015 年 1 月至 2019 年 12 月的销售数据
如您所见,销售数据似乎每年都遵循类似的模式,峰值销售值似乎在 5 年的时间框架内随着时间的推移而增加。在这 5 年的时间框架内,前 4 年将用于训练模型,最后一年将用作测试集。现在,一些辅助函数用于处理数据集和创建所需形状和大小的输入。它们如下:
get _ data–用于使用指向数据集位置的路径加载数据集。date _ to _day–提供每天的日期。例如,2/2/16 是星期六,9/5/15 是星期一。date _ to _enc–将数据编码成一个热点向量,这为模型提供了更好的学习机会。
这里无法解释这些函数和一些其他函数的所有属性,因为这会花费太多时间。
2.数据处理
首先,所有输入都经过预处理,以便机器能够理解。这是一个基于监督学习的线性回归模型,因此输出将与输入一起提供。然后,输入连同期望的输出一起被馈送到模型。该模型将绘制(学习)输入和输出之间的关系(函数)。然后,该函数或关系用于预测特定输入集的输出。在这种情况下,像日期和以前的销售额这样的输入参数被标记为输入,销售额被标记为输出。该模型将预测 0 到 1 之间的一个数字,因为 sigmoid 函数用于最后一层。这个输出可以乘以一个特定的数字(在这种情况下是最大销售额),这将是我们某一天对应的销售额。然后,该输出作为输入提供,以计算第二天的销售数据。这一系列步骤将持续到某一天到来。
2.2.1 数据预处理
最初,数据集只有两列:日期和流量(销售额)。
在添加不同的列并对值进行处理/标准化之后,数据包含了所有这些值。
- 日期
- 交通
- 假期与否
- 一天
所有这些参数都必须转换成机器可以理解的形式,这将使用下面的这个函数来完成。
它不是将日期、月份和年份作为一个单独的实体,而是被分成三个不同的输入。原因是这些输入中的年份参数在大多数情况下是相同的,这将导致模型变得自满,即它将开始过度拟合当前数据集。为了增加不同输入之间的可变性,日期和月份被分别标记。下面的函数转换()将创建六个列表,并向它们追加适当的输入。这就是 2015 年到 2019 年的编码
{2015:数组([1。, 0., 0., 0., 0.],dtype=float32),2016: array([0。, 1., 0., 0., 0.],dtype=float32),2017: array([0。, 0., 1., 0., 0.],dtype=float32),2018: array([0。, 0., 0., 1., 0.],dtype=float32),2019: array([0。, 0., 0., 0., 1.],dtype=float32)
每一个都是长度为 5 的 NumPy 数组,1 和 0 表示它的值
def conversion(week,days,months,years,list_row):
  #lists have been defined to hold different inputs
  inp_day = []
  inp_mon = []
  inp_year = []
  inp_week=[]
  inp_hol=[]
  out = []
  #converts the days of a week(monday,sunday,etc.) into one hot vectors and stores them as a dictionary
  week1 = number_to_one_hot(week)
  #list_row contains primary inputs
  for row in list_row:
        #Filter out date from list_row
        d = row[0]
        #the date was split into three values date, month and year.
        d_split=d.split('/')
        if d_split[2]==str(year_all[0]):
          #prevents use of the first year data to ensure each input contains previous year data as well.
          continue
        #encode the three parameters of date into one hot vectors using date_to_enc function.
        d1,m1,y1 = date_to_enc(d,days,months,years) #days, months and years and dictionaries containing the one hot encoding of each date,month and year.
        inp_day.append(d1) #append date into date input
        inp_mon.append(m1) #append month into month input
        inp_year.append(y1) #append year into year input
        week2 = week1[row[3]] #the day column from list_is converted into its one-hot representation and saved into week2 variable
        inp_week.append(week2)# it is now appended into week input.
        inp_hol.append([row[2]])#specifies whether the day is a holiday or not
        t1 = row[1] #row[1] contains the traffic/sales value for a specific date
        out.append(t1) #append t1(traffic value) into a list out
  return inp_day,inp_mon,inp_year,inp_week,inp_hol,out #all the processed inputs are returned

inp_day,inp_mon,inp_year,inp_week,inp_hol,out = conversion(week,days,months,years,list_train)
#all of the inputs must be converted into numpy arrays to be fed into the model
inp_day = np.array(inp_day)
inp_mon = np.array(inp_mon)
inp_year = np.array(inp_year)
inp_week = np.array(inp_week)
inp_hol = np.array(inp_hol)
我们现在将处理一些剩余的其他输入,使用所有这些参数背后的原因是为了提高模型的效率,您可以尝试移除或添加一些输入。
过去七天的销售数据被作为输入传递,以创建销售数据的趋势,这将使预测值不会完全随机。同样,前一年当天的销售数据也被提供。
以下函数(other_inputs)处理三个输入:
- 过去七天的销售数据
- 上一年同一天的销售数据
- 季节性——季节性被添加到夏季销售等趋势中。
2.2.2 数据预处理
def other_inputs(season,list_row):
  #lists to hold all the inputs
  inp7=[]
  inp_prev=[]
  inp_sess=[]
  count=0 #count variable will be used to keep track of the index of current row in order to access the traffic values of past seven days.
  for row in list_row:
    ind = count
    count=count+1
    d = row[0] #date was copied to variable d
    d_split=d.split('/')
    if d_split[2]==str(year_all[0]):
      #preventing use of the first year in the data
      continue
    sess = cur_season(season,d) #assigning a season to to the current date
    inp_sess.append(sess) #appending sess variable to an input list
    t7=[] #temporary list to hold seven sales value
    t_prev=[] #temporary list to hold the previous year sales value
    t_prev.append(list_row[ind-365][1]) #accessing the sales value from one year back and appending them
    for j in range(0,7):
        t7.append(list_row[ind-j-1][1]) #appending the last seven days sales value
    inp7.append(t7)
    inp_prev.append(t_prev)
  return inp7,inp_prev,inp_sess

inp7,inp_prev,inp_sess = other_inputs(season,list_train)
inp7 = np.array(inp7)
inp7= inp7.reshape(inp7.shape[0],inp7.shape[1],1)
inp_prev = np.array(inp_prev)
inp_sess = np.array(inp_sess)
这么多输入背后的原因是,如果将所有这些组合成一个数组,它将具有不同长度的不同行或列。这样的数组不能作为输入。
将所有值线性排列在单个数组中会导致模型具有高损耗。
线性排列将导致模型一般化,因为连续输入之间的差异不会太大,这将导致有限的学习,降低模型的准确性。
3. 数据建模(LSTM)
3.1 数据准备
八个独立的输入被处理并连接成一个单独的层,并传递给模型。
最终输入如下:
- 日期
- 月
- 年
- 一天
- 前七天销售额
- 上一年的销售额
- 季节
- 假期与否
在这里的大部分图层中,我已经使用了 5 个单位作为输出形状,你可以进一步用它来实验,以提高模型的效率。
#an Input variable is made from every input array
input_day = Input(shape=(inp_day.shape[1],),name = 'input_day')
input_mon = Input(shape=(inp_mon.shape[1],),name = 'input_mon')
input_year = Input(shape=(inp_year.shape[1],),name = 'input_year')
input_week = Input(shape=(inp_week.shape[1],),name = 'input_week')
input_hol = Input(shape=(inp_hol.shape[1],),name = 'input_hol')
input_day7 = Input(shape=(inp7.shape[1],inp7.shape[2]),name = 'input_day7')
input_day_prev = Input(shape=(inp_prev.shape[1],),name = 'input_day_prev')
input_day_sess = Input(shape=(inp_sess.shape[1],),name = 'input_day_sess')
# The model is quite straight-forward, all inputs were inserted into a dense layer with 5 units and 'relu' as activation function
x1 = Dense(5, activation='relu')(input_day)
x2 = Dense(5, activation='relu')(input_mon)
x3 = Dense(5, activation='relu')(input_year)
x4 = Dense(5, activation='relu')(input_week)
x5 = Dense(5, activation='relu')(input_hol)
x_6 = Dense(5, activation='relu')(input_day7)
x__6 = LSTM(5,return_sequences=True)(x_6) # LSTM is used to remember the importance of each day from the seven days data
x6 = Flatten()(x__10) # done to make the shape compatible to other inputs as LSTM outputs a three dimensional tensor
x7 = Dense(5, activation='relu')(input_day_prev)
x8 = Dense(5, activation='relu')(input_day_sess)
c = concatenate([x1,x2,x3,x4,x5,x6,x7,x8]) # all inputs are concatenated into one
layer1 = Dense(64,activation='relu')(c)
outputs = Dense(1, activation='sigmoid')(layer1) # a single output is produced with value ranging between 0-1.
# now the model is initialized and created as well
model = Model(inputs=[input_day,input_mon,input_year,input_week,input_hol,input_day7,input_day_prev,input_day_sess], outputs=outputs)
model.summary() # used to draw a summary(diagram) of the model

3.2 使用 RMSprop 编译模型
RMSprop 非常擅长处理随机分布,因此在这里使用它。
from tensorflow.keras.optimizers import RMSprop

model.compile(loss=['mean_squared_error'],
              optimizer = 'adam',
              metrics = ['acc'] #while accuracy is used as a metrics here it will remain zero as this is no classification model
              )                  # linear regression models are best gauged by their loss value
3.3 拟合模型
该模型现在将被输入和输出数据,这是最后一步,现在我们的模型将能够预测销售数据。
history = model.fit(
           x = [inp_day,inp_mon,inp_year,inp_week,inp_hol,inp7,inp_prev,inp_sess],
           y = out,
           batch_size=16,
           steps_per_epoch=50,
           epochs = 15,
           verbose=1,
           shuffle =False
           )
#all the inputs were fed into the model and the training was completed

现在,为了测试模型,input()接受输入并将其转换为适当的形式:
def input(date):
    d1,d2,d3 = date_to_enc(date,days,months,years)   #separate date into three parameters
    print('date=',date)
    d1 = np.array([d1])
    d2 = np.array([d2])
    d3 = np.array([d3])
    week1 = number_to_one_hot(week)        #defining one hot vector to encode days of a week
    week2 = week1[day[date]]
    week2=np.array([week2])
    //appeding a column for holiday(0-not holiday, 1- holiday)
    if date in holiday:
        h=1
        #print('holiday')
    else:
        h=0
        #print("no holiday")
    h = np.array([h])
    sess = cur_season(season,date)        #getting seasonality data from cur_season function
    sess = np.array([sess])
    return d1,d2,d3,week2,h,sess
预测销售数据不是我们来这里的目的,所以我们还是继续预测工作吧。
销售预测
定义预测 _ 测试功能,预测提供日期后一年的销售数据:
该功能的工作原理如下:
- 需要输入一个日期来预测从一年前到上述日期的销售数据
- 然后,我们访问前一年当天的销售数据和前 7 天的销售数据。
- 然后,使用这些作为输入,预测新的值,然后在七天值中,第一天被移除,并且预测的输出被添加作为下一次预测的输入
我们要求预测到 2019 年 12 月 31 日为止的一年
- 首先,记录了 2018 年 12 月 31 日(一年前)的日期,以及从(2018 年 12 月 25 日–2018 年 12 月 31 日)开始的七天销售
- 然后收集一年前,即 2017 年 12 月 31 日的销售数据
- 将这些数据作为其他数据的输入,预测第一个销售数据(即 1/1/2019)
- 然后删除 2018 年 12 月 24 日的销售数据,添加 2019 年 1 月 1 日的预测销售额。如此循环,直到预测出 2019 年 12 月 31 日的销售数据。
所以,以前的输出作为输入。
def forecast_testing(date):
    maxj = max(traffic) # determines the maximum sales value in order to normalize or return the data to its original form
    out=[]
    count=-1
    ind=0
    for i in list_row:
        count =count+1
        if i[0]==date: #identify the index of the data in list
            ind = count
    t7=[]
    t_prev=[]
    t_prev.append(list_row[ind-365][1]) #previous year data
    # for the first input, sales data of last seven days will be taken from training data
    for j in range(0,7):
          t7.append(list_row[ind-j-365][1])
    result=[] # list to store the output and values
    count=0
    for i in list_date[ind-364:ind+2]:
        d1,d2,d3,week2,h,sess = input(i) # using input function to process input values into numpy arrays
        t_7 = np.array([t7]) # converting the data into a numpy array
        t_7 = t_7.reshape(1,7,1)
        # extracting and processing the previous year sales value
        t_prev=[]
        t_prev.append(list_row[ind-730+count][1])
        t_prev = np.array([t_prev])
        #predicting value for output
        y_out = model.predict([d1,d2,d3,week2,h,t_7,t_prev,sess])
        #output and multiply the max value to the output value to increase its range from 0-1
        print(y_out[0][0]*maxj)
        t7.pop(0) #delete the first value from the last seven days value
        t7.append(y_out[0][0]) # append the output as input for the seven days data
        result.append(y_out[0][0]*maxj) # append the output value to the result list
        count=count+1
    return result
运行预测测试功能,将返回包含该年所有销售数据的列表,结果=预测 _ 测试(’ 2019 年 12 月 31 日’,日期)
3.4 模型评估
预测值和实际值的图表,用于测试模型的性能
plt.plot(result,color='red',label='predicted')
plt.plot(test_sales,color='purple',label="actual")
plt.xlabel("Date")
plt.ylabel("Sales")
leg = plt.legend()
plt.show()


2019 年 1 月 1 日至 2019 年 12 月 31 日的实际值

预测值和实际值之间的比较
如你所见,预测值和实际值非常接近,这证明了我们模型的有效性。如果上述文章中有任何错误或改进的可能性,请随时在评论部分提及。