1.折线图表
首先引入相关包pyecharts,如果没下载可以先下载
pip install pyecharts
from pyecharts.charts import Line


line = Line()
# 添加x轴
line.add_xaxis(['呱了个呱','羊村','牟多','蜂地','喵帕斯'])
# 添加y轴
line.add_yaxis("GDP",['50','30','40','34','63','22'])

# 生成图表
line.render()
程序运行,在项目根目录生成了一个render.html文件,打开它,就能看到表格了


接下来再学习一些常用的全局设置参数
引入新的包
from pyecharts.options import TitleOpts,LegendOpts,ToolboxOpts,VisualMapOpts,LabelOpts
在line.render()生成表格之前配置全局配置才能生效
# 设置全局变量
line.set_global_opts(
    title_opts=TitleOpts(title="该图表为GDP展示",pos_left="center",pos_bottom="1%"), #设置标题,居中,并置于距离底部1%的位置
    legend_opts=LegendOpts(is_show=True),   #似乎是数据线条的分类
    toolbox_opts=ToolboxOpts(is_show=True),     #工具箱设置,True为打开
    visualmap_opts=VisualMapOpts(is_show=True)      #虚拟图例设置,True为打开
)
运行结果:

2.地图数据可视化
老规矩一样需要引入包
from pyecharts.charts import Map

# 定义地图对象
map = Map()

# 配置地图的数据(省市是否需要在不同版本的python下要求不一样,建议加上省市)
data = [("北京市",199),
        ("上海市",344),
        ("湖南省",1255),
        ("台湾省",341),
        ("广东省",5234),
        ("海南省",242),
        ("江苏省",3548),
        ("福建省",5872),
        ("湖北省",2345),]

# 添加数据
map.add("测试地图",data,"china")

map.render()其中map.add()方法下,第一个参数是表格的名称,第二个参数是数据源,第三个则是使用哪国地图,默认是china(必须要求和数据源给的省市要对的上,例如如果你不写china,而改成其他国家是不会生成地图的,另外国家名也必须以小写字母开头,或者你还可以写成省,就会变成省单位的地图,当然,数据源也需要修改)
运行结果,地图可以放大,这样文字看起来就不会过于拥挤,下图为原始模样,可以看到,将鼠标置于湖南省上悬浮,可以看到对应的参数

当然这样的图表并不能很好地呈现数据,接下来对其进行一些全局配置,使其能够变成给人类能方便阅读的模样
老规矩引入包,将全局配置写在map.render()前才能生效
from pyecharts.options import TitleOpts,LegendOpts,ToolboxOpts,VisualMapOpts,LabelOpts
# 设置全局选项
map.set_global_opts(
        title_opts=TitleOpts(title="测试数据",is_show=True),
        visualmap_opts=VisualMapOpts(
                is_show=True,
                is_piecewise=True, #开启自定义校准数据样式
                pieces=[
                        {"min":0,"max":300,"label":"0-100","color":"#CCFFFF"},
                        {"min":301,"max":500,"label":"301-500","color":"#4EEE94"},
                        {"min":501,"max":1000,"label":"501-1000","color":"#AFEEEE"},
                        {"min":1001,"max":3000,"label":"1001-3000","color":"#FFD700"},
                        {"min":3001,"max":10000,"label":"3001-10000","color":"#FF3030"},
                ])
)
设置中设置了图表标题,图例设置为开启,并进一步对图例进行自定义设置(键值对)
“min”代表最小值,“max”代表最大值(当数据在这区间内,就会执行后面的效果,比如说定义的color)
“label”表示图例的标签,是给人看的,下图左下角那个就是label模块
“color”则表示处于这个数据区间的改用什么颜色来填充
运行结果,这样至少好看了点

3.柱状图
3.1常规柱状图
老规矩,导包
from pyecharts.charts import Bar
其他的跟折线图基本没大有差异
from pyecharts.charts import Bar

# 创建表格对象
bar = Bar()

# 定义x,y轴数据
bar.add_xaxis(['羊村','喵帕斯','牟多'])
bar.add_yaxis("GDP",[324,634,425])

# 将x,y轴数据反转
bar.reversal_axis()

# 创建表格
bar.render()
运行结果:

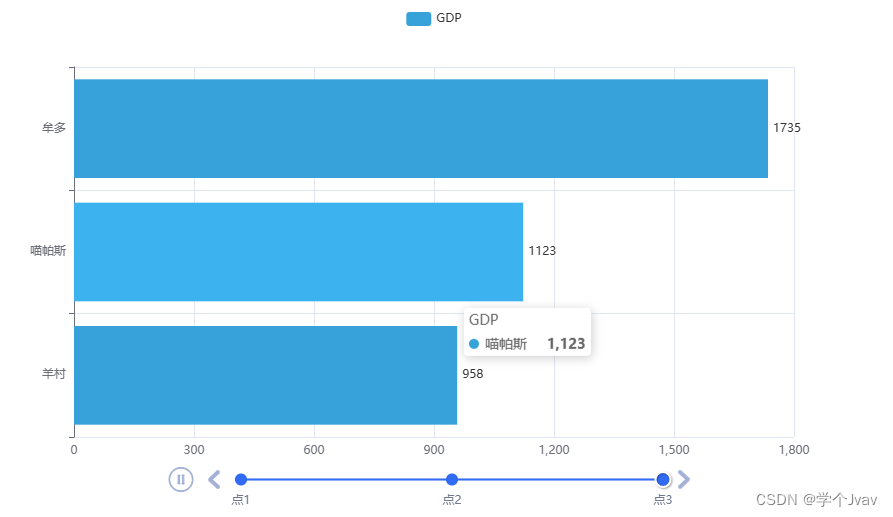
3.1基于时间线柱状图
导包
from pyecharts.charts import Bar,Timeline
from pyecharts.globals import ThemeType
额外引入了主题包,不需要的可以不用导入
跟基础柱状图差不多,就是生成了多张表,然后通过时间轴来播放
from pyecharts.charts import Bar,Timeline
from pyecharts.globals import ThemeType
from pyecharts.options import TitleOpts,LegendOpts,ToolboxOpts,VisualMapOpts,LabelOpts

# 创建表格对象1
bar1 = Bar()
bar1.add_xaxis(['羊村','喵帕斯','牟多'])
bar1.add_yaxis("GDP",[324,634,425],label_opts=LabelOpts(position="right"))
bar1.reversal_axis()
# 创建表格对象2
bar2 = Bar()
bar2.add_xaxis(['羊村','喵帕斯','牟多'])
bar2.add_yaxis("GDP",[673,823,729],label_opts=LabelOpts(position="right"))
bar2.reversal_axis()
# 创建表格对象3
bar3 = Bar()
bar3.add_xaxis(['羊村','喵帕斯','牟多'])
bar3.add_yaxis("GDP",[958,1123,1735],label_opts=LabelOpts(position="right"))
bar3.reversal_axis()

# 构建时间线对象
timeLine = Timeline({"theme":ThemeType.LIGHT})
# 在时间线内添加柱状图对象
timeLine.add(bar1,"点1")
timeLine.add(bar2,"点2")
timeLine.add(bar3,"点3")

# 自动播放配置
timeLine.add_schema(
    play_interval=1000,     #自动播放时间间隔,单位毫秒
    is_timeline_show=True,
    is_auto_play=True,
    is_loop_play=True
)
# 通过时间线来制作表格,而不再是bar123对象
timeLine.render("时间线柱状图.html")
add_schema()方法参数的意思是:
play_interval=1000,     #自动播放时间间隔,单位毫秒
is_timeline_show=True,     #是否显示时间线
is_auto_play=True,        #是否自动播放
is_loop_play=True        #是否循环播放
主题参数:

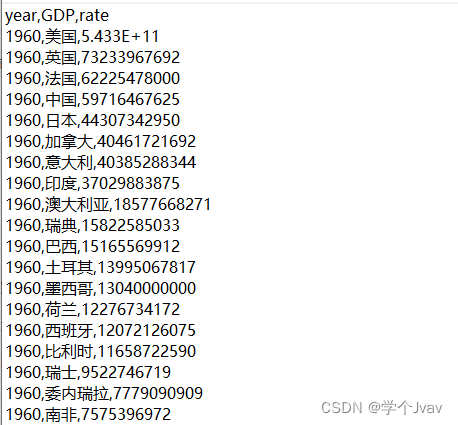
练习——绘制1960年至2019年世界各国GDP前八名柱状动图
太难了,我自己都搞不懂,直接上代码吧,消化了再做解析
以下是csv部分数据
from pyecharts.charts import Bar,Timeline
from pyecharts.options import LabelOpts,global_options,TitleOpts
from pyecharts.globals import ThemeType

f = open("data/1960-2019全球GDP数据.csv",encoding="GB2312")
data_line = f.readlines()
# 删除csv文件中第一行无用内容
data_line.pop(0)

# 定义字典对象
data_dict = {}
timeLine = Timeline({"theme":ThemeType.LIGHT})
#从下面开始降回比较难以理解
for line in data_line:
    year = int(line.split(",")[0])
    country = str(line.split(",")[1])
    gdp = float(line.split(",")[2])
    #判断字典中key是否是空的(因为一开始字典里是没有key的,如果强行获取key会报错)
    try:
        data_dict[year].append([country,gdp])
    except KeyError:
        data_dict[year] = []
        data_dict[year].append([country,gdp])

# sorted_year_list = sorted(data_dict.keys())
# print(type(sorted_year_list))
# print(sorted_year_list)
# print(type(data_dict.keys()))
# print(data_dict.keys())
for year in data_dict.keys():
    data_dict[year].sort(key=lambda element: element[1],reverse=True)
    #取出本年度前八的国家
    year_data = data_dict[year][0:8]
    # 定义x,y轴空列表
    x_data = []
    y_data = []
    # 将数据存入xy轴列表中
    for country_gdp in year_data:
        x_data.append(country_gdp[0])
        y_data.append(country_gdp[1]/1000000000)    #单位是亿,所以除一下
    bar = Bar()
    # 数据进行反转,如果不翻转,GDP最大的会出现在底部而不是顶上第一条
    x_data.reverse()
    y_data.reverse()
    bar.add_xaxis(x_data)
    bar.add_yaxis("GDP(亿)",y_data,label_opts=LabelOpts(position="right"))   #原y轴数据以及单位说明,并设置数据放置在柱子右侧
    # 设置每年的标题
    bar.set_global_opts(
        title_opts=TitleOpts(title=f"第{year}年GDP排名前八情况",is_show=True,pos_left=True)
    )
    # 将x,y轴进行反转,令GPD数值放到x轴,国家参数放到y轴去
    bar.reversal_axis()
    # 给时间轴添加节点名称,每个节点代表一个年份表格
    timeLine.add(bar,str(year))
# 柱状图自动播放设置
timeLine.add_schema(
    is_loop_play=True,
    is_timeline_show=True,
    is_auto_play=True,
    play_interval=500
)
timeLine.render("1960-2019年全球GDP前八柱状图.html")
f.close()
————————————————————————————————
以上内容源自黑马程序员python基础课程学习笔记,仅供学习与参考


