一、基础图:https://ant-design-charts.antgroup.com/ Ant Design Charts
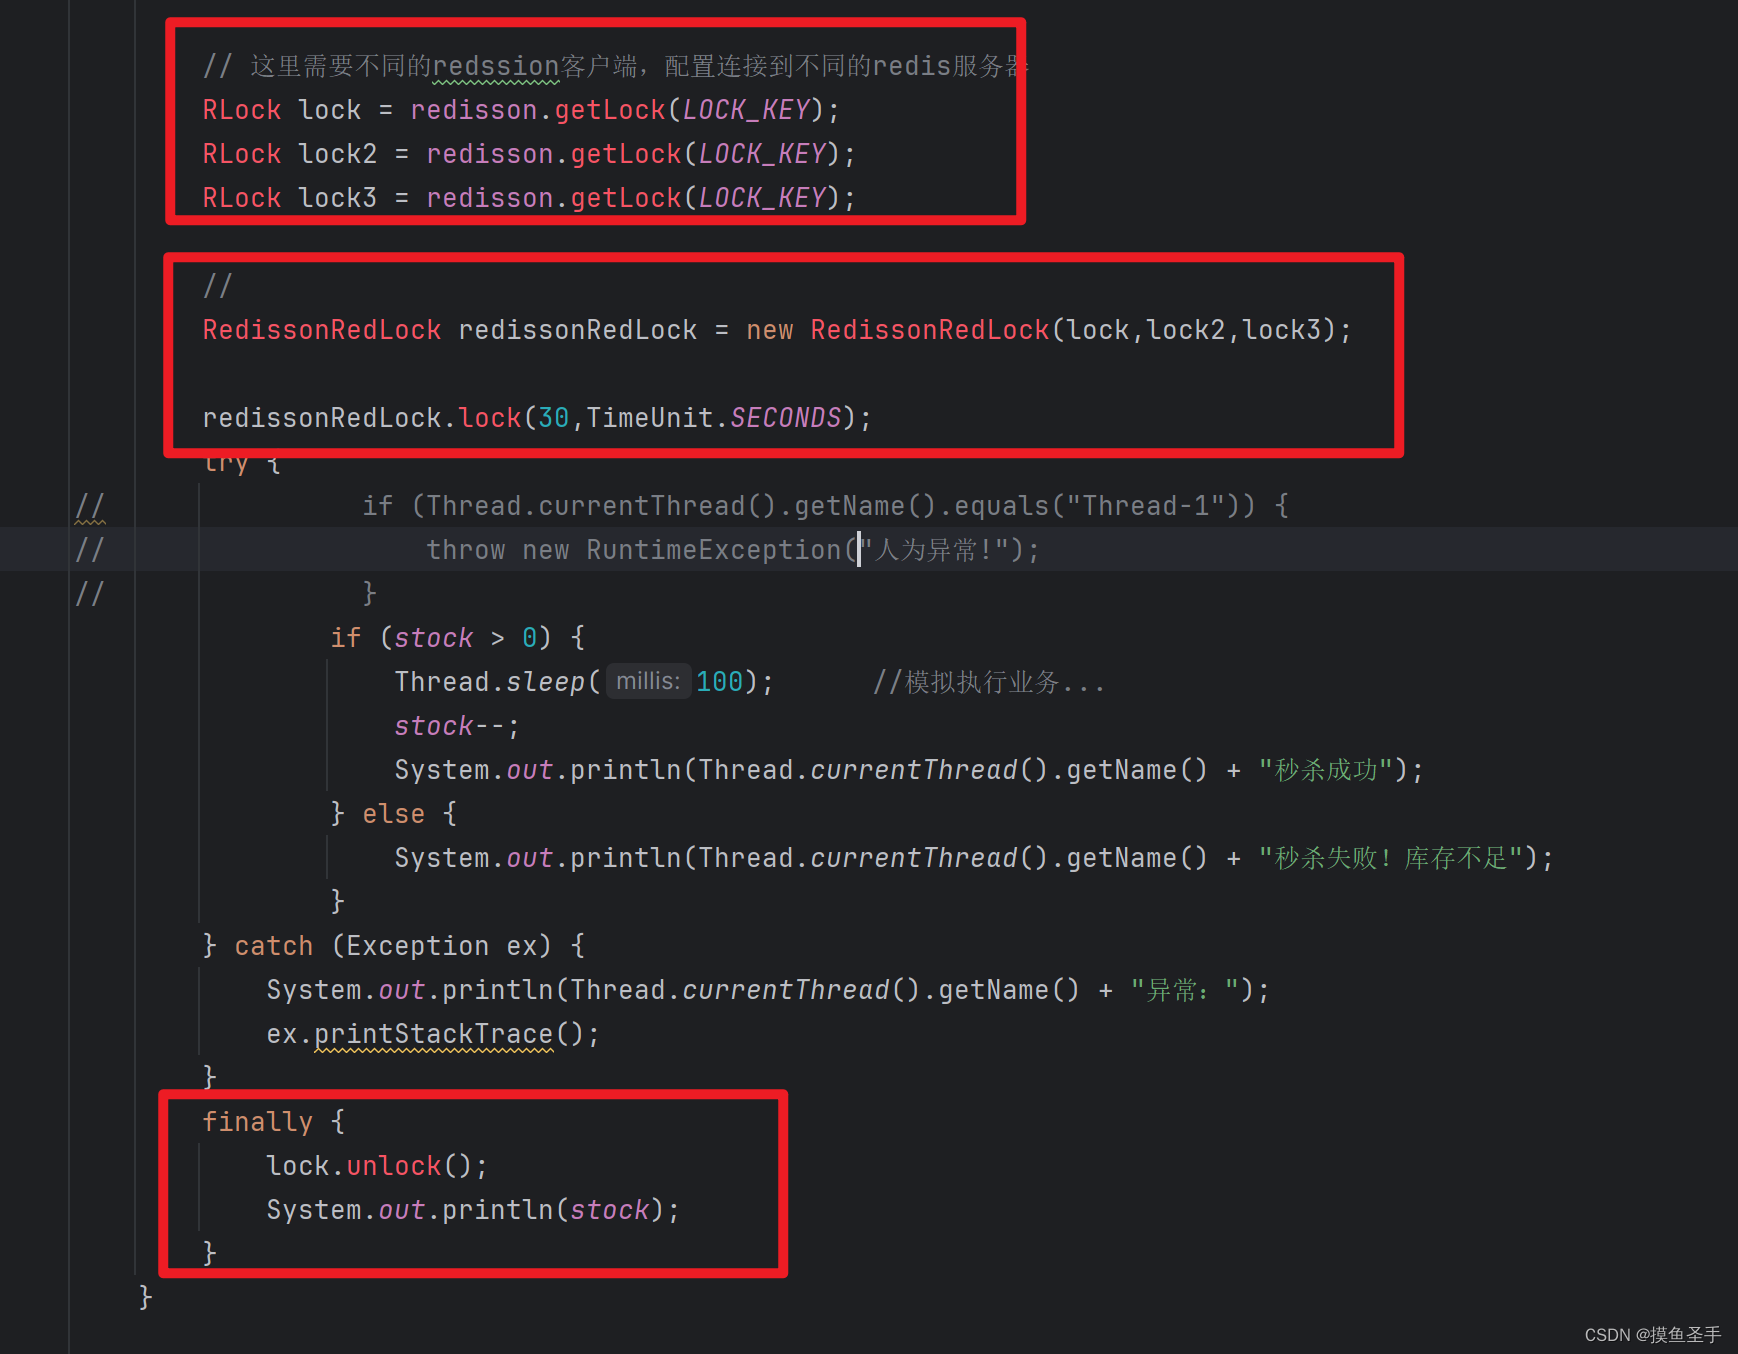
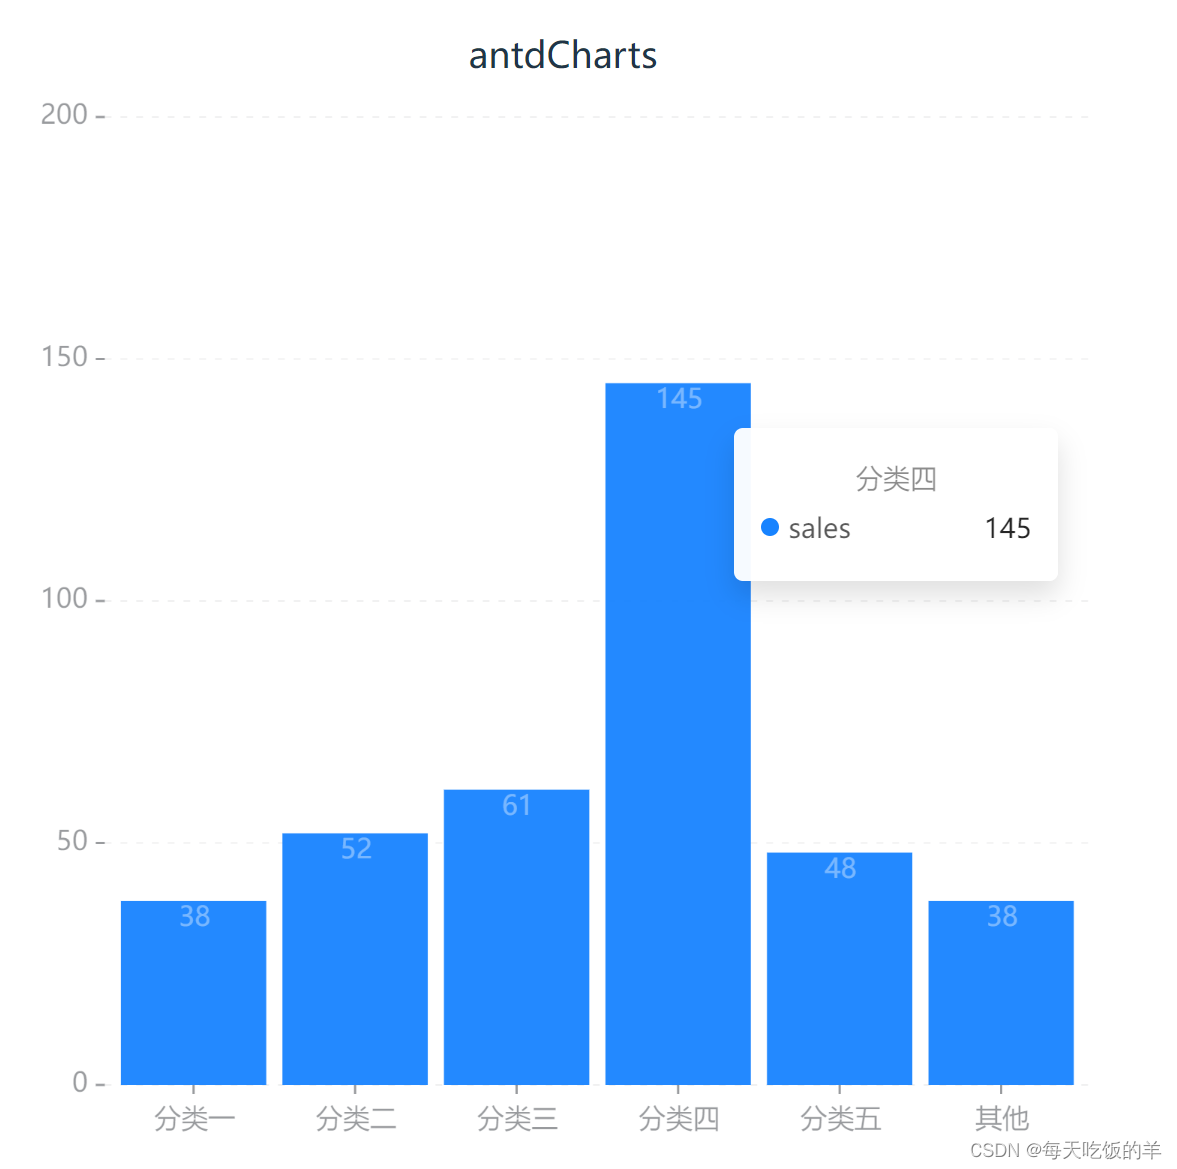
1. 首先要下载@ant-design/charts,然后在页面中添加如下柱状图代码:
import React from 'react';
import { Column } from '@ant-design/charts'

const DemoColumn: React.FC = () => {
  const data = [
    {
      type: '分类一',
      sales: 38
    },
    {
      type: '分类二',
      sales: 52
    },
    {
      type: '分类三',
      sales: 61
    },
    {
      type: '分类四',
      sales: 145
    }, {
      type: '分类五',
      sales: 48
    }, {
      type: '其他',
      sales: 38
    }
  ]
  const config = {
    data,
    xField: 'type',
    yField: 'sales',
    label: {
      // 可手动配置 label 数据标签位置
      // position: 'middle',
      // 'top', 'bottom', 'middle',
      // 配置样式
      style: {
        fill: '#FFFFFF',
        opacity: 0.6
      }
    },
    xAxis: {
      label: {
        autoHide: true,
        autoRotate: false
      }
    },
    meta: {
      type: {
        alias: '类别'
      },
      sales: {
        alias: '销售额(万)'
      }
    }
  }
  return <>antdCharts<Column {...config} /></>;
}
export default DemoColumn;
效果如下:
2.然后实现下这个案例区间曲线面积图 在柱庄图的基础上替换相关配置,代码如下:
import React from 'react';
import { Area} from '@ant-design/charts'

const DemoColumn: React.FC = () => {
    const config = {
        data: {
          type: 'fetch',
          value: 'https://assets.antv.antgroup.com/g2/range-spline-area.json',
          transform: [
            {
              type: 'map',
              callback: ([x, low, high, v2, v3]) => ({ x, low, high, v2, v3 }),
            },
          ],
        },
        xField: 'x',
        yField: ['low', 'high'],
        shapeField: 'smooth',
        style: {
          fillOpacity: 0.5,
          fill: '#64b5f6',
          lineWidth: 1,
        },
        axis: {
          y: { title: false },
        },
        scale: {
          x: { type: 'linear', tickCount: 10 },
        },
        point: {
          yField: 'v2',
          shapeField: 'point',
          sizeField: 2,
        },
        line: {
          yField: 'v3',
          style: {
            stroke: '#FF6B3B',
          },
        },
      };
  return <>Area<Area {...config} /></>;
}
export default DemoColumn;
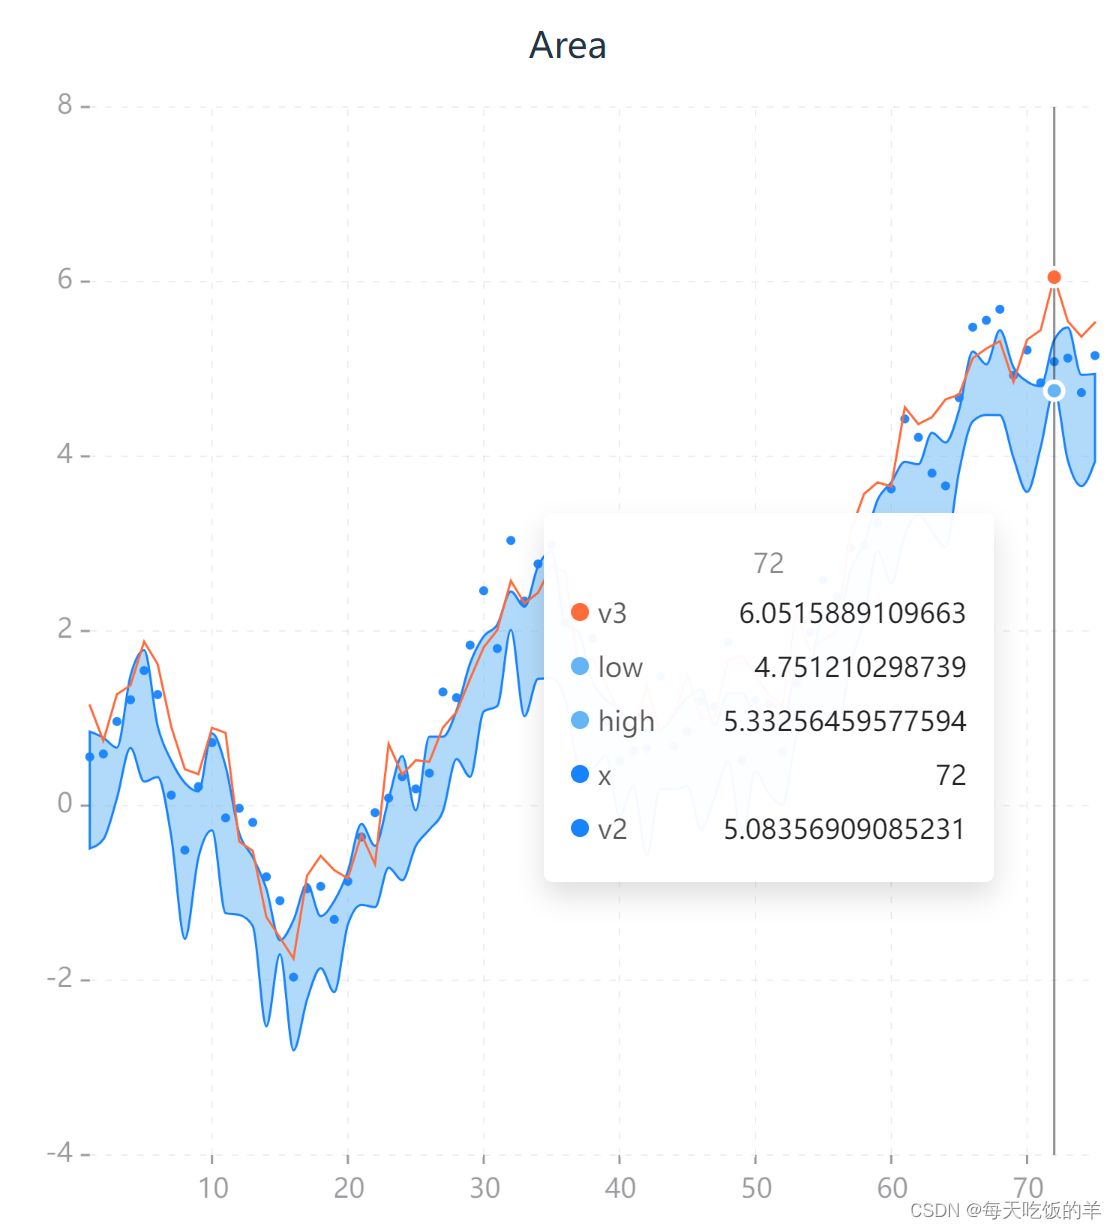
解决办法1:将https://assets.antv.antgroup.com/g2/range-spline-area.json在浏览器中打开就可以看到:

解决办法2:在示例代码中添加如下代码

控制台可见:右击 Copy object就复制了

二、高级图:蚂蚁数据可视化 - AntV G2,G6,F2,L7


