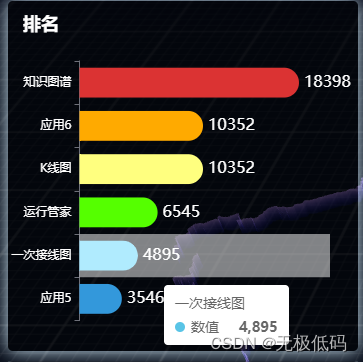
function createHorizontalBarChart(chartId, data) {
	    if (typeof echarts === 'undefined') {
	        console.error('请先引入 ECharts 库');
	        return;
	    }

	    // 初始化echarts实例
	    var myChart = echarts.init(document.getElementById(chartId));

	    // 对数据按照 value 进行降序排序
	    var sortedData = data.slice(0).sort(function (a, b) {
	        return a.value-b.value ;
	    });

	    // 指定图表的配置项和数据
	    var option = {
			title:{
				show: true ,
				padding: 15 ,
				text: '地震排名' ,
				link: 'https://wheart.cn' ,
				target: 'blank' ,
				textStyle: {
				color: '#fff' ,
				fontStyle: 'normal' ,
				fontWeight: 'bolder' ,
				fontFamily: 'sans-serif' ,
				fontSize: 18 ,
				textBorderType: 'solid' ,
				textBorderDashOffset: 0 ,
				textShadowColor: 'transparent' ,
				textShadowBlur: 0 ,
				textShadowOffsetX: 0 ,
				textShadowOffsetY: 0 ,
				overflow: 'none' ,
				ellipsis: '...' ,
				}
			},
	        tooltip: {
	            trigger: 'axis',
	            axisPointer: {
	                type: 'shadow',
	                shadowStyle: {
	                    color: 'rgba(255, 255, 255, 0.5)' // 设置指针颜色为半透明白色
	                }
	            }
	        },
	        grid: {
	            left: '1%',
	            right: '8%',
	            bottom: '3%',
	            containLabel: true
	        },
	        xAxis: {
	            type: 'value',
	            boundaryGap: [0, 0.01],
	            show: false,
	            axisLine: {
	                show: true // 不显示X轴线
	            },
	            axisLabel: {
	                show: true,
	                textStyle: {
	                    color: 'white' // X轴标签文字颜色
	                }
	            },
	            axisTick: {
	                show: true ,// 显示X轴刻度
	            }
	        },
	        yAxis: {
	            type: 'category',
	            data: sortedData.map(function (item) {

	                return item.name;
	            }),
	          axisLabel: {
	              show: true,
	              textStyle: {
	                  color: 'white' // X轴标签文字颜色
	              }
	          },
	        },
	        series: [{
	            name: '数值',
	            type: 'bar',
	            data: sortedData.map(function (item) {
	                return {
	                                   value: item.value,
	                                   name: item.name,
	                                   itemStyle: {
	                                       normal: {
	                                           borderRadius: [0, 15, 15, 0], // 设置圆角,这里表示顶部圆角为5px,底部无圆角
	                                       }
	                                   }
	                               }
	            }),
	            label: {
	                normal: {
	                    show: true,
	                    position: 'right', // 标签显示在柱状图的右侧
	                    formatter: '{c}',
						color: 'white',
						fontStyle: 'normal' ,
						fontWeight: 'normal' ,
						fontFamily: 'sans-serif' ,
						fontSize: 16 ,
	                },

	            },
	            itemStyle: {
	                normal: {
	                    color: function (params) {
	                        // 根据系列索引返回颜色
	                        var colorList = ['#3398DB', '#59C4E6', '#55ff00', '#ffff7f', '#ffaa00', '#DB3333'];
	                        return colorList[params.dataIndex]; // 循环使用颜色数组
	                    }
	                }
	            }
	        }]
	    };

	    // 使用刚指定的配置项和数据显示图表。
	    myChart.setOption(option);
	}
		// 示例数据,基于您提供的资源内容
		var rankData = [
		    {name: 'K线图', value: 10352},
		    {name: '知识图谱', value: 18398},
		    {name: '运行管家', value: 6545},
		    {name: '一次接线图', value: 4895},
		    {name: '应用5', value: 3546},
		    {name: '应用6', value: 10352},
		];

		// 调用函数创建图表,确保您页面中有一个元素的 ID 为 'chart-container'
		createHorizontalBarChart('box', rankData);

