IDE: VS2019
项目模板:C# windows 窗体应用(.NET Framework)
【参考】
- B站上教程C#Chart控件画折线图的使用,关于
Chart控件的属性,介绍得非常详细。 - B站上教程C#上位机Chart控件实时曲线终极讲解,对鼠标滚轮事件等,多个事件的讲解较为详细。
- 工具箱中找不到
Chart控件怎么办->VS/C#添加chart控件
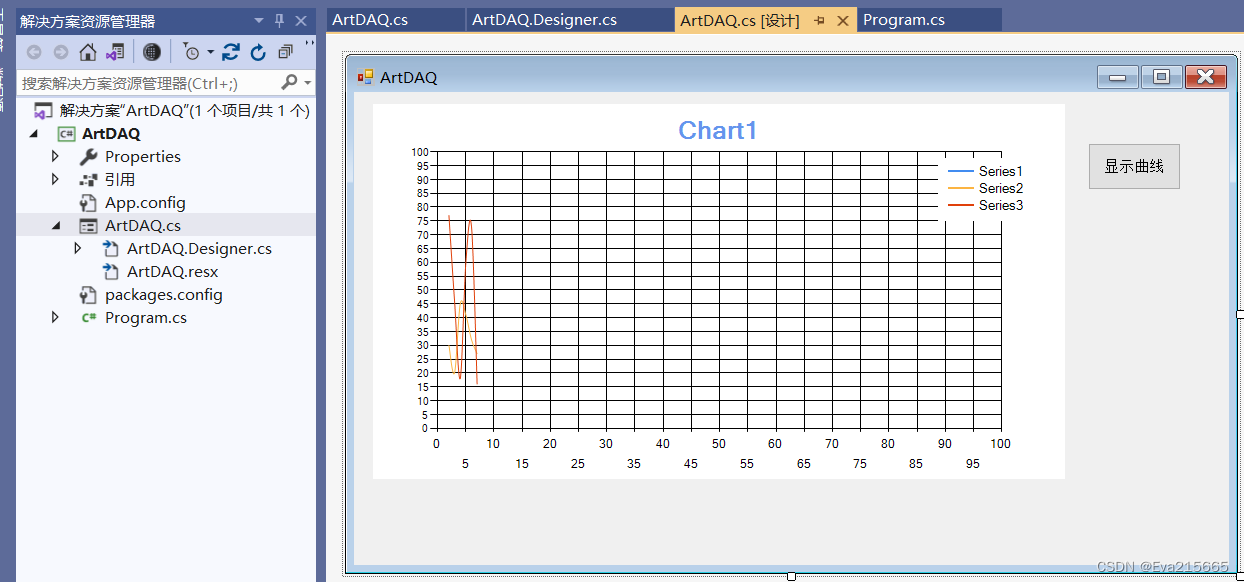
项目结构非常简单,一个窗体ArtDAQ.cs和一个主程序Program
 # 【遇到的问题】
Timer控件拖拽到设计器上,显示不出来,无法通过双击的方式给Timer控件添加事件
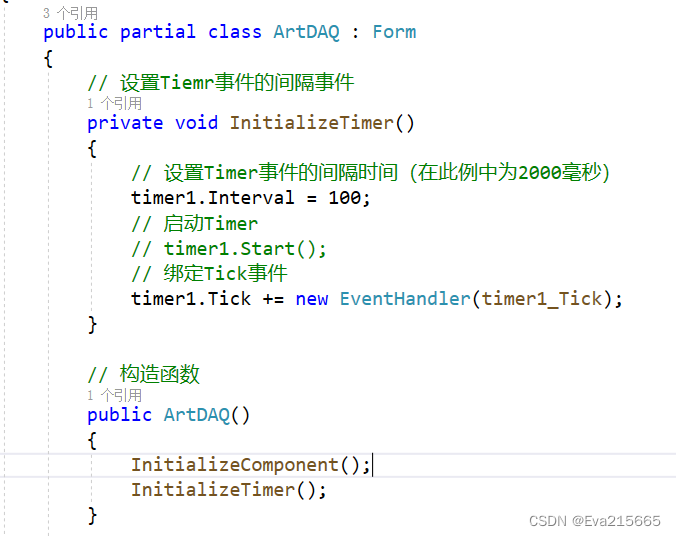
手动写了一个InitializeTimer函数,在该函数中,给Timer控件的对象timer1绑定了一个事件timer1_Tick
timer1.Tick += new EventHandler(timer1_Tick);
把InitializeTimer函数添加进ArtDAQ的构造函数中,然后在后面继续写timer1_Tick函数。
ArtDAQ.cs代码
using System;
using System.Collections.Generic;
using System.ComponentModel;
using System.Data;
using System.Drawing;
using System.Linq;
using System.Text;
using System.Threading.Tasks;
using System.Windows.Forms;

namespace ArtDAQ
{
    public partial class ArtDAQ : Form
    {
        // 设置Tiemr事件的间隔事件
        private void InitializeTimer()
        {
            // 设置Timer事件的间隔时间(在此例中为2000毫秒)
            timer1.Interval = 100;
            // 启动Timer
            // timer1.Start();
            // 绑定Tick事件
            timer1.Tick += new EventHandler(timer1_Tick);
        }

        // 构造函数
        public ArtDAQ()
        {
            InitializeComponent();
            InitializeTimer();
        }

        // 触发按钮
        private void button1_Click(object sender, EventArgs e)
        {
           if (timer1.Enabled == false)
            {
                // timer1.Enabled = true;
                timer1.Start();
                MessageBox.Show(timer1.Enabled.ToString());
            }
           else
            {
                timer1.Enabled = false;
            }
        }

        // Timer的事件
        // 随机数
        Random rd = new Random();
        int x = 0;
        int y = 0;

        private void timer1_Tick(object sender, EventArgs e)
        {
            y = rd.Next(0, 100+1);
            chart1.Series[0].Points.AddXY(x, y);
            if(x>=101)
            {
                timer1.Enabled = false;
                // timer1.Stop();
            }
            x++;
        }
    }
}
窗体设计文件ArtDAQ.Designer.cs
namespace ArtDAQ
{
    partial class ArtDAQ
    {
        /// <summary>
        /// Required designer variable.
        /// </summary>
        private System.ComponentModel.IContainer components = null;

        /// <summary>
        /// Clean up any resources being used.
        /// </summary>
        /// <param name="disposing">true if managed resources should be disposed; otherwise, false.</param>
        protected override void Dispose(bool disposing)
        {
            if (disposing && (components != null))
            {
                components.Dispose();
            }
            base.Dispose(disposing);
        }

        #region Windows Form Designer generated code

        /// <summary>
        /// Required method for Designer support - do not modify
        /// the contents of this method with the code editor.
        /// </summary>
        private void InitializeComponent()
        {
            this.components = new System.ComponentModel.Container();
            System.Windows.Forms.DataVisualization.Charting.ChartArea chartArea3 = new System.Windows.Forms.DataVisualization.Charting.ChartArea();
            System.Windows.Forms.DataVisualization.Charting.Legend legend3 = new System.Windows.Forms.DataVisualization.Charting.Legend();
            System.Windows.Forms.DataVisualization.Charting.Series series7 = new System.Windows.Forms.DataVisualization.Charting.Series();
            System.Windows.Forms.DataVisualization.Charting.DataPoint dataPoint3 = new System.Windows.Forms.DataVisualization.Charting.DataPoint(0D, 0D);
            System.Windows.Forms.DataVisualization.Charting.Series series8 = new System.Windows.Forms.DataVisualization.Charting.Series();
            System.Windows.Forms.DataVisualization.Charting.Series series9 = new System.Windows.Forms.DataVisualization.Charting.Series();
            System.Windows.Forms.DataVisualization.Charting.Title title3 = new System.Windows.Forms.DataVisualization.Charting.Title();
            this.chart1 = new System.Windows.Forms.DataVisualization.Charting.Chart();
            this.timer1 = new System.Windows.Forms.Timer(this.components);
            this.button1 = new System.Windows.Forms.Button();
            ((System.ComponentModel.ISupportInitialize)(this.chart1)).BeginInit();
            this.SuspendLayout();
            //
            // chart1
            //
            chartArea3.AxisX.Interval = 5D;
            chartArea3.AxisX.Maximum = 100D;
            chartArea3.AxisX.Minimum = 0D;
            chartArea3.AxisY.Interval = 5D;
            chartArea3.AxisY.Maximum = 100D;
            chartArea3.AxisY.Minimum = 0D;
            chartArea3.CursorX.IsUserEnabled = true;
            chartArea3.CursorX.IsUserSelectionEnabled = true;
            chartArea3.Name = "ChartArea1";
            chartArea3.Position.Auto = false;
            chartArea3.Position.Height = 90F;
            chartArea3.Position.Width = 90F;
            chartArea3.Position.X = 3F;
            chartArea3.Position.Y = 10F;
            this.chart1.ChartAreas.Add(chartArea3);
            legend3.Name = "Legend1";
            this.chart1.Legends.Add(legend3);
            this.chart1.Location = new System.Drawing.Point(19, 12);
            this.chart1.Name = "chart1";
            series7.ChartArea = "ChartArea1";
            series7.ChartType = System.Windows.Forms.DataVisualization.Charting.SeriesChartType.Spline;
            series7.Legend = "Legend1";
            series7.Name = "Series1";
            series7.Points.Add(dataPoint3);
            series8.ChartArea = "ChartArea1";
            series8.ChartType = System.Windows.Forms.DataVisualization.Charting.SeriesChartType.Spline;
            series8.Legend = "Legend1";
            series8.Name = "Series2";
            series9.ChartArea = "ChartArea1";
            series9.ChartType = System.Windows.Forms.DataVisualization.Charting.SeriesChartType.Spline;
            series9.Legend = "Legend1";
            series9.Name = "Series3";
            this.chart1.Series.Add(series7);
            this.chart1.Series.Add(series8);
            this.chart1.Series.Add(series9);
            this.chart1.Size = new System.Drawing.Size(692, 375);
            this.chart1.TabIndex = 0;
            this.chart1.Text = "chart1";
            title3.BorderWidth = 2;
            title3.Font = new System.Drawing.Font("Microsoft Sans Serif", 15F, System.Drawing.FontStyle.Bold);
            title3.ForeColor = System.Drawing.Color.CornflowerBlue;
            title3.Name = "Title1";
            title3.Text = "Chart1";
            this.chart1.Titles.Add(title3);
            //
            // timer1
            //
            // this.timer1.Tick += new System.EventHandler(this.timer1_Tick);
            //
            // button1
            //
            this.button1.Location = new System.Drawing.Point(734, 51);
            this.button1.Name = "button1";
            this.button1.Size = new System.Drawing.Size(93, 47);
            this.button1.TabIndex = 1;
            this.button1.Text = "显示曲线";
            this.button1.UseVisualStyleBackColor = true;
            this.button1.Click += new System.EventHandler(this.button1_Click);
            //
            // ArtDAQ
            //
            this.AutoScaleDimensions = new System.Drawing.SizeF(8F, 15F);
            this.AutoScaleMode = System.Windows.Forms.AutoScaleMode.Font;
            this.ClientSize = new System.Drawing.Size(875, 473);
            this.Controls.Add(this.button1);
            this.Controls.Add(this.chart1);
            this.Name = "ArtDAQ";
            this.Text = "ArtDAQ";
            ((System.ComponentModel.ISupportInitialize)(this.chart1)).EndInit();
            this.ResumeLayout(false);

        }

        #endregion

        private System.Windows.Forms.DataVisualization.Charting.Chart chart1;
        private System.Windows.Forms.Timer timer1;
        private System.Windows.Forms.Button button1;
    }
}
【项目地址】:
链接:https://pan.baidu.com/s/1HhBg620l0nMsSQ07j8MdOQ
提取码:6wnn
–来自百度网盘超级会员V5的分享

![[大模型]MiniCPM-2B-chat WebDemo部署](https://img-blog.csdnimg.cn/direct/0b3600e5dd7e49d1ac1eb1df252b758d.png#pic_center)


![OpenHarmony图形处理库—pyclipper [GN编译]](https://img-blog.csdnimg.cn/img_convert/48b1e7eff01309fe163e3e6dcf6fba55.webp?x-oss-process=image/format,png)

