获取数据集 导入需要的包 读取数据 划分训练集和测试集 调用各种模型 比较准确率 链接:https:
提取码:j484
-- 来自百度网盘超级会员V1的分享
import pandas as pd
import numpy as np
import matplotlib. pyplot as plt
import seaborn as sns
import warnings
warnings. filterwarnings ( 'ignore' )
import matplotlib as mpl
## 设置属性防止中文乱码
mpl. rcParams[ 'font.sans-serif' ] = [ u'SimHei' ]
mpl. rcParams[ 'axes.unicode_minus' ] = False
# 导入各种模型 svm, knn, RidgeClassifier ( ) , LogisticRegression ( 逻辑回归)
# 支持向量机分类svc, 最近邻居 knn, lr逻辑回归, rc
# SVM= Support Vector Machine 是支持向量 # SVC= Support Vector Classification就是支持向量机用于分类,这里是分类问题所以引入SVC # SVR= Support Vector Regression. 就是支持向量机用于回归分析 . linear_model import LogisticRegression, RidgeClassifier
from sklearn. svm import SVC
from sklearn. neighbors import KNeighborsClassifier
# 到这里四种方式引入完毕
# 引入sklearn的划分训练集和测试集合
from sklearn. model_selection import train_test_split
# 计算模型准确率
from sklearn. metrics import accuracy_score`在这里插入代码片`
iris_data= pd. read_csv( 'iris.csv' , usecols= [ 1 , 2 , 3 , 4 , 5 ] )
x = iris_data[ [ 'sepal_length' , 'sepal_width' , 'petal_length' , 'petal_width' ] ]
r = iris_data[ 'species' ]
x_train, x_test, r_train, r_test = train_test_split( x, r, random_state= 0 )
svm = SVC( C= 1 , kernel= 'linear' )
svm. fit( x_train, r_train)
knn = KNeighborsClassifier( n_neighbors= 1 )
knn. fit( x_train, r_train)
lr = LogisticRegression( )
rc = RidgeClassifier( )
lr. fit( x_train, r_train)
rc. fit( x_train, r_train)
svm_score2 = accuracy_score( r_test, svm. predict( x_test) )
lr_score2 = accuracy_score( r_test, lr. predict( x_test) )
rc_score2 = accuracy_score( r_test, rc. predict( x_test) )
knn_score2 = accuracy_score( r_test, knn. predict( x_test) )
print ( svm_score2)
print ( lr_score2)
print ( rc_score2)
print ( knn_score2)
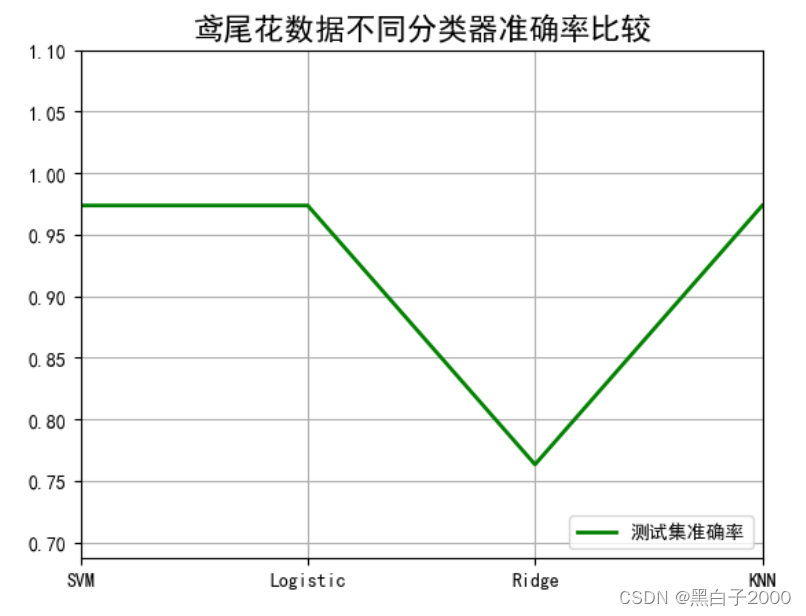
x_tmp = [ 0 , 1 , 2 , 3 ]
y_score2 = [ svm_score2, lr_score2, rc_score2, knn_score2]
plt. figure( facecolor= 'w' )
plt. plot( x_tmp, y_score2, 'g-' , lw= 2 , label= u'测试集准确率' )
plt. xlim( 0 , 3 )
plt. ylim( np. min ( ( np. min ( y_score1) , np. min ( y_score2) ) ) * 0.9 , np. max ( ( np. max ( y_score1) , np. max ( y_score2) ) ) * 1.1 )
plt. legend( loc = 'lower right' )
plt. title( u'鸢尾花数据不同分类器准确率比较' , fontsize= 16 )
plt. xticks( x_tmp, [ u'SVM' , u'Logistic' , u'Ridge' , u'KNN' ] , rotation= 0 )
plt. grid( )
plt. show( )
