注意:本文引用自专业人工智能社区Venus AI
更多AI知识请参考原站 ([www.aideeplearning.cn])
项目背景
在竞争激烈的商业环境中,了解和满足客户的需求是任何成功商场的关键要素。为了更好地理解我们的客户并制定有针对性的营销策略,我们拥有一家超市商场,并通过会员卡收集了客户的基本数据。其中,我们尤其关注了一项叫做”消费分数”的指标,这是根据我们定义的一些参数,如客户行为和购买数据,为每位客户分配的分数。
项目目标
本项目的主要目标包括:
- 通过K均值聚类算法对客户进行细分,以识别不同的客户群体。
- 确定目标客户,即哪些客户更容易受到吸引。
- 提供有关不同客户群体的详细信息,以便为市场团队制定有针对性的营销策略。
通过这个项目,我们希望能够更好地了解我们的客户,从而为我们的商场提供更智能、个性化和有效的市场战略。我们将通过数据分析和机器学习算法的应用来实现这一目标,并将在未来分享我们的研究结果和见解。
数据集描述
我们的数据集包含了以下关键属性:
- 客户ID
- 年龄
- 性别
- 年收入
- 消费分数
我们可以通过对这些属性进行分析和建模,深入了解客户群体的特征,以及哪些客户更容易被吸引和满足。
模型选择与依赖库
算法: 我们的关键算法是K均值聚类(Kmeans Clustering),它可以将客户分成不同的群体,每个群体具有相似的特征。这将有助于我们理解不同群体的需求和购买行为,从而更好地满足他们的期望。
Libraries(依赖库): 为了完成这个项目,我们将利用以下Python库和机器学习算法:
- Pandas:用于数据加载和处理,帮助我们清洗和准备数据。
- Matplotlib和Seaborn:用于数据可视化,以便更好地理解客户数据的分布和关联关系。
- Scikit-learn:这是一个强大的机器学习库,我们将使用其中的K均值聚类算法来对客户进行细分。
代码实现
导入模块
import pandas as pd
import numpy as np
import seaborn as sns
import matplotlib.pyplot as plt
加载数据集
df = pd.read_csv('Mall_Customers.csv')
df.head()| CustomerID | Gender | Age | Annual Income (k$) | Spending Score (1-100) | |
|---|---|---|---|---|---|
| 0 | 1 | Male | 19 | 15 | 39 |
| 1 | 2 | Male | 21 | 15 | 81 |
| 2 | 3 | Female | 20 | 16 | 6 |
| 3 | 4 | Female | 23 | 16 | 77 |
| 4 | 5 | Female | 31 | 17 | 40 |
# 统计信息
df.describe()| CustomerID | Age | Annual Income (k$) | Spending Score (1-100) | |
|---|---|---|---|---|
| count | 200.000000 | 200.000000 | 200.000000 | 200.000000 |
| mean | 100.500000 | 38.850000 | 60.560000 | 50.200000 |
| std | 57.879185 | 13.969007 | 26.264721 | 25.823522 |
| min | 1.000000 | 18.000000 | 15.000000 | 1.000000 |
| 25% | 50.750000 | 28.750000 | 41.500000 | 34.750000 |
| 50% | 100.500000 | 36.000000 | 61.500000 | 50.000000 |
| 75% | 150.250000 | 49.000000 | 78.000000 | 73.000000 |
| max | 200.000000 | 70.000000 | 137.000000 | 99.000000 |
# 数据类型信息
df.info()
<class 'pandas.core.frame.DataFrame'> RangeIndex: 200 entries, 0 to 199 Data columns (total 5 columns): # Column Non-Null Count Dtype --- ------ -------------- ----- 0 CustomerID 200 non-null int64 1 Gender 200 non-null object 2 Age 200 non-null int64 3 Annual Income (k$) 200 non-null int64 4 Spending Score (1-100) 200 non-null int64 dtypes: int64(4), object(1) memory usage: 7.9+ KB
探索性数据分析
gender_counts = df['Gender'].value_counts()
sns.barplot(x=gender_counts.index, y=gender_counts.values)
plt.xlabel('Gender')
plt.ylabel('Count')
plt.title('Gender Distribution')
plt.show()
sns.displot(df['Age'], kde=True)  # kde=True添加核密度估计曲线
plt.xlabel('Age')
plt.ylabel('Density')
plt.title('Age Distribution')
plt.show()
sns.displot(df['Annual Income (k$)'], kde=True)  # kde=True添加核密度估计曲线
plt.xlabel('Annual Income (k$)')
plt.ylabel('Density')
plt.title('Annual Income (k$) Distribution')
plt.show()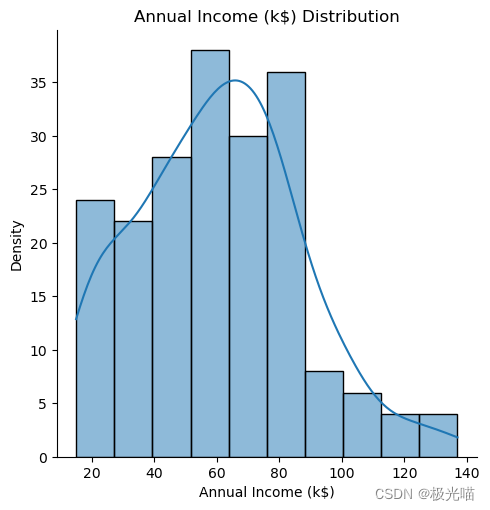
sns.displot(df['Spending Score (1-100)'], kde=True)  # kde=True添加核密度估计曲线
plt.xlabel('Spending Score (1-100)')
plt.ylabel('Density')
plt.title('Spending Score (1-100) Distribution')
plt.show()
相关矩阵
corr = df.corr(numeric_only=True)
sns.heatmap(corr, annot=True, cmap='coolwarm')
<Axes: >

聚类
df.head()| CustomerID | Gender | Age | Annual Income (k$) | Spending Score (1-100) | |
|---|---|---|---|---|---|
| 0 | 1 | Male | 19 | 15 | 39 |
| 1 | 2 | Male | 21 | 15 | 81 |
| 2 | 3 | Female | 20 | 16 | 6 |
| 3 | 4 | Female | 23 | 16 | 77 |
| 4 | 5 | Female | 31 | 17 | 40 |
# 基于 2 个特征的聚类
df1 = df[['Annual Income (k$)', 'Spending Score (1-100)']]
df1.head()| Annual Income (k$) | Spending Score (1-100) | |
|---|---|---|
| 0 | 15 | 39 |
| 1 | 15 | 81 |
| 2 | 16 | 6 |
| 3 | 16 | 77 |
| 4 | 17 | 40 |
# 散点图
sns.scatterplot(x='Annual Income (k$)', y='Spending Score (1-100)', data=df1)
plt.xlabel('Annual Income (k$)')
plt.ylabel('Spending Score (1-100)')
plt.title('Scatter Plot of Annual Income vs. Spending Score')
plt.show()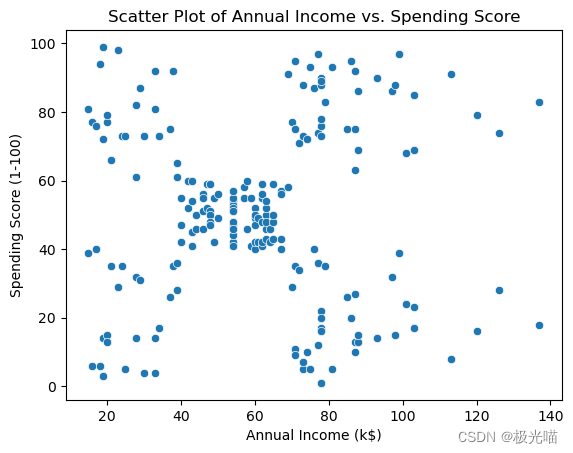
import warnings
warnings.filterwarnings("ignore", category=UserWarning)
from sklearn.cluster import KMeans

errors = []
for i in range(1, 11):
    kmeans = KMeans(n_clusters=i, random_state=0,n_init=10, max_iter=300 )
    kmeans.fit(df1)
    errors.append(kmeans.inertia_)
# 绘制肘部法的结果
plt.figure(figsize=(13,6))
plt.plot(range(1,11), errors)
plt.plot(range(1,11), errors, linewidth=3, color='red', marker='8')
plt.xlabel('No. of clusters')
plt.ylabel('WCSS')
plt.xticks(np.arange(1,11,1))
plt.show()
km = KMeans(n_clusters=5, n_init=10)
km.fit(df1)

y = km.predict(df1)
df1.loc[:, 'Label'] = y

df1.head()
C:\Users\1\AppData\Local\Temp\ipykernel_21088\2186447201.py:5: SettingWithCopyWarning:
A value is trying to be set on a copy of a slice from a DataFrame.
Try using .loc[row_indexer,col_indexer] = value instead
See the caveats in the documentation: https://pandas.pydata.org/pandas-docs/stable/user_guide/indexing.html#returning-a-view-versus-a-copy
df1.loc[:, 'Label'] = y
| Annual Income (k$) | Spending Score (1-100) | Label | |
|---|---|---|---|
| 0 | 15 | 39 | 0 |
| 1 | 15 | 81 | 3 |
| 2 | 16 | 6 | 0 |
| 3 | 16 | 77 | 3 |
| 4 | 17 | 40 | 0 |
sns.scatterplot(x='Annual Income (k$)', y='Spending Score (1-100)', data=df1, hue='Label', s=50, palette=['red', 'green', 'brown', 'blue', 'orange'])<Axes: xlabel='Annual Income (k$)', ylabel='Spending Score (1-100)'>

# 基于 3 个特征的聚类
df2 = df[['Annual Income (k$)', 'Spending Score (1-100)', 'Age']]
df2.head()| Annual Income (k$) | Spending Score (1-100) | Age | |
|---|---|---|---|
| 0 | 15 | 39 | 19 |
| 1 | 15 | 81 | 21 |
| 2 | 16 | 6 | 20 |
| 3 | 16 | 77 | 23 |
| 4 | 17 | 40 | 31 |
import warnings
warnings.filterwarnings("ignore", category=UserWarning)
from sklearn.cluster import KMeans

errors = []
for i in range(1, 11):
    kmeans = KMeans(n_clusters=i, random_state=0,n_init=10, max_iter=300 )
    kmeans.fit(df2)
    errors.append(kmeans.inertia_)
# 绘制肘部法的结果
plt.figure(figsize=(13,6))
plt.plot(range(1,11), errors)
plt.plot(range(1,11), errors, linewidth=3, color='red', marker='8')
plt.xlabel('No. of clusters')
plt.ylabel('WCSS')
plt.xticks(np.arange(1,11,1))
plt.show()
km = KMeans(n_clusters=5, n_init=10)
km.fit(df2)

y = km.predict(df2)
df2.loc[:, 'Label'] = y

df2.head()
C:\Users\1\AppData\Local\Temp\ipykernel_21088\4218386864.py:5: SettingWithCopyWarning: A value is trying to be set on a copy of a slice from a DataFrame. Try using .loc[row_indexer,col_indexer] = value instead See the caveats in the documentation: https://pandas.pydata.org/pandas-docs/stable/user_guide/indexing.html#returning-a-view-versus-a-copy df2.loc[:, 'Label'] = y
| Annual Income (k$) | Spending Score (1-100) | Age | Label | |
|---|---|---|---|---|
| 0 | 15 | 39 | 19 | 4 |
| 1 | 15 | 81 | 21 | 0 |
| 2 | 16 | 6 | 20 | 4 |
| 3 | 16 | 77 | 23 | 0 |
| 4 | 17 | 40 | 31 | 4 |
# 3d 散点图
fig = plt.figure(figsize=(20,15))
ax = fig.add_subplot(111, projection='3d')

ax.scatter(df2['Age'][df2['Label']==0], df2['Annual Income (k$)'][df2['Label']==0], df2['Spending Score (1-100)'][df2['Label']==0], c='red', s=50)
ax.scatter(df2['Age'][df2['Label']==1], df2['Annual Income (k$)'][df2['Label']==1], df2['Spending Score (1-100)'][df2['Label']==1], c='green', s=50)
ax.scatter(df2['Age'][df2['Label']==2], df2['Annual Income (k$)'][df2['Label']==2], df2['Spending Score (1-100)'][df2['Label']==2], c='blue', s=50)
ax.scatter(df2['Age'][df2['Label']==3], df2['Annual Income (k$)'][df2['Label']==3], df2['Spending Score (1-100)'][df2['Label']==3], c='brown', s=50)
ax.scatter(df2['Age'][df2['Label']==4], df2['Annual Income (k$)'][df2['Label']==4], df2['Spending Score (1-100)'][df2['Label']==4], c='orange', s=50)
ax.view_init(30, 190)
ax.set_xlabel('Age')
ax.set_ylabel('Annual Income')
ax.set_zlabel('Spending Score')
plt.show()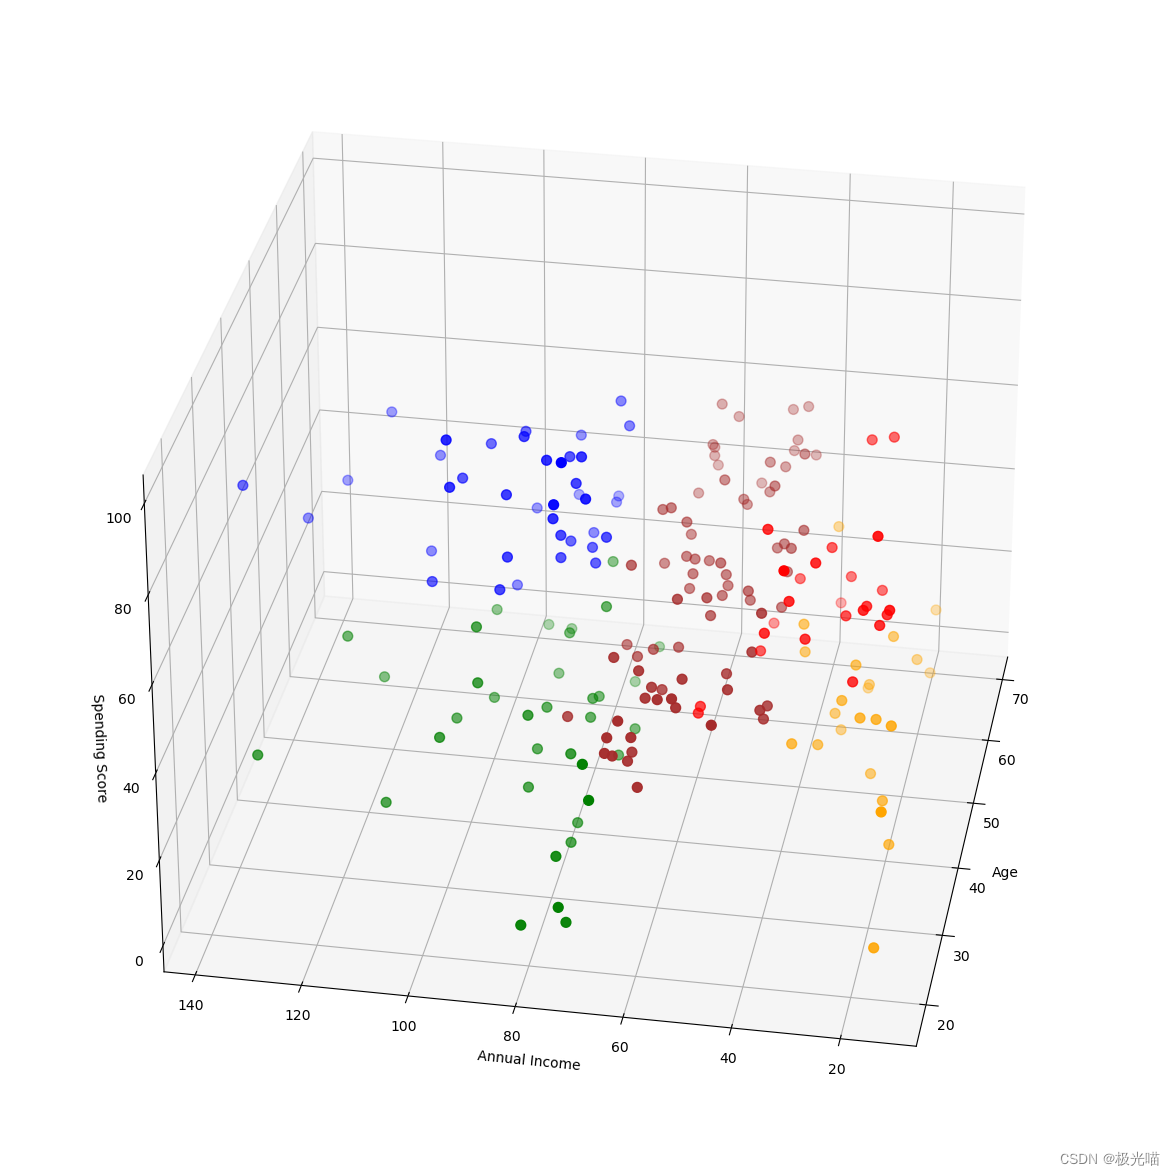
代码与数据集下载
详情请见超市商场客户细分项目-VenusAI (aideeplearning.cn)
