kitti数据集简介
kitti数据集是比较早出来的3D检测方面的数据集,相对来说数据结构简单,适合做单目检测的工作,目前也是业界和学术界常用的公开数据集。
自己最近也在做单目3D检测的工作,所以也分享一些理解,希望能给到一些人启发和帮助。
kitti数据的目录结构如下:
只需要下载下图所示的四个zip包解压就行,做单目3D检测已经足够。
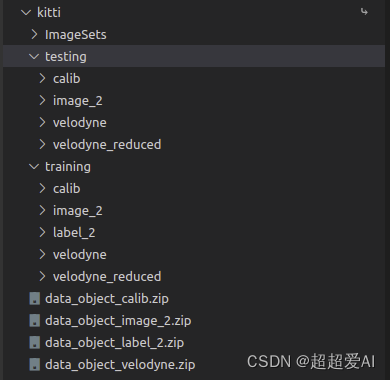
解压后以training为例,其中calib里面是传感器的标定参数,有一堆txt文件,内容格式如下:
P0: 7.215377000000e+02 0.000000000000e+00 6.095593000000e+02 0.000000000000e+00 0.000000000000e+00 7.215377000000e+02 1.728540000000e+02 0.000000000000e+00 0.000000000000e+00 0.000000000000e+00 1.000000000000e+00 0.000000000000e+00
P1: 7.215377000000e+02 0.000000000000e+00 6.095593000000e+02 -3.875744000000e+02 0.000000000000e+00 7.215377000000e+02 1.728540000000e+02 0.000000000000e+00 0.000000000000e+00 0.000000000000e+00 1.000000000000e+00 0.000000000000e+00
P2: 7.215377000000e+02 0.000000000000e+00 6.095593000000e+02 4.485728000000e+01 0.000000000000e+00 7.215377000000e+02 1.728540000000e+02 2.163791000000e-01 0.000000000000e+00 0.000000000000e+00 1.000000000000e+00 2.745884000000e-03
P3: 7.215377000000e+02 0.000000000000e+00 6.095593000000e+02 -3.395242000000e+02 0.000000000000e+00 7.215377000000e+02 1.728540000000e+02 2.199936000000e+00 0.000000000000e+00 0.000000000000e+00 1.000000000000e+00 2.729905000000e-03
R0_rect: 9.999239000000e-01 9.837760000000e-03 -7.445048000000e-03 -9.869795000000e-03 9.999421000000e-01 -4.278459000000e-03 7.402527000000e-03 4.351614000000e-03 9.999631000000e-01
Tr_velo_to_cam: 7.533745000000e-03 -9.999714000000e-01 -6.166020000000e-04 -4.069766000000e-03 1.480249000000e-02 7.280733000000e-04 -9.998902000000e-01 -7.631618000000e-02 9.998621000000e-01 7.523790000000e-03 1.480755000000e-02 -2.717806000000e-01
Tr_imu_to_velo: 9.999976000000e-01 7.553071000000e-04 -2.035826000000e-03 -8.086759000000e-01 -7.854027000000e-04 9.998898000000e-01 -1.482298000000e-02 3.195559000000e-01 2.024406000000e-03 1.482454000000e-02 9.998881000000e-01 -7.997231000000e-01
p0到p4对应的是rect相机坐标系到像素坐标系的变换矩阵,一般论文中叫内参,实际上是相机内参和相机外参以及畸变矫正融合的矩阵。
这里提几点:
kitti有四个相机,两个彩色的,两个灰度的,左侧彩色(对应序号2)的是有对应的标注信息的,所以如果做单目的话,用p2。
rect相机坐标系是对参考坐标系进行旋转矫正,使得4个相机的光心共面,这样做有一定好处,具体好处是什么可以不用在意。
Tr_velo_to_cam是雷达坐标系到参考相机坐标系。
Tr_imu_to_velo是imu到雷达坐标系。
image_2里面就是图片了。
label_2里面就是对应的标注信息了,3D标注是在rect相机坐标系中的。
Pedestrian 0.00 0 -0.20 712.40 143.00 810.73 307.92 1.89 0.48 1.20 1.84 1.47 8.41 0.01
第一列是类别,第二列是截断程度(0~1),第三列是遮挡程度(0,1,2,3),第四列是观察者角度alpha(没啥用),接下来五列到八列是2d框的信息,xmin ymin xmax ymax四个坐标,九列到十一列是3D框的高宽长,十二到十四列是3D框下底面中心点,最后一列是绕y轴的旋转角。
velodyne里面是雷达。另外一个velodyne_reduced是mmdetection3d转数据格式时生成的,可以不在意。
可视化
main.py文件:
import os
import cv2
import numpy as np
import mayavi.mlab as mlab
from utils import draw_lidar, draw_2dbox, gen_3dbox, project_box3d, draw_project, draw_box3d_lidar


class Kitti:
    def __init__(self, root_path="./kitti", ind=0) -> None:
        self.root_path = root_path
        train_file = os.path.join(root_path, "ImageSets/train.txt")
        with open(train_file, 'r') as f:
            names = f.readlines()
        self.names = [name.rstrip() for name in names]
        self.name = self.names[ind]

    def get_image(self, show=False):
        img_path = os.path.join(self.root_path, "training/image_2", self.name+".png")
        img = cv2.imread(img_path)
        if show and os.path.exists(img_path):
            cv2.imshow("origin image", img)
            if cv2.waitKey(0) == ord("q"):
                cv2.destroyAllWindows()
        return img

    def get_lidar(self, show=False):
        lidar_path = os.path.join(self.root_path, "training/velodyne", self.name+".bin")
        lidar = np.fromfile(lidar_path, dtype=np.float32)
        lidar = lidar.reshape((-1, 4))
        if show:
            fig = mlab.figure(figure=None, bgcolor=(0, 0, 0), engine=None,
                            size=(1000, 500))
            draw_lidar(lidar, fig=fig)
            mlab.show()
        return lidar

    def get_calib(self):
        calib = {}
        calib_path = os.path.join(self.root_path, "training/calib", self.name+".txt")
        with open(calib_path, 'r') as cf:
            infos = cf.readlines()
            infos = [x.rstrip() for x in infos]
        for info in infos:
            if len(info) == 0:
                continue
            key, value = info.split(":", 1)
            calib[key] = np.array([float(x) for x in value.split()])
        calib_format = self.format_calib(calib)
        return calib_format

    def format_calib(self, calib):
        calib_format = {}
        # projection matrix from rect coord to image coord.
        rect2image = calib["P2"]
        rect2image = rect2image.reshape([3, 4])
        calib_format["rect2image"] = rect2image
        # projection matrix from lidar coord to reference cam coord.
        lidar2cam = calib["Tr_velo_to_cam"]
        lidar2cam = lidar2cam.reshape([3, 4])
        calib_format["lidar2cam"] = lidar2cam
        # projection matrix from rect cam coord to reference cam coord.
        rect2ref = calib["R0_rect"]
        rect2ref = rect2ref.reshape([3, 3])
        calib_format["rect2ref"] = rect2ref
        return calib_format

    def get_anns(self):
        anns = []
        label_path = os.path.join(self.root_path, "training/label_2", self.name+".txt")
        with open(label_path, 'r') as lf:
            labels = lf.readlines()
            labels = [label.rstrip() for label in labels]
        for label in labels:
            ann_format = {}
            ann = label.split(" ")
            class_name = ann[0]
            ann_format["class_name"]=class_name
            ann_ = [float(x) for x in ann[1:]]
            truncation = ann_[0] # truncated pixel ratio [0..1]
            ann_format["truncation"]=truncation
            occlusion = ann_[1] # 0=visible, 1=partly occluded, 2=fully occluded, 3=unknown
            ann_format["occlusion"]=occlusion
            alpha = ann_[2]
            ann_format["alpha"]=alpha # object observation angle [-pi..pi]

            #2D box
            xmin, ymin, xmax, ymax = ann_[3], ann_[4], ann_[5], ann_[6]
            box2d = np.array([xmin, ymin, xmax, ymax])
            ann_format["box2d"]=box2d

            #3D box
            box3d = {}
            h, w, l = ann_[7], ann_[8], ann_[9]
            cx, cy, cz = ann_[10], ann_[11], ann_[12]
            box3d["dim"] = np.array([l, w, h])
            box3d["center"] = np.array([cx, cy, cz])
            yaw = ann_[13]
            box3d["rotation"] = yaw# yaw angle [-pi..pi]
            ann_format["box3d"]=box3d

            anns.append(ann_format)
        return anns


class VisKitti:
    def __init__(self, root_path="./kitti", ind=0) -> None:
        self.kitti = Kitti(root_path=root_path, ind=ind)
        self.calib = self.kitti.get_calib()
        self.anns = self.kitti.get_anns()

    def show_origin_image(self):
        self.kitti.get_image(show=True)

    def show_origin_lidar(self):
        self.kitti.get_lidar(show=True)

    def show_image_with_2dbox(self, save=False):
        img = self.kitti.get_image()
        bbox = []
        names = []
        for ann in self.anns:
            bbox.append(ann["box2d"])
            names.append(ann["class_name"])
        draw_2dbox(img, bbox, names, save=save)


    def show_image_with_project_3dbox(self, show=True):
        img = self.kitti.get_image()
        bbox = []
        for ann in self.anns:
            bbox.append(ann["box3d"])
        bbox3d = gen_3dbox(bbox3d=bbox)
        project_xy,_ = project_box3d(bbox3d, self.calib)
        draw_project(img, project_xy, save=False)


    def show_lidar_with_3dbox(self, img_fov=False):
        img = self.kitti.get_image()
        bbox = []
        for ann in self.anns:
            bbox.append(ann["box3d"])
        bbox3d = gen_3dbox(bbox3d=bbox)
        fig = mlab.figure(figure=None, bgcolor=(0, 0, 0), engine=None,
                        size=(1000, 500))
        lidar = self.kitti.get_lidar()
        fig = draw_lidar(lidar, fig=fig)
        fig = draw_box3d_lidar(bbox3d, self.calib, fig)
        mlab.show()


if __name__ == "__main__":
    vis = VisKitti()
    print("1: show_origin_image")
    print("2: show_origin_lidar")
    print("3: show_image_with_2dbox")
    print("4: show_image_with_project_3dbox")
    print("5: show_lidar_with_3dbox")

    choice = input("please choice number:")
    if choice=="1":
        vis.show_origin_image()
    elif choice=="2":
        vis.show_origin_lidar()
    elif choice=="3":
        vis.show_image_with_2dbox()
    elif choice=="4":
        vis.show_image_with_project_3dbox()
    elif choice=="5":
        vis.show_lidar_with_3dbox()
utils.py 文件
import os
import cv2
import numpy as np
import mayavi.mlab as mlab


def draw_lidar(pc,
               color=None,
               fig=None,
               bgcolor=(0, 0, 0),
               pts_scale=0.3,
               pts_mode="point",
               pts_color=None,
               color_by_intensity=False,
               ):
    if fig == None:
        fig = mlab.figure(figure=None, bgcolor=bgcolor, engine=None,
                          size=(1600, 1000))
    if color == None:
        color = pc[:, 2]

    s = pc[:, 3] if color_by_intensity else pc[:, 2]
    mlab.points3d(pc[:, 0],
                  pc[:, 1],
                  pc[:, 2],
                  s,
                  color=pts_color,
                  mode=pts_mode,
                  colormap="gnuplot",
                  scale_factor=pts_scale,
                  figure=fig)

    # draw origin point
    mlab.points3d(0, 0, 0, color=(1, 1, 1), mode="sphere", scale_factor=0.2, figure=fig)

    # draw axis
    axis_xyz = np.array([[2, 0, 0],[0, 2, 0],[0, 0, 2]], dtype=np.float64)
    # x axis
    mlab.plot3d([0, axis_xyz[0, 0]],
                [0, axis_xyz[0, 1]],
                [0, axis_xyz[0, 2]],
                color=(1, 0, 0),
                tube_radius=None,
                figure=fig)
    # y axis
    mlab.plot3d([0, axis_xyz[1, 0]],
                [0, axis_xyz[1, 1]],
                [0, axis_xyz[1, 2]],
                color=(0, 1, 0),
                tube_radius=None,
                figure=fig)
    # z axis
    mlab.plot3d([0, axis_xyz[2, 0]],
                [0, axis_xyz[2, 1]],
                [0, axis_xyz[2, 2]],
                color=(0, 0, 1),
                tube_radius=None,
                figure=fig)
    mlab.view(
        azimuth=180,
        elevation=70,
        focalpoint=[12.0909996, -1.04700089, -2.03249991],
        distance=62.0,
        figure=fig,
    )
    return fig

def draw_2dbox(img, bbox, names=None, save=False):
    assert len(bbox)==len(names), "names not match bbox"
    color_map = {"Car":(0, 255, 0), "Pedestrian":(255, 0, 0), "Cyclist":(0, 0, 255)}
    for i, box in enumerate(bbox):
        name = names[i]
        if name not in color_map.keys():
            continue
        color = color_map[name]
        cv2.rectangle(
            img,
            (int(box[0]), int(box[1])),
            (int(box[2]), int(box[3])),
            color,
            2,
        )
        name_coord = (int(box[0]), int(max(box[1]-5, 0)))
        cv2.putText(img, name, name_coord,
                    cv2.FONT_HERSHEY_PLAIN, 1, color, 1)

    cv2.imshow("image_with_2dbox", img)
    if cv2.waitKey(0) == ord("q"):
        cv2.destroyAllWindows()
    if save:
        cv2.imwrite("image_with_2dbox.jpg", img)

def rotx(t):
    """ 3D Rotation about the x-axis. """
    c = np.cos(t)
    s = np.sin(t)
    return np.array([[1, 0, 0], [0, c, -s], [0, s, c]])


def roty(t):
    """ Rotation about the y-axis. """
    c = np.cos(t)
    s = np.sin(t)
    return np.array([[c, 0, s], [0, 1, 0], [-s, 0, c]])


def rotz(t):
    """ Rotation about the z-axis. """
    c = np.cos(t)
    s = np.sin(t)
    return np.array([[c, -s, 0], [s, c, 0], [0, 0, 1]])

def expand_matrix(matrix):
    new_matrix = np.eye(4, 4)
    new_matrix[:3, :] = matrix
    return new_matrix

def gen_3dbox(bbox3d):
    corners_3d_all = []
    for box in bbox3d:
        center = box["center"]
        l, w, h = box["dim"]
        angle = box["rotation"]
        R = roty(angle)
        # 3d bounding box corners
        x_corners = [l / 2, l / 2, -l / 2, -l / 2, l / 2, l / 2, -l / 2, -l / 2]
        y_corners = [0, 0, 0, 0, -h, -h, -h, -h]
        z_corners = [w / 2, -w / 2, -w / 2, w / 2, w / 2, -w / 2, -w / 2, w / 2]

        corners = np.vstack([x_corners, y_corners, z_corners])
        corners_3d = np.dot(R, corners)
        corners_3d[0, :] += center[0]
        corners_3d[1, :] += center[1]
        corners_3d[2, :] += center[2]
        corners_3d_all.append(corners_3d)
    return corners_3d_all

def project_box3d(bbox3d, calib):
    P = calib["rect2image"]
    P = expand_matrix(P)
    project_xy = []
    project_z = []
    for box3d in bbox3d:
        if np.any(box3d[:, 2] < 0.1):
            continue
        box3d = np.concatenate([box3d, np.zeros((1, 8))], axis=0)
        project_3dbox = np.dot(P, box3d)[:3, :]
        pz = project_3dbox[2, :]
        px = project_3dbox[0, :]/pz
        py = project_3dbox[1, :]/pz
        xy = np.stack([px, py], axis=1)
        project_xy.append(xy)
        project_z.append(pz)
    return project_xy, project_z

def draw_project(img, project_xy, save=False):
    color_map = {"Car":(0, 255, 0), "Pedestrian":(255, 0, 0), "Cyclist":(0, 0, 255)}
    for i, qs in enumerate(project_xy):
        color = (0, 255, 0)
        qs = qs.astype(np.int32)
        for k in range(0, 4):
            i, j = k, (k + 1) % 4
            # use LINE_AA for opencv3
            cv2.line(img, (qs[i, 0], qs[i, 1]), (qs[j, 0], qs[j, 1]), color, 1)
            i, j = k + 4, (k + 1) % 4 + 4
            cv2.line(img, (qs[i, 0], qs[i, 1]), (qs[j, 0], qs[j, 1]), color, 1)
            i, j = k, k + 4
            cv2.line(img, (qs[i, 0], qs[i, 1]), (qs[j, 0], qs[j, 1]), color, 1)

    cv2.imshow("image_with_projectbox", img)
    if cv2.waitKey(0) == ord("q"):
        cv2.destroyAllWindows()
    if save:
        cv2.imwrite("image_with_projectbox.jpg", img)

def draw_gt_boxes3d(
    gt_boxes3d,
    fig,
    color=(1, 1, 1),
    line_width=1,
):
    """ Draw 3D bounding boxes
    Args:
        gt_boxes3d: numpy array (n,8,3) for XYZs of the box corners
        fig: mayavi figure handler
        color: RGB value tuple in range (0,1), box line color
        line_width: box line width
        draw_text: boolean, if true, write box indices beside boxes
        text_scale: three number tuple
        color_list: a list of RGB tuple, if not None, overwrite color.
    Returns:
        fig: updated fig
    """
    num = len(gt_boxes3d)
    for n in range(num):
        b = gt_boxes3d[n]

        for k in range(0, 4):
            i, j = k, (k + 1) % 4
            mlab.plot3d(
                [b[i, 0], b[j, 0]],
                [b[i, 1], b[j, 1]],
                [b[i, 2], b[j, 2]],
                color=color,
                tube_radius=None,
                line_width=line_width,
                figure=fig,
            )

            i, j = k + 4, (k + 1) % 4 + 4
            mlab.plot3d(
                [b[i, 0], b[j, 0]],
                [b[i, 1], b[j, 1]],
                [b[i, 2], b[j, 2]],
                color=color,
                tube_radius=None,
                line_width=line_width,
                figure=fig,
            )

            i, j = k, k + 4
            mlab.plot3d(
                [b[i, 0], b[j, 0]],
                [b[i, 1], b[j, 1]],
                [b[i, 2], b[j, 2]],
                color=color,
                tube_radius=None,
                line_width=line_width,
                figure=fig,
            )
    return fig

def inverse_rigid_trans(Tr):
    """ Inverse a rigid body transform matrix (3x4 as [R|t])
        [R'|-R't; 0|1]
    """
    inv_Tr = np.zeros_like(Tr)  # 3x4
    inv_Tr[0:3, 0:3] = np.transpose(Tr[0:3, 0:3])
    inv_Tr[0:3, 3] = np.dot(-np.transpose(Tr[0:3, 0:3]), Tr[0:3, 3])
    return inv_Tr

def draw_box3d_lidar(bbox3d, calib, fig):
    # method 1
    # lidar2cam = calib["lidar2cam"]
    # lidar2cam = expand_matrix(lidar2cam)
    # cam2rect_ = calib["rect2ref"]
    # cam2rect = np.eye(4, 4)
    # cam2rect[:3, :3] = cam2rect_
    # lidar2rec = np.dot(lidar2cam, cam2rect)
    # rec2lidar = np.linalg.inv(lidar2rec) #(AB)-1 = B-1@A-1

    # method 2
    lidar2cam_ = calib["lidar2cam"]
    cam2rect_ = calib["rect2ref"]
    cam2rect = np.eye(4, 4)
    cam2rect[:3, :3] = cam2rect_

    # lidar2cam = np.eye(4, 4)
    # lidar2cam[:3, :] = lidar2cam_
    # cam2lidar = np.linalg.inv(lidar2cam)
    cam2lidar_ = inverse_rigid_trans(lidar2cam_)
    cam2lidar = np.eye(4, 4)
    cam2lidar[:3, :] = cam2lidar_

    all_lidar_box3d = []
    for box3d in bbox3d:
        if np.any(box3d[:, 2] < 0.1):
            continue
        box3d = np.concatenate([box3d, np.ones((1, 8))], axis=0)
        box3d_in_refcam = np.dot(np.linalg.inv(cam2rect), box3d)
        lidar_box3d = np.dot(cam2lidar, box3d_in_refcam)[:3, :]
        lidar_box3d = np.transpose(lidar_box3d)
        all_lidar_box3d.append(lidar_box3d)
    print(all_lidar_box3d)
    fig = draw_gt_boxes3d(all_lidar_box3d, fig)
    return fig
可视化结果:
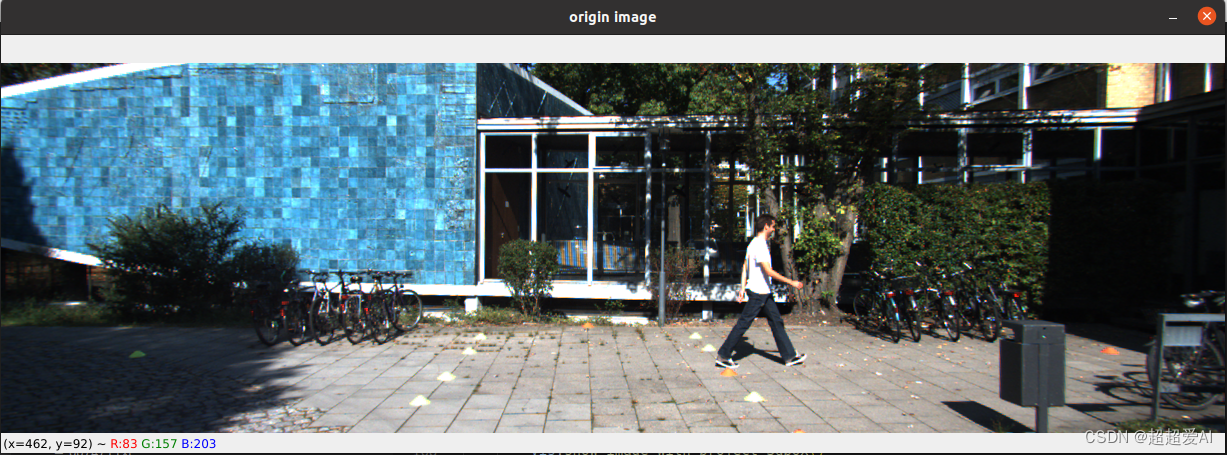
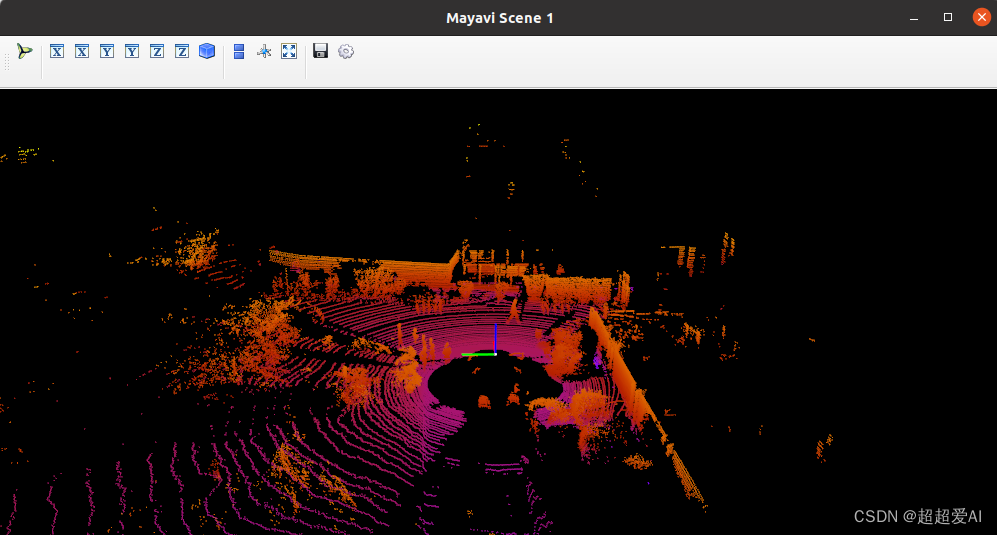
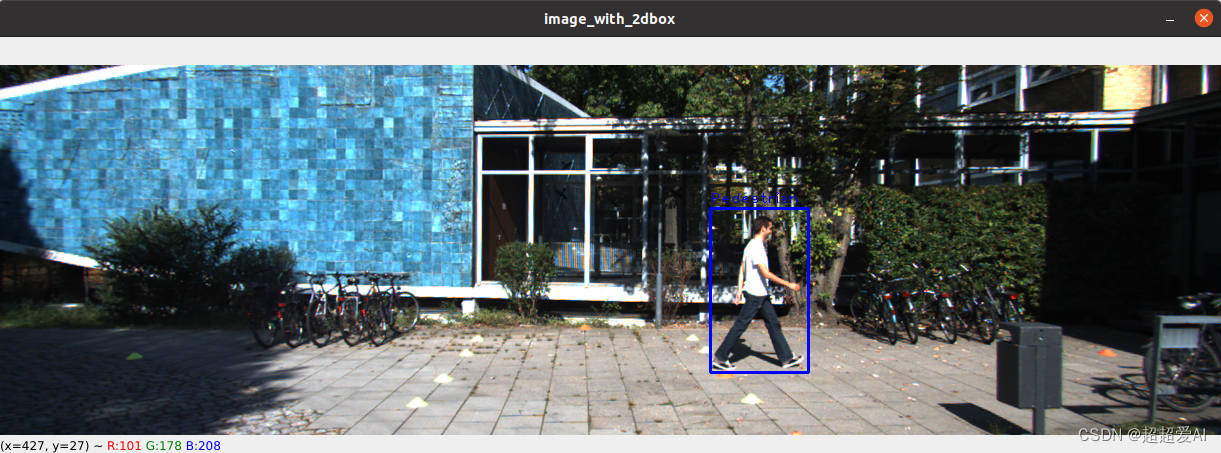
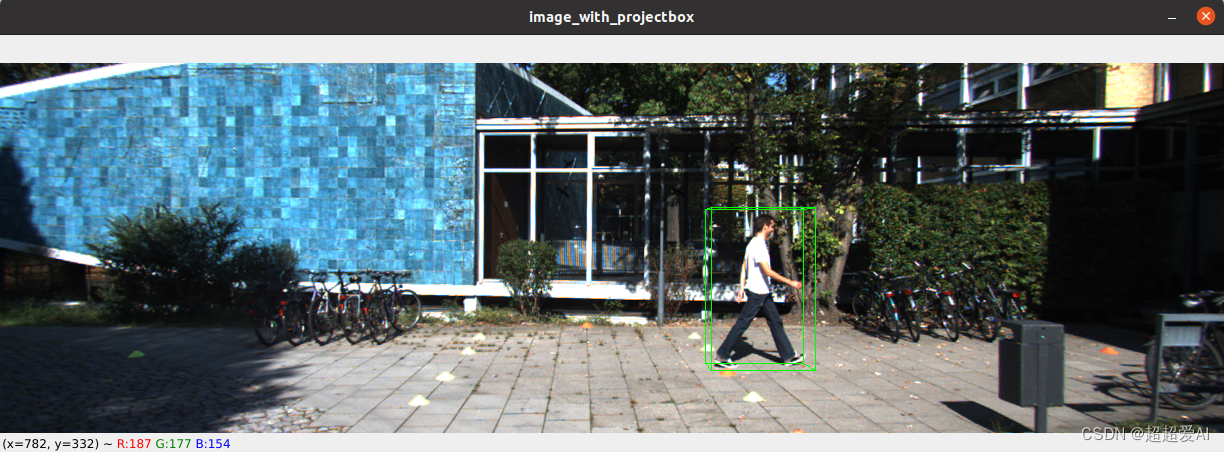
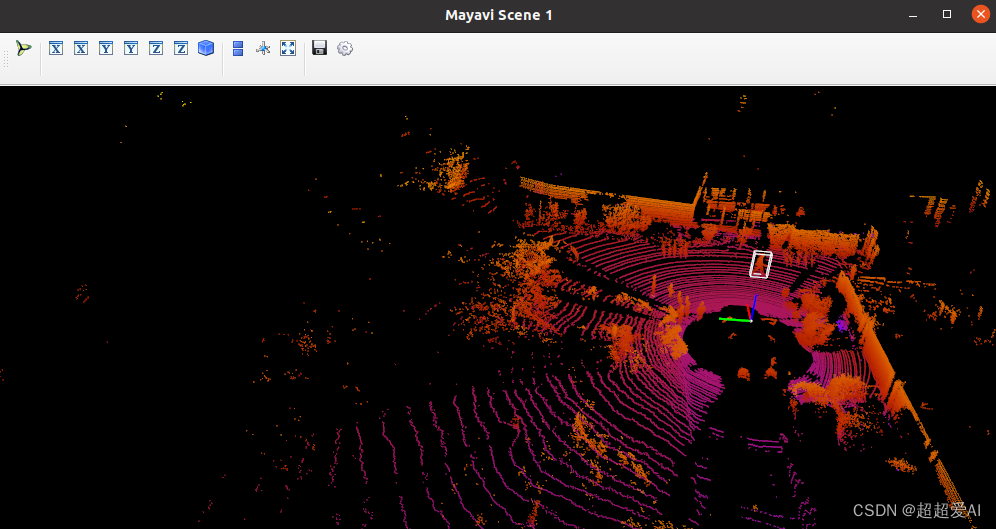
总结
本来是想一行行解释代码的,但是太累,所以就不解释了,自己代码是简化过的,应该很容易看懂。主要参考的kitti_object_vis。
