文章目录
- 1.思路
- 2.部署准备
- 3.Grafana仪表盘json文件下载
- 4.tw嵌入式jar包本地引入依赖并测试运行
- 5.运行jmx_prometheus_javaagent-0.19.0.jar形式获取监控数据(方法一)
- 6.使用Actuator 获取监听数据(方法二)
- 7.Prometheus部署
- 8.Prometheus配置
- 9.安装和配置Grafana
1.思路
Tongweb嵌入式最终是把依赖打入到java应用(也就是jar包里),然后启动jar包进行测试,所以我们需要考虑的是,启动jar包的时候,怎么获取到监控数据。
根据Prometheus+Grafana 监控Tongweb7来看,监控数据是通过jmx_prometheus_javaagent-0.19.0.jar和config.yaml这两个关键文件来获取的,但是这里用的是企业版的部署方式(类似于部署了tomcat然后在tomcat的webapps里部署应用的方式一样)。
所以有两种方式,各位根据自己的需要进行选择:
1.我们可以通过启动参数的形式,启动应用jar包的同时,使用jmx_prometheus_javaagent来配置JMX指标的暴露端口为38061,并指定配置文件为config.yaml,也就是这样的指令来启动jar包,从而方便Prometheus拉取监控数据:
java -javaagent:jmx_prometheus_javaagent-0.19.0.jar=39081:config.yaml -jar spring-boot-accesslog-2.x-0.0.1.jar
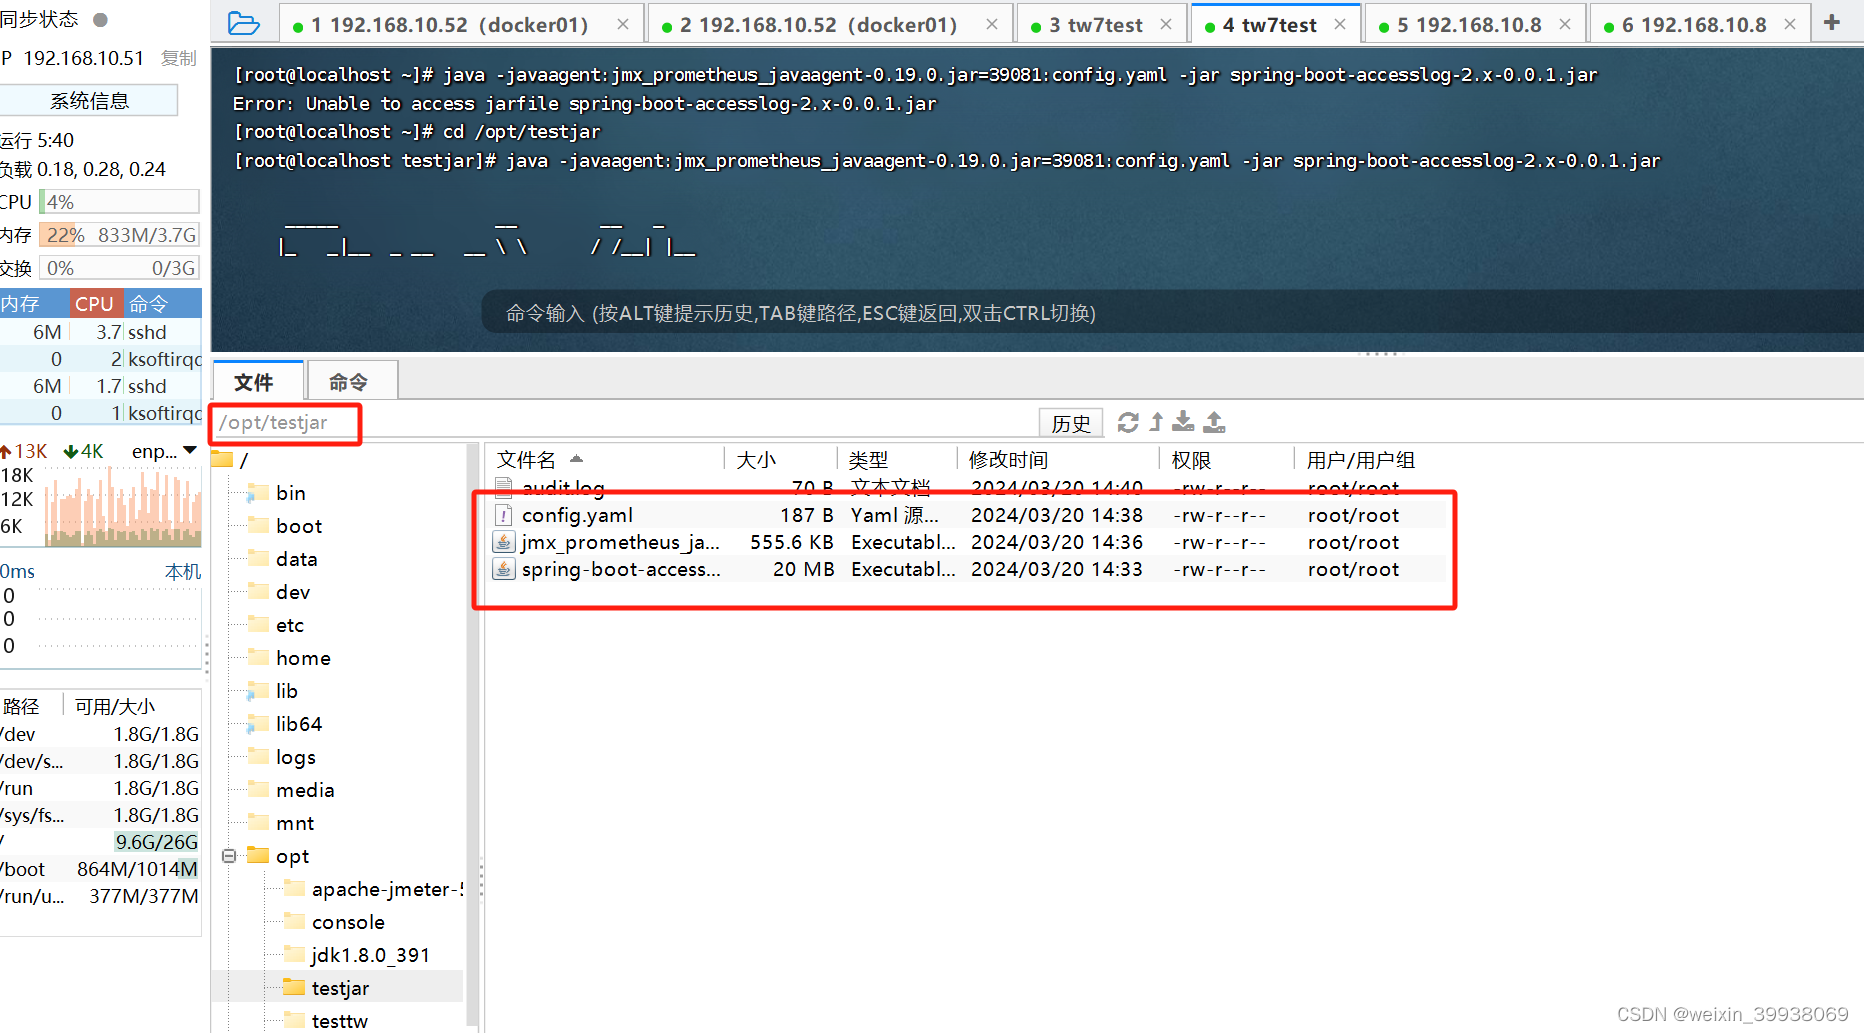
其中config.yaml是相关配置文件,jmx_prometheus_javaagent-0.19.0.jar是拉取监控数据用的jar包,spring-boot-accesslog-2.x-0.0.1.jar是测试用的jar包(已经导入tongweb嵌入式的依赖并打包了),39081是绑定的监听端口(可以自己设置一个没有占用的端口)。
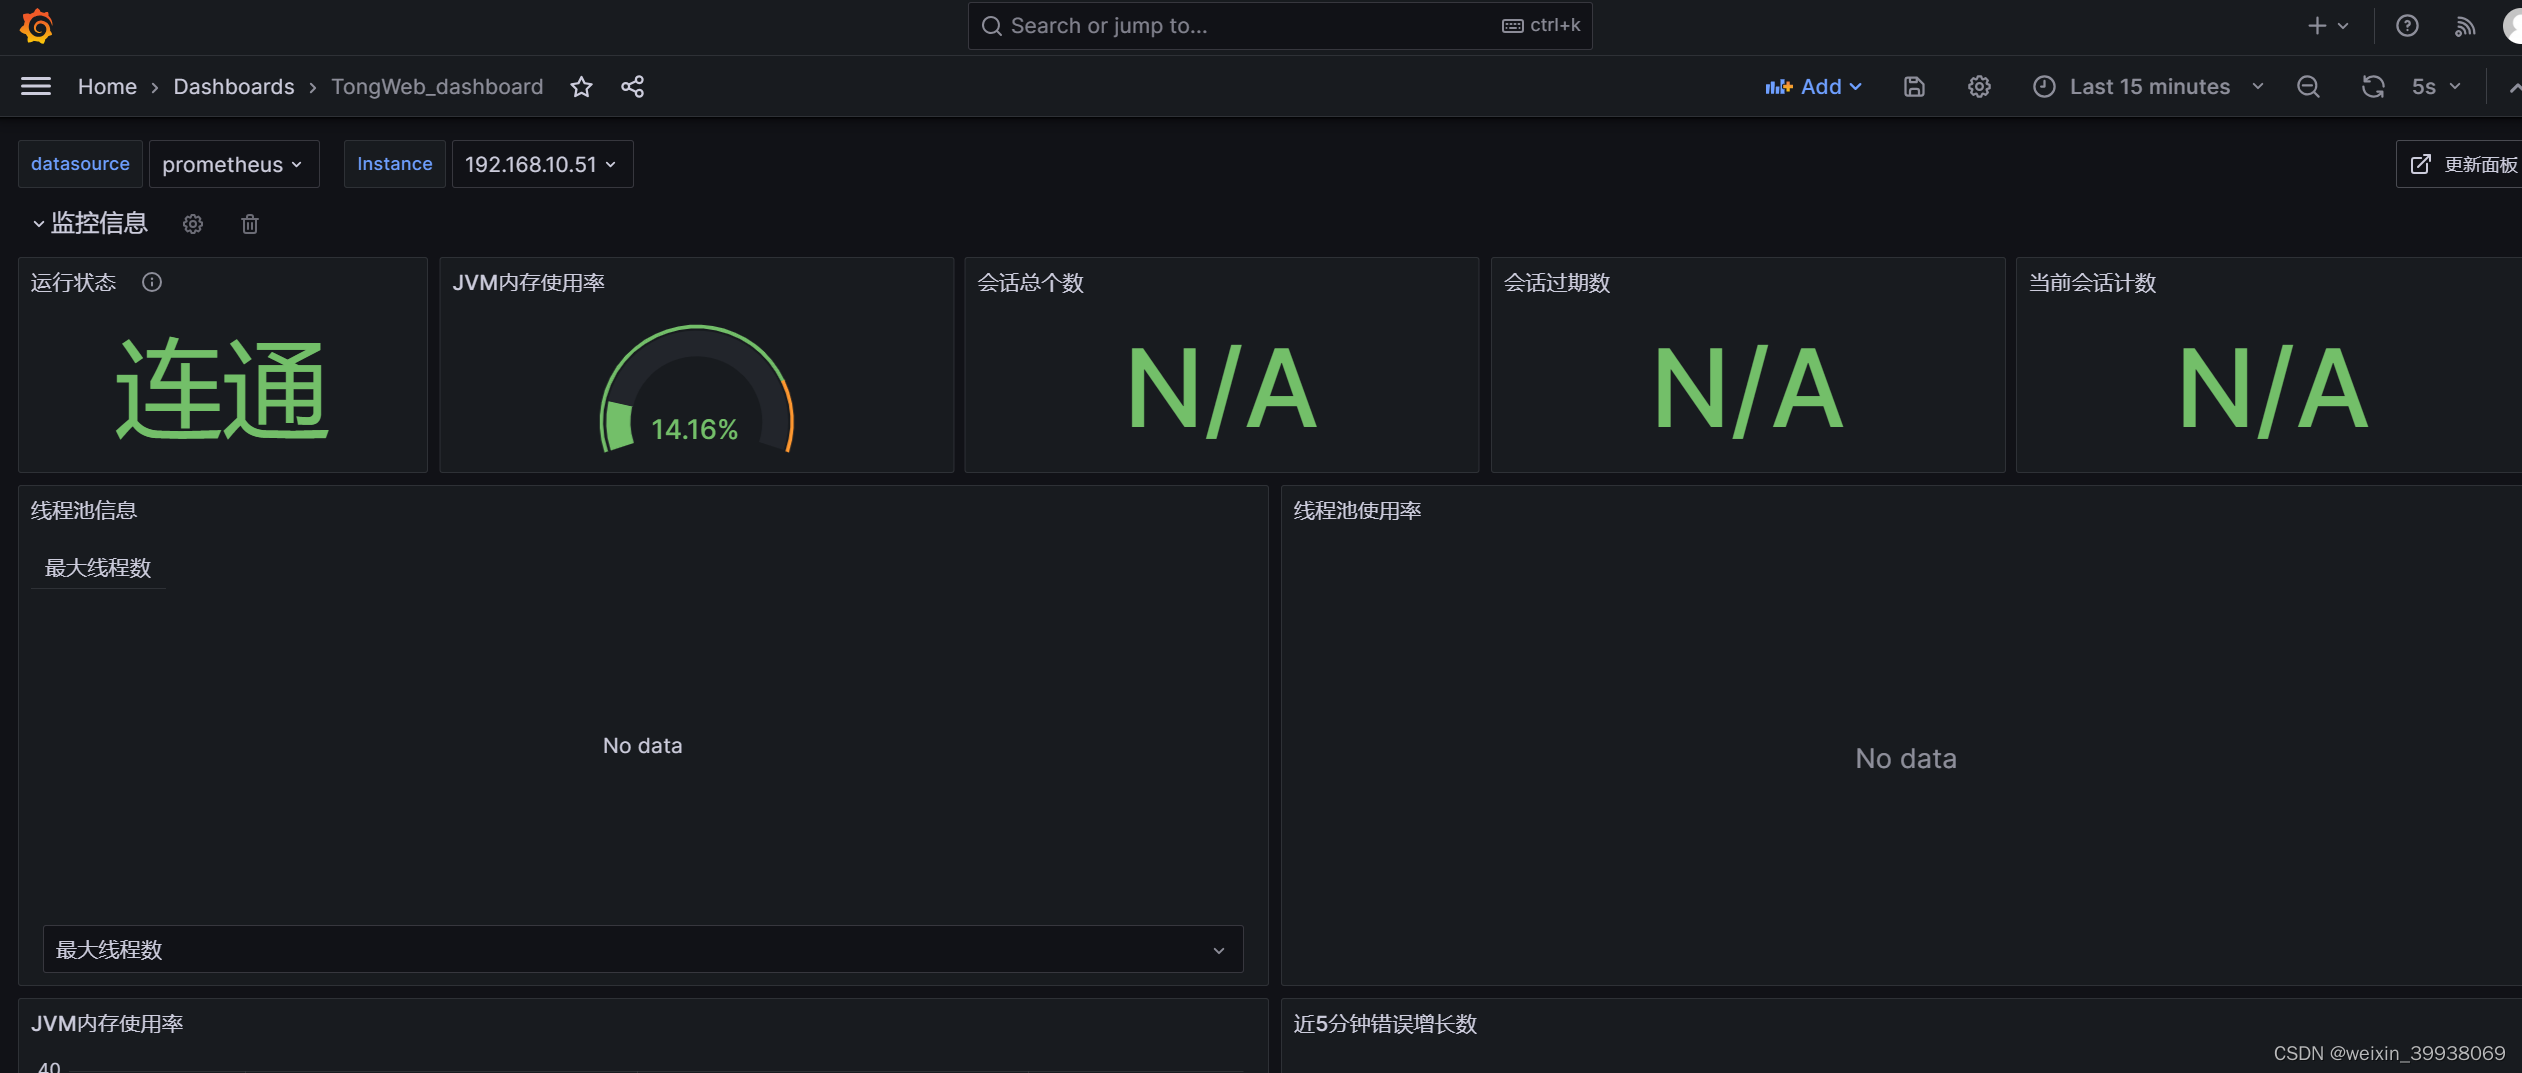
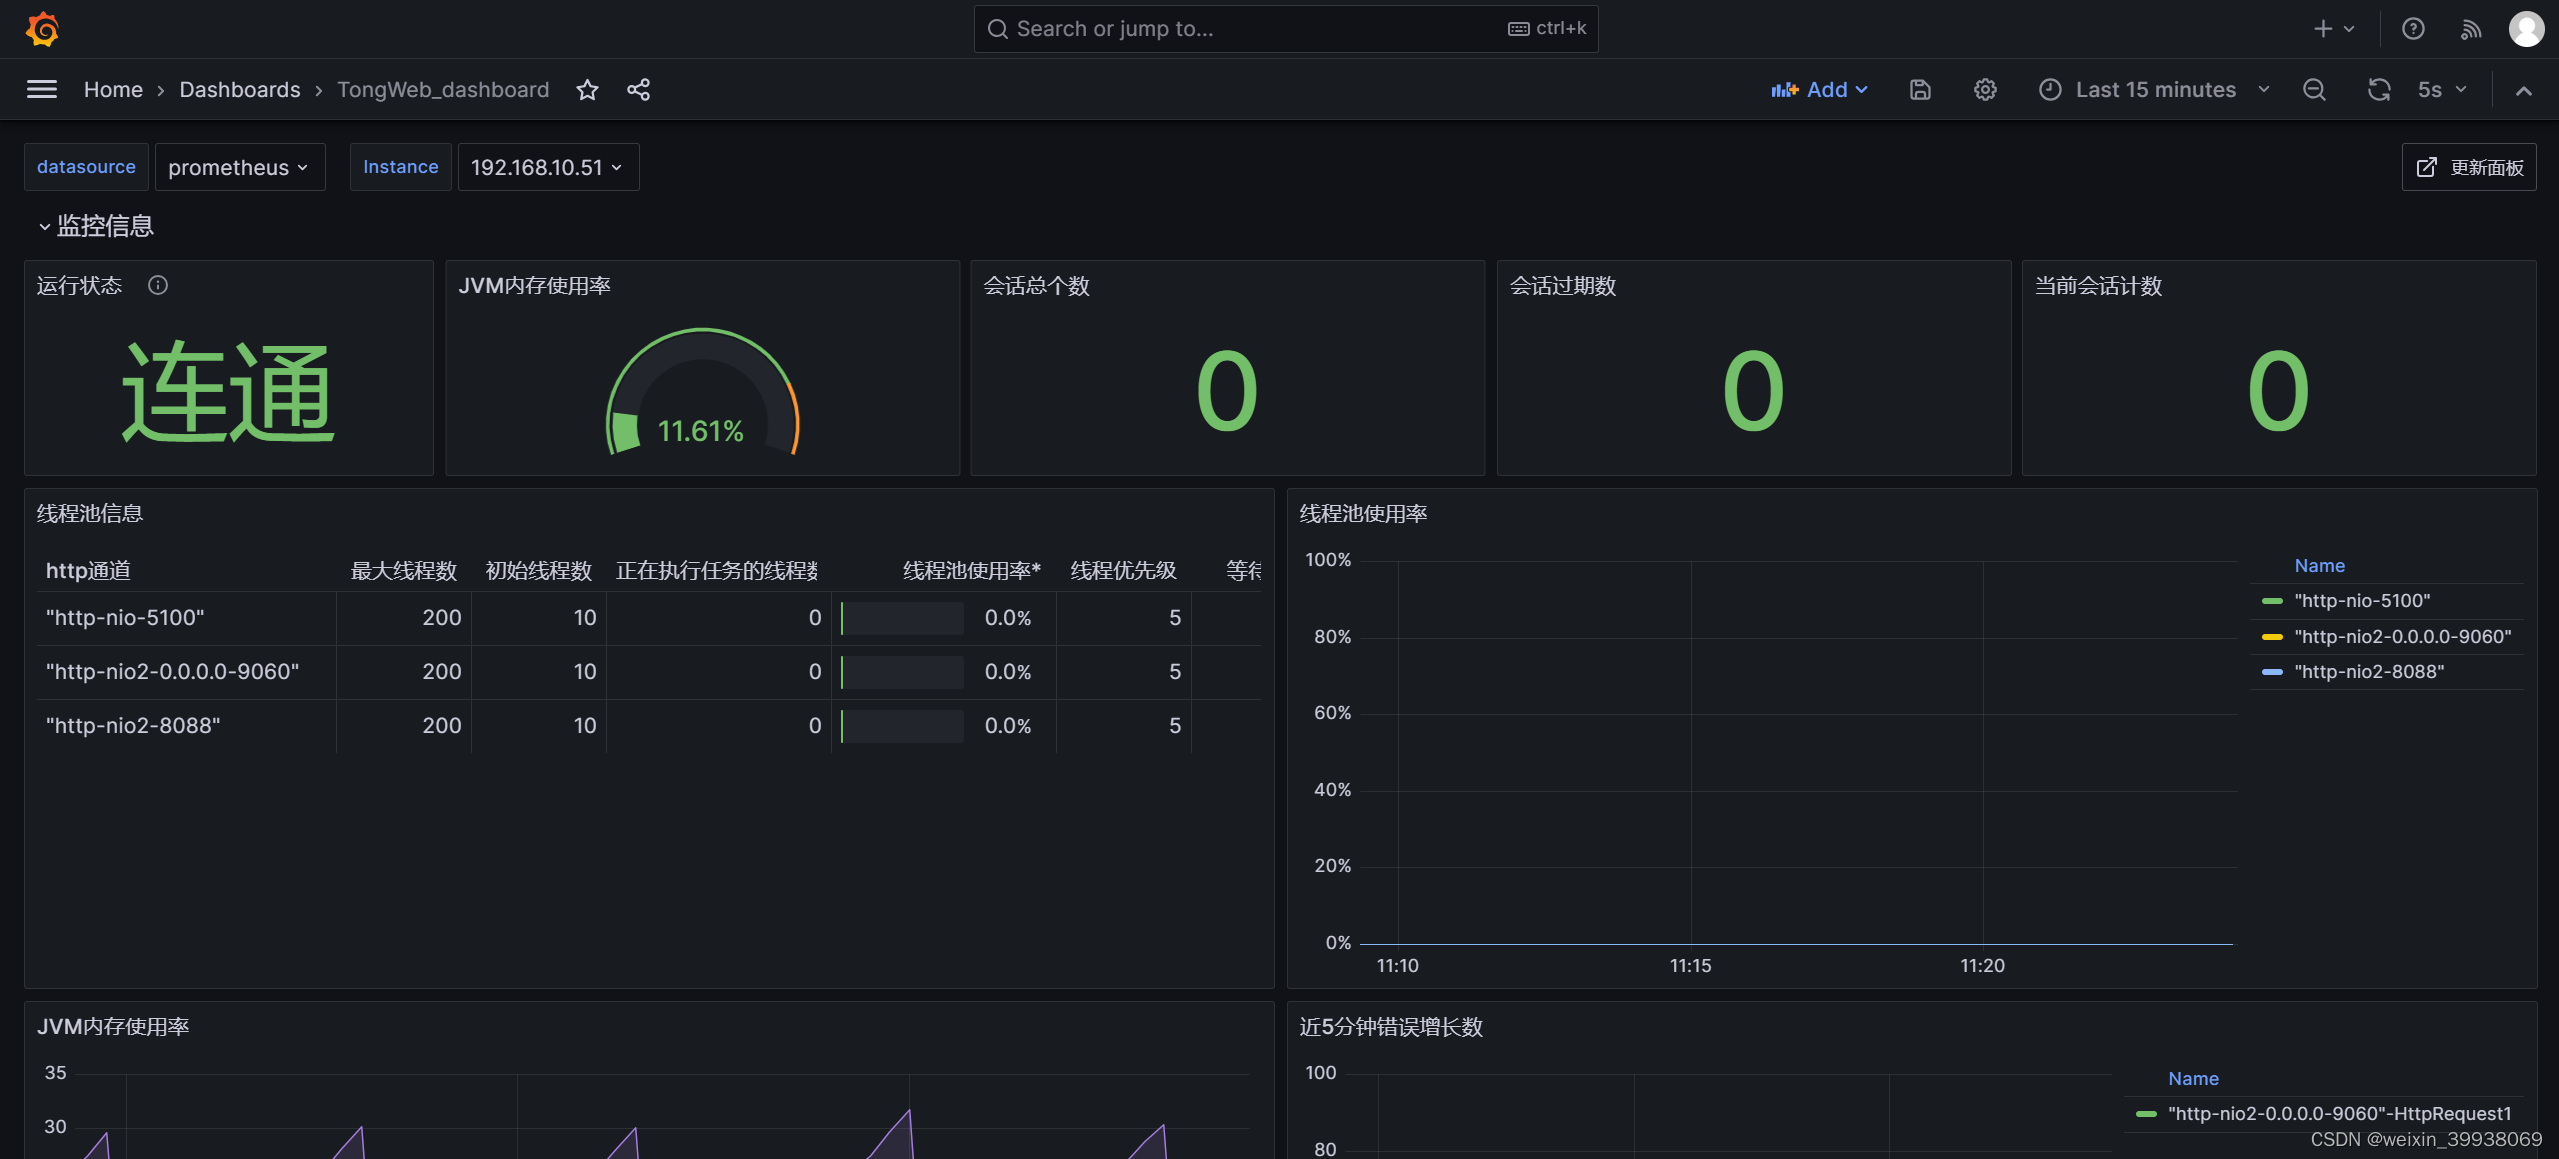
之后访问服务器ip:39081/metrics,如下图所示就说明获取成功了:
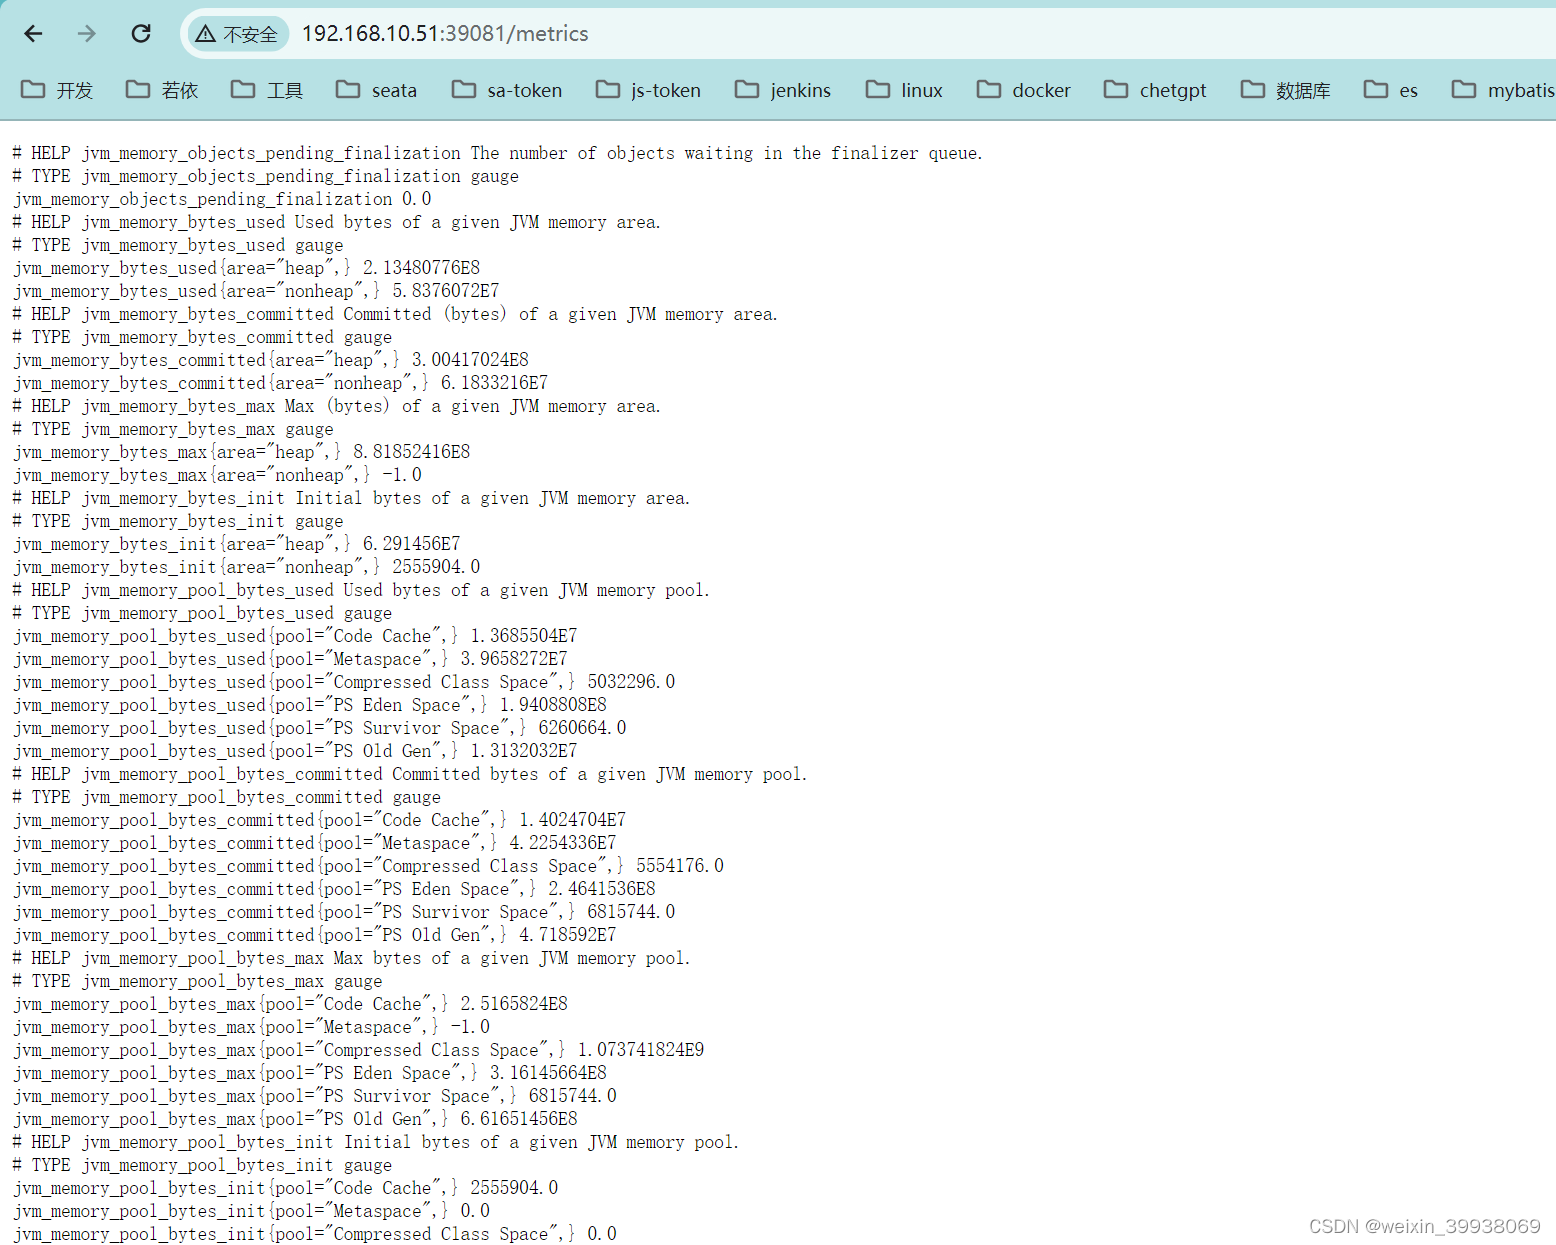
获取成功之后,再部署prometheus和grafana,修改对应配置,配置grafana的数据源和仪表盘即可。
2.参考rometheus监控Spring Boot应用,自定义应用监控指标
使用springboot项目的话,可以引入监控相关的依赖和jar包,再部署prometheus和grafana进行监控。
2.部署准备
本次参考:Prometheus监控Tongweb容器
1.使用虚拟机ip:192.168.10.51(tongweb),192.168.10.52(Prometheus),192.168.10.8(Grafana ),其中51服务器确保9060,39081端口没有被占用,52服务器确保9090端口没有被占用,8服务器确保3000端口没有被占用,三台虚拟机均关闭防火墙。
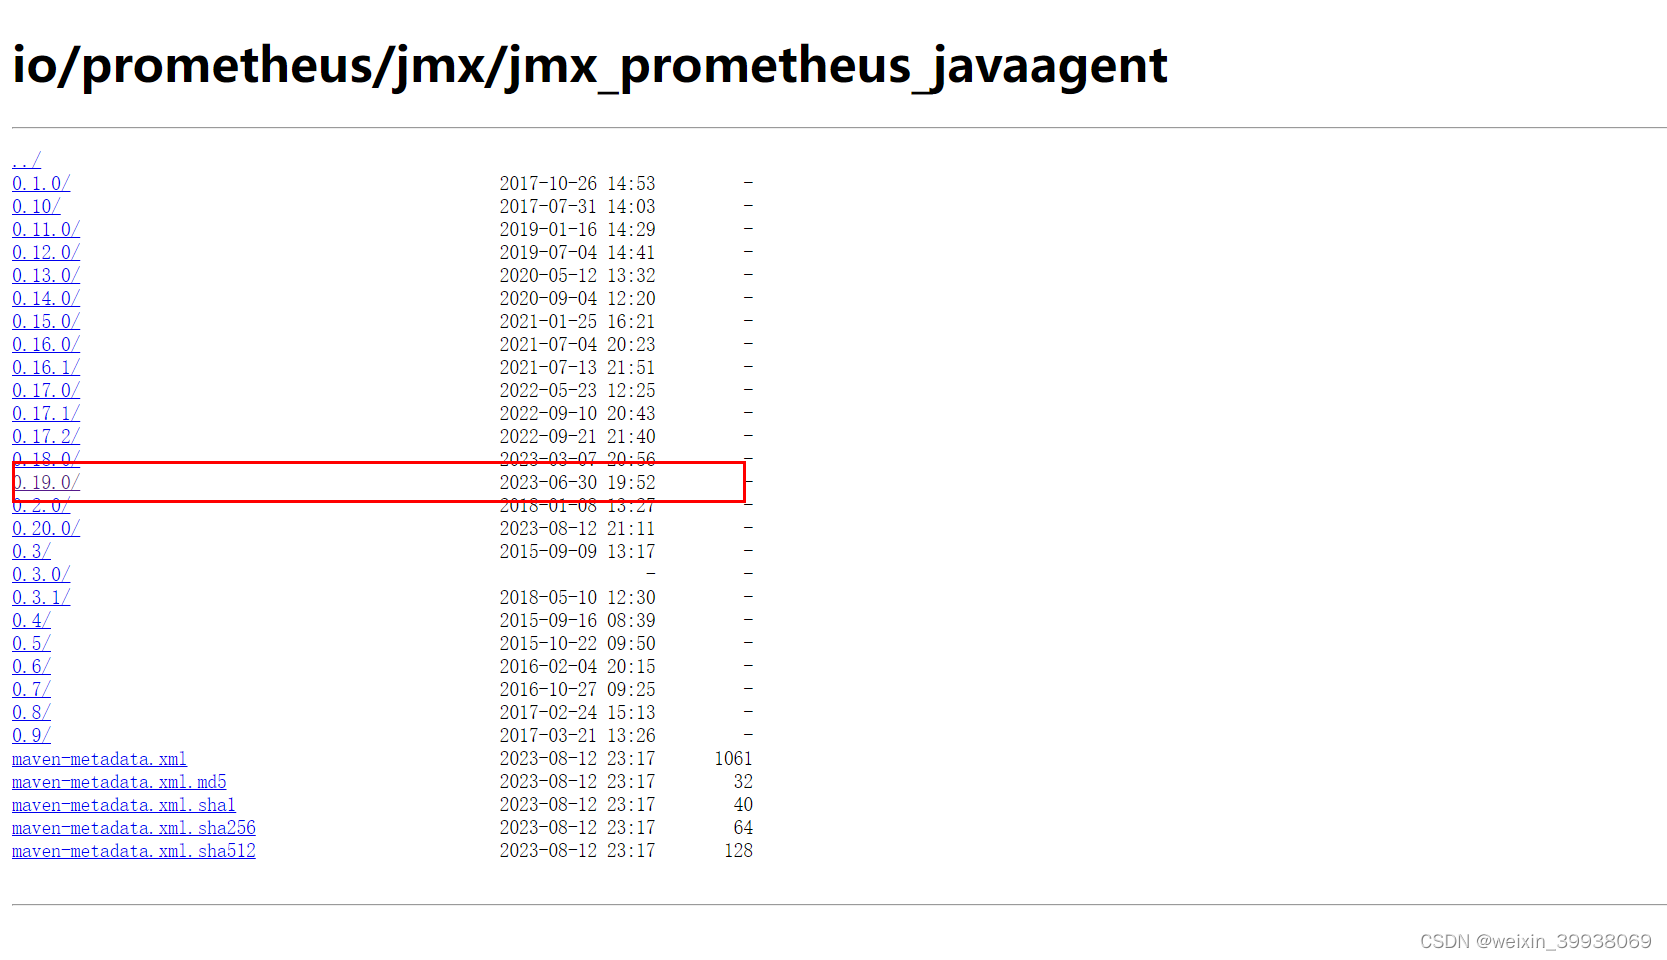
2.使用的jar包:jmx_prometheus_javaagent-0.19.0.jar:jmx_prometheus_javaagent-0.19.0.jar下载链接
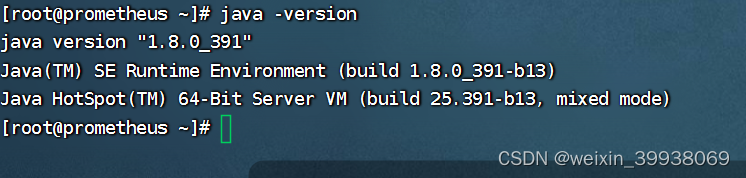
3.使用的jdk环境:jdk1.8(需配置jdk环境变量)
4.下载Grafana使用的仪表盘json文件:
TongWeb 面板,使用JMX Exporter采集数据
也可以自行下载跟tomcat8.5或者jvm相关的json文件仪表盘,这个自行百度。
5.tw7的安装包和授权,其中tw7使用的安装包为TongWeb7.0.4.9_M3_Enterprise_Linux.tar.gz。
3.Grafana仪表盘json文件下载
可以上这个网站下载:
grafana仪表盘官方下载地址
进去后,在这里输入关键字,例如jvm

点击自己想要的仪表盘
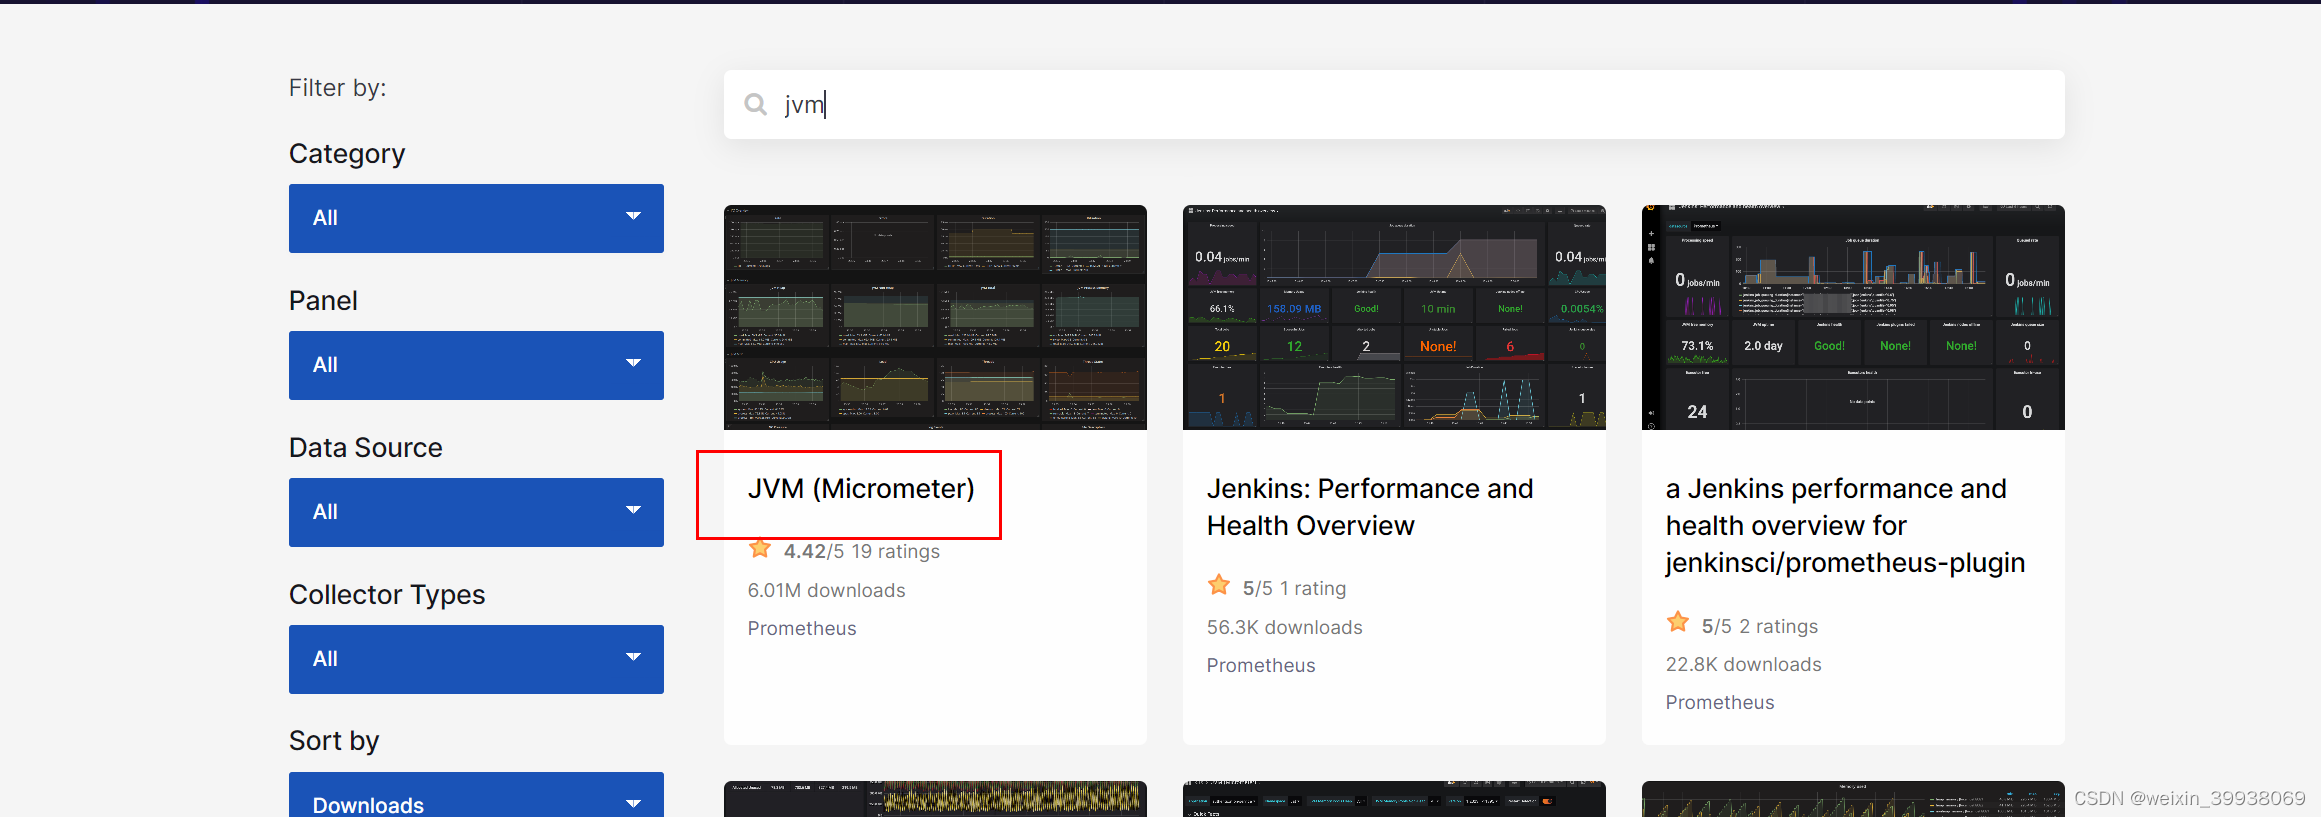
点击这里下载

下面提供两份json模版,自行复制进行测试:
{
"__inputs": [
{
"name": "DS_PROMETHEUS",
"label": "Prometheus",
"description": "",
"type": "datasource",
"pluginId": "prometheus",
"pluginName": "Prometheus"
}
],
"__elements": {},
"__requires": [
{
"type": "panel",
"id": "gauge",
"name": "Gauge",
"version": ""
},
{
"type": "grafana",
"id": "grafana",
"name": "Grafana",
"version": "10.0.1"
},
{
"type": "datasource",
"id": "prometheus",
"name": "Prometheus",
"version": "1.0.0"
},
{
"type": "panel",
"id": "stat",
"name": "Stat",
"version": ""
},
{
"type": "panel",
"id": "table",
"name": "Table",
"version": ""
},
{
"type": "panel",
"id": "timeseries",
"name": "Time series",
"version": ""
}
],
"annotations": {
"list": [
{
"builtIn": 1,
"datasource": {
"type": "datasource",
"uid": "grafana"
},
"enable": true,
"hide": true,
"iconColor": "rgba(0, 211, 255, 1)",
"name": "Annotations & Alerts",
"target": {
"limit": 100,
"matchAny": false,
"tags": [],
"type": "dashboard"
},
"type": "dashboard"
}
]
},
"description": "TongWeb 面板,使用JMX Exporter采集数据",
"editable": true,
"fiscalYearStartMonth": 0,
"gnetId": 19156,
"graphTooltip": 0,
"id": null,
"links": [
{
"asDropdown": false,
"icon": "external link",
"includeVars": false,
"keepTime": false,
"tags": [],
"targetBlank": true,
"title": "更新面板",
"tooltip": "",
"type": "link",
"url": "https://grafana.com/grafana/dashboards/19156"
}
],
"liveNow": false,
"panels": [
{
"collapsed": false,
"datasource": {
"type": "prometheus",
"uid": "fb65406e-39df-40f2-966c-9987082bdcfe"
},
"gridPos": {
"h": 1,
"w": 24,
"x": 0,
"y": 0
},
"id": 31,
"panels": [],
"repeat": "protocol",
"targets": [
{
"datasource": {
"type": "prometheus",
"uid": "fb65406e-39df-40f2-966c-9987082bdcfe"
},
"refId": "A"
}
],
"title": "监控信息",
"type": "row"
},
{
"datasource": {
"type": "prometheus",
"uid": "${DS_PROMETHEUS}"
},
"description": "被监控服务是否处于运行状态,即该服务是否可达。当UP指标的值为1时,表示该服务正在运行,并且可以被访问,当UP指标的值为0时,则表示该服务不可达或处于停止状态。",
"fieldConfig": {
"defaults": {
"color": {
"mode": "thresholds"
},
"mappings": [
{
"options": {
"0": {
"color": "red",
"index": 1,
"text": "未连通"
},
"1": {
"color": "green",
"index": 0,
"text": "连通"
}
},
"type": "value"
},
{
"options": {
"match": "null",
"result": {
"color": "red",
"index": 2,
"text": "未连通"
}
},
"type": "special"
}
],
"thresholds": {
"mode": "absolute",
"steps": [
{
"color": "green",
"value": null
},
{
"color": "red",
"value": 80
}
]
}
},
"overrides": []
},
"gridPos": {
"h": 4,
"w": 4,
"x": 0,
"y": 1
},
"id": 33,
"options": {
"colorMode": "value",
"graphMode": "area",
"justifyMode": "auto",
"orientation": "auto",
"reduceOptions": {
"calcs": [
"lastNotNull"
],
"fields": "",
"values": false
},
"text": {},
"textMode": "auto"
},
"pluginVersion": "10.0.1",
"targets": [
{
"datasource": {
"type": "prometheus",
"uid": "${DS_PROMETHEUS}"
},
"editorMode": "code",
"exemplar": false,
"expr": "up{instance=~\"$instance\"}",
"instant": true,
"interval": "",
"legendFormat": "状态",
"refId": "A"
}
],
"title": "运行状态",
"type": "stat"
},
{
"datasource": {
"type": "prometheus",
"uid": "$datasource"
},
"description": "",
"fieldConfig": {
"defaults": {
"color": {
"mode": "thresholds"
},
"decimals": 2,
"mappings": [
{
"options": {
"match": "null",
"result": {
"text": "N/A"
}
},
"type": "special"
}
],
"thresholds": {
"mode": "absolute",
"steps": [
{
"color": "green",
"value": null
},
{
"color": "orange",
"value": 80
}
]
},
"unit": "percent"
},
"overrides": []
},
"gridPos": {
"h": 4,
"w": 5,
"x": 4,
"y": 1
},
"id": 17,
"links": [],
"maxDataPoints": 100,
"options": {
"orientation": "horizontal",
"reduceOptions": {
"calcs": [
"mean"
],
"fields": "",
"values": false
},
"showThresholdLabels": false,
"showThresholdMarkers": true
},
"pluginVersion": "10.0.1",
"targets": [
{
"datasource": {
"type": "prometheus",
"uid": "${DS_PROMETHEUS}"
},
"editorMode": "code",
"exemplar": false,
"expr": "jvm_memory_bytes_used{area='heap', instance=\"$instance\"}/jvm_memory_bytes_max{area='heap', instance=\"$instance\"}*100",
"format": "time_series",
"instant": true,
"interval": "",
"intervalFactor": 1,
"legendFormat": "",
"refId": "A"
}
],
"title": "JVM内存使用率",
"type": "gauge"
},
{
"datasource": {
"type": "prometheus",
"uid": "$datasource"
},
"fieldConfig": {
"defaults": {
"color": {
"mode": "thresholds"
},
"mappings": [
{
"options": {
"match": "null",
"result": {
"text": "N/A"
}
},
"type": "special"
}
],
"thresholds": {
"mode": "absolute",
"steps": [
{
"color": "green",
"value": null
},
{
"color": "red",
"value": 80
}
]
},
"unit": "none"
},
"overrides": []
},
"gridPos": {
"h": 4,
"w": 5,
"x": 9,
"y": 1
},
"id": 20,
"links": [],
"maxDataPoints": 100,
"options": {
"colorMode": "value",
"graphMode": "none",
"justifyMode": "auto",
"orientation": "horizontal",
"reduceOptions": {
"calcs": [
"mean"
],
"fields": "",
"values": false
},
"textMode": "auto"
},
"pluginVersion": "10.0.1",
"targets": [
{
"datasource": {
"type": "prometheus",
"uid": "${DS_PROMETHEUS}"
},
"editorMode": "code",
"exemplar": false,
"expr": "sum(tongweb_manager_sessioncounter{instance=\"$instance\"})",
"format": "time_series",
"instant": true,
"interval": "",
"intervalFactor": 1,
"legendFormat": "",
"refId": "A"
}
],
"title": "会话总个数",
"type": "stat"
},
{
"datasource": {
"type": "prometheus",
"uid": "$datasource"
},
"fieldConfig": {
"defaults": {
"color": {
"mode": "thresholds"
},
"mappings": [
{
"options": {
"match": "null",
"result": {
"text": "N/A"
}
},
"type": "special"
}
],
"thresholds": {
"mode": "absolute",
"steps": [
{
"color": "green",
"value": null
}
]
},
"unit": "none"
},
"overrides": []
},
"gridPos": {
"h": 4,
"w": 5,
"x": 14,
"y": 1
},
"id": 21,
"links": [],
"maxDataPoints": 100,
"options": {
"colorMode": "value",
"graphMode": "none",
"justifyMode": "auto",
"orientation": "horizontal",
"reduceOptions": {
"calcs": [
"mean"
],
"fields": "",
"values": false
},
"textMode": "auto"
},
"pluginVersion": "10.0.1",
"targets": [
{
"datasource": {
"type": "prometheus",
"uid": "${DS_PROMETHEUS}"
},
"editorMode": "code",
"exemplar": false,
"expr": "sum(tongweb_manager_expiredsessions{instance=\"$instance\"}) ",
"format": "time_series",
"instant": true,
"interval": "",
"intervalFactor": 1,
"legendFormat": "",
"refId": "A"
}
],
"title": "会话过期数",
"type": "stat"
},
{
"datasource": {
"type": "prometheus",
"uid": "$datasource"
},
"fieldConfig": {
"defaults": {
"color": {
"mode": "thresholds"
},
"mappings": [
{
"options": {
"match": "null",
"result": {
"text": "N/A"
}
},
"type": "special"
}
],
"thresholds": {
"mode": "absolute",
"steps": [
{
"color": "green",
"value": null
},
{
"color": "red",
"value": 80
}
]
},
"unit": "none"
},
"overrides": []
},
"gridPos": {
"h": 4,
"w": 5,
"x": 19,
"y": 1
},
"id": 19,
"links": [],
"maxDataPoints": 100,
"options": {
"colorMode": "value",
"graphMode": "none",
"justifyMode": "auto",
"orientation": "horizontal",
"reduceOptions": {
"calcs": [
"mean"
],
"fields": "",
"values": false
},
"textMode": "auto"
},
"pluginVersion": "10.0.1",
"targets": [
{
"datasource": {
"type": "prometheus",
"uid": "${DS_PROMETHEUS}"
},
"editorMode": "code",
"exemplar": false,
"expr": "sum(tongweb_manager_sessioncounter{ instance=\"$instance\"} - tongweb_manager_expiredsessions{instance=\"$instance\"})",
"format": "time_series",
"instant": true,
"interval": "",
"intervalFactor": 1,
"legendFormat": "",
"refId": "A"
}
],
"title": "当前会话计数",
"type": "stat"
},
{
"datasource": {
"type": "prometheus",
"uid": "$datasource"
},
"description": "",
"fieldConfig": {
"defaults": {
"color": {
"mode": "thresholds"
},
"custom": {
"align": "auto",
"cellOptions": {
"type": "auto"
},
"inspect": false
},
"mappings": [
{
"options": {
"match": "null",
"result": {
"text": "N/A"
}
},
"type": "special"
}
],
"min": 0,
"thresholds": {
"mode": "absolute",
"steps": [
{
"color": "green",
"value": null
}
]
},
"unit": "none"
},
"overrides": [
{
"matcher": {
"id": "byName",
"options": "线程池使用率*"
},
"properties": [
{
"id": "color",
"value": {
"mode": "continuous-GrYlRd"
}
},
{
"id": "custom.cellOptions",
"value": {
"mode": "gradient",
"type": "gauge"
}
},
{
"id": "unit",
"value": "percent"
},
{
"id": "decimals",
"value": 1
},
{
"id": "min",
"value": -1
},
{
"id": "thresholds",
"value": {
"mode": "absolute",
"steps": [
{
"color": "green",
"value": null
},
{
"color": "red",
"value": 80
}
]
}
},
{
"id": "max",
"value": 100
}
]
},
{
"matcher": {
"id": "byName",
"options": "http通道"
},
"properties": [
{
"id": "custom.width",
"value": 200
}
]
},
{
"matcher": {
"id": "byName",
"options": "最大线程数"
},
"properties": [
{
"id": "custom.width",
"value": 90
}
]
},
{
"matcher": {
"id": "byName",
"options": "初始线程数"
},
"properties": [
{
"id": "custom.width",
"value": 90
}
]
},
{
"matcher": {
"id": "byName",
"options": "线程优先级"
},
"properties": [
{
"id": "custom.width",
"value": 90
}
]
},
{
"matcher": {
"id": "byName",
"options": "等待队列"
},
"properties": [
{
"id": "custom.width",
"value": 90
}
]
}
]
},
"gridPos": {
"h": 9,
"w": 12,
"x": 0,
"y": 5
},
"id": 14,
"links": [],
"maxDataPoints": 100,
"options": {
"cellHeight": "sm",
"footer": {
"countRows": false,
"fields": "",
"reducer": [
"sum"
],
"show": false
},
"showHeader": true,
"sortBy": [
{
"desc": true,
"displayName": "线程池使用率"
}
]
},
"pluginVersion": "10.0.1",
"targets": [
{
"datasource": {
"type": "prometheus",
"uid": "${DS_PROMETHEUS}"
},
"editorMode": "code",
"exemplar": false,
"expr": "tongweb_threadpool_maxthreads{ instance=\"$instance\"}",
"format": "table",
"hide": false,
"instant": true,
"interval": "",
"intervalFactor": 1,
"legendFormat": "{{name}}-最大线程数",
"range": false,
"refId": "A"
},
{
"datasource": {
"type": "prometheus",
"uid": "$datasource"
},
"editorMode": "code",
"exemplar": false,
"expr": "tongweb_threadpool_minsparethreads{instance=\"$instance\"}",
"format": "table",
"hide": false,
"instant": true,
"legendFormat": "{{name}}-使用线程数",
"range": false,
"refId": "B"
},
{
"datasource": {
"type": "prometheus",
"uid": "$datasource"
},
"editorMode": "code",
"exemplar": false,
"expr": "tongweb_threadpool_connectioncount{ instance=\"$instance\"}",
"format": "table",
"hide": false,
"instant": true,
"legendFormat": "{{name}}",
"range": false,
"refId": "C"
},
{
"datasource": {
"type": "prometheus",
"uid": "$datasource"
},
"editorMode": "code",
"exemplar": false,
"expr": "tongweb_threadpool_connectioncount{ instance=\"$instance\"}/tongweb_threadpool_maxthreads{ instance=\"$instance\"}*100",
"format": "table",
"hide": false,
"instant": true,
"range": false,
"refId": "D"
},
{
"datasource": {
"type": "prometheus",
"uid": "$datasource"
},
"editorMode": "code",
"exemplar": false,
"expr": "tongweb_threadpool_threadpriority{instance=\"$instance\"}",
"format": "table",
"hide": false,
"instant": true,
"range": false,
"refId": "E"
},
{
"datasource": {
"type": "prometheus",
"uid": "$datasource"
},
"editorMode": "code",
"exemplar": false,
"expr": "tongweb_threadpool_backlog{instance=\"$instance\"}",
"format": "table",
"hide": false,
"instant": true,
"range": false,
"refId": "F"
}
],
"title": "线程池信息",
"transformations": [
{
"id": "filterFieldsByName",
"options": {
"include": {
"pattern": "/^Value #[A-Z]|^name$/"
}
}
},
{
"id": "merge",
"options": {}
},
{
"id": "organize",
"options": {
"excludeByName": {},
"indexByName": {},
"renameByName": {
"Value #A": "最大线程数",
"Value #B": "初始线程数",
"Value #C": "正在执行任务的线程数*",
"Value #D": "线程池使用率*",
"Value #E": "线程优先级",
"Value #F": "等待队列",
"name": "http通道"
}
}
},
{
"id": "groupBy",
"options": {
"fields": {
"Value #E": {
"aggregations": [],
"operation": "groupby"
},
"http通道": {
"aggregations": [],
"operation": "groupby"
},
"初始线程数": {
"aggregations": [
"lastNotNull"
],
"operation": "groupby"
},
"最大线程数": {
"aggregations": [],
"operation": "groupby"
},
"正在执行任务的线程数": {
"aggregations": [],
"operation": "groupby"
},
"正在执行任务的线程数*": {
"aggregations": [],
"operation": "groupby"
},
"等待队列": {
"aggregations": [],
"operation": "groupby"
},
"线程优先级": {
"aggregations": [],
"operation": "groupby"
},
"线程池使用率": {
"aggregations": [],
"operation": "groupby"
},
"线程池使用率*": {
"aggregations": [],
"operation": "groupby"
}
}
}
}
],
"type": "table"
},
{
"datasource": {
"type": "prometheus",
"uid": "${DS_PROMETHEUS}"
},
"fieldConfig": {
"defaults": {
"color": {
"mode": "palette-classic"
},
"custom": {
"axisCenteredZero": false,
"axisColorMode": "text",
"axisLabel": "",
"axisPlacement": "auto",
"barAlignment": 0,
"drawStyle": "line",
"fillOpacity": 6,
"gradientMode": "none",
"hideFrom": {
"legend": false,
"tooltip": false,
"viz": false
},
"lineInterpolation": "linear",
"lineWidth": 1,
"pointSize": 1,
"scaleDistribution": {
"type": "linear"
},
"showPoints": "auto",
"spanNulls": false,
"stacking": {
"group": "A",
"mode": "none"
},
"thresholdsStyle": {
"mode": "off"
}
},
"mappings": [],
"thresholds": {
"mode": "absolute",
"steps": [
{
"color": "green",
"value": null
},
{
"color": "red",
"value": 80
}
]
},
"unit": "percent"
},
"overrides": []
},
"gridPos": {
"h": 9,
"w": 12,
"x": 12,
"y": 5
},
"id": 40,
"options": {
"legend": {
"calcs": [],
"displayMode": "table",
"placement": "right",
"showLegend": true
},
"tooltip": {
"mode": "single",
"sort": "none"
}
},
"targets": [
{
"datasource": {
"type": "prometheus",
"uid": "${DS_PROMETHEUS}"
},
"editorMode": "code",
"expr": "tongweb_threadpool_connectioncount{ instance=\"$instance\"}/tongweb_threadpool_maxthreads{ instance=\"$instance\"}*100",
"instant": false,
"legendFormat": "{{name}}",
"range": true,
"refId": "A"
}
],
"title": "线程池使用率",
"type": "timeseries"
},
{
"datasource": {
"type": "prometheus",
"uid": "$datasource"
},
"description": "",
"fieldConfig": {
"defaults": {
"color": {
"mode": "continuous-BlPu"
},
"custom": {
"axisCenteredZero": false,
"axisColorMode": "text",
"axisLabel": "",
"axisPlacement": "auto",
"barAlignment": 0,
"drawStyle": "line",
"fillOpacity": 14,
"gradientMode": "none",
"hideFrom": {
"legend": false,
"tooltip": false,
"viz": false
},
"lineInterpolation": "linear",
"lineStyle": {
"fill": "solid"
},
"lineWidth": 1,
"pointSize": 1,
"scaleDistribution": {
"type": "linear"
},
"showPoints": "auto",
"spanNulls": false,
"stacking": {
"group": "A",
"mode": "none"
},
"thresholdsStyle": {
"mode": "off"
}
},
"mappings": [],
"thresholds": {
"mode": "absolute",
"steps": [
{
"color": "green",
"value": null
},
{
"color": "red",
"value": 80
}
]
}
},
"overrides": []
},
"gridPos": {
"h": 9,
"w": 12,
"x": 0,
"y": 14
},
"id": 39,
"links": [],
"maxDataPoints": 100,
"options": {
"legend": {
"calcs": [],
"displayMode": "list",
"placement": "bottom",
"showLegend": true
},
"tooltip": {
"mode": "single",
"sort": "none"
}
},
"pluginVersion": "10.0.1",
"targets": [
{
"datasource": {
"type": "prometheus",
"uid": "${DS_PROMETHEUS}"
},
"editorMode": "code",
"exemplar": false,
"expr": "jvm_memory_bytes_used{area='heap', instance=\"$instance\"}/jvm_memory_bytes_max{area='heap', instance=\"$instance\"}*100",
"format": "time_series",
"instant": false,
"interval": "",
"intervalFactor": 1,
"legendFormat": "内存使用率",
"range": true,
"refId": "A"
}
],
"title": "JVM内存使用率",
"type": "timeseries"
},
{
"datasource": {
"type": "prometheus",
"uid": "${DS_PROMETHEUS}"
},
"fieldConfig": {
"defaults": {
"color": {
"mode": "palette-classic"
},
"custom": {
"axisCenteredZero": false,
"axisColorMode": "text",
"axisLabel": "",
"axisPlacement": "auto",
"barAlignment": 0,
"drawStyle": "line",
"fillOpacity": 6,
"gradientMode": "none",
"hideFrom": {
"legend": false,
"tooltip": false,
"viz": false
},
"lineInterpolation": "linear",
"lineWidth": 1,
"pointSize": 1,
"scaleDistribution": {
"type": "linear"
},
"showPoints": "auto",
"spanNulls": false,
"stacking": {
"group": "A",
"mode": "none"
},
"thresholdsStyle": {
"mode": "off"
}
},
"mappings": [],
"thresholds": {
"mode": "absolute",
"steps": [
{
"color": "green",
"value": null
},
{
"color": "red",
"value": 80
}
]
}
},
"overrides": []
},
"gridPos": {
"h": 9,
"w": 12,
"x": 12,
"y": 14
},
"id": 41,
"options": {
"legend": {
"calcs": [],
"displayMode": "table",
"placement": "right",
"showLegend": true
},
"tooltip": {
"mode": "single",
"sort": "none"
}
},
"targets": [
{
"datasource": {
"type": "prometheus",
"uid": "${DS_PROMETHEUS}"
},
"editorMode": "code",
"expr": "increase(tongweb_requestprocessor_errorcount{instance=\"$instance\"}[5m])",
"instant": false,
"legendFormat": "{{worker}}-{{name}}",
"range": true,
"refId": "A"
}
],
"title": "近5分钟错误增长数",
"type": "timeseries"
},
{
"datasource": {
"type": "prometheus",
"uid": "$datasource"
},
"description": "",
"fieldConfig": {
"defaults": {
"color": {
"mode": "palette-classic"
},
"custom": {
"axisCenteredZero": false,
"axisColorMode": "text",
"axisLabel": "",
"axisPlacement": "auto",
"barAlignment": 0,
"drawStyle": "line",
"fillOpacity": 8,
"gradientMode": "none",
"hideFrom": {
"legend": false,
"tooltip": false,
"viz": false
},
"lineInterpolation": "linear",
"lineWidth": 1,
"pointSize": 1,
"scaleDistribution": {
"type": "linear"
},
"showPoints": "auto",
"spanNulls": false,
"stacking": {
"group": "A",
"mode": "none"
},
"thresholdsStyle": {
"mode": "off"
}
},
"mappings": [
{
"options": {
"match": "null",
"result": {
"text": "N/A"
}
},
"type": "special"
}
],
"thresholds": {
"mode": "absolute",
"steps": [
{
"color": "green",
"value": null
},
{
"color": "red",
"value": 80
}
]
},
"unit": "ms"
},
"overrides": []
},
"gridPos": {
"h": 9,
"w": 12,
"x": 0,
"y": 23
},
"id": 35,
"links": [],
"maxDataPoints": 100,
"options": {
"legend": {
"calcs": [],
"displayMode": "list",
"placement": "right",
"showLegend": true
},
"tooltip": {
"mode": "single",
"sort": "none"
}
},
"pluginVersion": "10.0.1",
"targets": [
{
"datasource": {
"type": "prometheus",
"uid": "${DS_PROMETHEUS}"
},
"editorMode": "code",
"exemplar": false,
"expr": "sum(increase(tongweb_requestprocessor_processingtime{instance=\"$instance\"}[5m])) by (worker) / (count(tongweb_requestprocessor_processingtime{instance=\"$instance\"}) by (worker)+0.01) ",
"format": "time_series",
"instant": false,
"interval": "",
"intervalFactor": 1,
"legendFormat": "{{worker}}",
"range": true,
"refId": "A"
}
],
"title": "平均响应时长",
"type": "timeseries"
},
{
"datasource": {
"type": "prometheus",
"uid": "$datasource"
},
"description": "",
"fieldConfig": {
"defaults": {
"color": {
"mode": "palette-classic"
},
"custom": {
"axisCenteredZero": false,
"axisColorMode": "text",
"axisLabel": "",
"axisPlacement": "auto",
"barAlignment": 0,
"drawStyle": "line",
"fillOpacity": 11,
"gradientMode": "none",
"hideFrom": {
"legend": false,
"tooltip": false,
"viz": false
},
"lineInterpolation": "linear",
"lineWidth": 1,
"pointSize": 1,
"scaleDistribution": {
"type": "linear"
},
"showPoints": "auto",
"spanNulls": false,
"stacking": {
"group": "A",
"mode": "none"
},
"thresholdsStyle": {
"mode": "off"
}
},
"decimals": 2,
"mappings": [
{
"options": {
"match": "null",
"result": {
"text": "N/A"
}
},
"type": "special"
}
],
"thresholds": {
"mode": "absolute",
"steps": [
{
"color": "green",
"value": null
},
{
"color": "orange",
"value": 80
}
]
},
"unit": "percent"
},
"overrides": []
},
"gridPos": {
"h": 9,
"w": 12,
"x": 12,
"y": 23
},
"id": 37,
"links": [],
"maxDataPoints": 100,
"options": {
"legend": {
"calcs": [],
"displayMode": "list",
"placement": "bottom",
"showLegend": true
},
"tooltip": {
"mode": "single",
"sort": "none"
}
},
"pluginVersion": "10.0.1",
"targets": [
{
"datasource": {
"type": "prometheus",
"uid": "${DS_PROMETHEUS}"
},
"editorMode": "code",
"exemplar": false,
"expr": "jvm_memory_pool_bytes_used{ instance=\"$instance\", pool!=\"Metaspace\"}/jvm_memory_pool_bytes_max{ instance=\"$instance\", pool!=\"Metaspace\"}*100",
"format": "time_series",
"instant": false,
"interval": "",
"intervalFactor": 1,
"legendFormat": "{{pool}}",
"range": true,
"refId": "A"
}
],
"title": "JVM内存池使用率",
"type": "timeseries"
},
{
"datasource": {
"type": "prometheus",
"uid": "$datasource"
},
"description": "",
"fieldConfig": {
"defaults": {
"color": {
"mode": "palette-classic"
},
"custom": {
"axisCenteredZero": false,
"axisColorMode": "text",
"axisLabel": "",
"axisPlacement": "auto",
"barAlignment": 0,
"drawStyle": "line",
"fillOpacity": 10,
"gradientMode": "none",
"hideFrom": {
"legend": false,
"tooltip": false,
"viz": false
},
"lineInterpolation": "linear",
"lineWidth": 1,
"pointSize": 5,
"scaleDistribution": {
"type": "linear"
},
"showPoints": "never",
"spanNulls": false,
"stacking": {
"group": "A",
"mode": "none"
},
"thresholdsStyle": {
"mode": "off"
}
},
"decimals": 0,
"mappings": [],
"thresholds": {
"mode": "absolute",
"steps": [
{
"color": "green",
"value": null
},
{
"color": "red",
"value": 80
}
]
},
"unit": "none"
},
"overrides": [
{
"matcher": {
"id": "byValue",
"options": {
"op": "gte",
"reducer": "allIsZero",
"value": 0
}
},
"properties": [
{
"id": "custom.hideFrom",
"value": {
"legend": true,
"tooltip": true,
"viz": false
}
}
]
}
]
},
"gridPos": {
"h": 9,
"w": 12,
"x": 0,
"y": 32
},
"id": 23,
"links": [],
"options": {
"legend": {
"calcs": [],
"displayMode": "table",
"placement": "right",
"showLegend": true
},
"tooltip": {
"mode": "multi",
"sort": "none"
}
},
"pluginVersion": "10.0.1",
"targets": [
{
"datasource": {
"type": "prometheus",
"uid": "${DS_PROMETHEUS}"
},
"editorMode": "code",
"exemplar": false,
"expr": "topk(5, tongweb_globalrequestprocessor_requestcount{ instance=\"$instance\"})",
"format": "time_series",
"instant": false,
"interval": "",
"intervalFactor": 1,
"legendFormat": "{{name}} ",
"range": true,
"refId": "A"
}
],
"title": "请求计数TOP5",
"type": "timeseries"
},
{
"datasource": {
"type": "prometheus",
"uid": "$datasource"
},
"description": "",
"fieldConfig": {
"defaults": {
"color": {
"mode": "palette-classic"
},
"custom": {
"axisCenteredZero": false,
"axisColorMode": "text",
"axisLabel": "",
"axisPlacement": "auto",
"barAlignment": 0,
"drawStyle": "line",
"fillOpacity": 10,
"gradientMode": "none",
"hideFrom": {
"legend": false,
"tooltip": false,
"viz": false
},
"lineInterpolation": "linear",
"lineWidth": 1,
"pointSize": 5,
"scaleDistribution": {
"type": "linear"
},
"showPoints": "never",
"spanNulls": false,
"stacking": {
"group": "A",
"mode": "none"
},
"thresholdsStyle": {
"mode": "off"
}
},
"decimals": 0,
"mappings": [],
"thresholds": {
"mode": "absolute",
"steps": [
{
"color": "green",
"value": null
},
{
"color": "red",
"value": 80
}
]
},
"unit": "short"
},
"overrides": [
{
"matcher": {
"id": "byValue",
"options": {
"op": "gte",
"reducer": "allIsZero",
"value": 0
}
},
"properties": [
{
"id": "custom.hideFrom",
"value": {
"legend": true,
"tooltip": true,
"viz": false
}
}
]
}
]
},
"gridPos": {
"h": 9,
"w": 12,
"x": 12,
"y": 32
},
"id": 24,
"links": [],
"options": {
"legend": {
"calcs": [],
"displayMode": "table",
"placement": "right",
"showLegend": true
},
"tooltip": {
"mode": "multi",
"sort": "none"
}
},
"pluginVersion": "10.0.1",
"targets": [
{
"datasource": {
"type": "prometheus",
"uid": "${DS_PROMETHEUS}"
},
"editorMode": "code",
"exemplar": true,
"expr": "topk(5,tongweb_requestprocessor_errorcount{ instance=\"$instance\"})",
"format": "time_series",
"interval": "",
"intervalFactor": 1,
"legendFormat": "{{worker}} ",
"range": true,
"refId": "A"
}
],
"title": "错误计数TOP5",
"type": "timeseries"
},
{
"datasource": {
"type": "prometheus",
"uid": "$datasource"
},
"description": "",
"fieldConfig": {
"defaults": {
"color": {
"mode": "palette-classic"
},
"custom": {
"axisCenteredZero": false,
"axisColorMode": "text",
"axisLabel": "",
"axisPlacement": "auto",
"barAlignment": 0,
"drawStyle": "line",
"fillOpacity": 10,
"gradientMode": "none",
"hideFrom": {
"legend": false,
"tooltip": false,
"viz": false
},
"lineInterpolation": "linear",
"lineWidth": 1,
"pointSize": 5,
"scaleDistribution": {
"type": "linear"
},
"showPoints": "never",
"spanNulls": false,
"stacking": {
"group": "A",
"mode": "none"
},
"thresholdsStyle": {
"mode": "off"
}
},
"mappings": [],
"thresholds": {
"mode": "absolute",
"steps": [
{
"color": "green",
"value": null
},
{
"color": "red",
"value": 80
}
]
},
"unit": "decbytes"
},
"overrides": []
},
"gridPos": {
"h": 9,
"w": 12,
"x": 0,
"y": 41
},
"id": 2,
"links": [],
"options": {
"legend": {
"calcs": [],
"displayMode": "list",
"placement": "right",
"showLegend": true
},
"tooltip": {
"mode": "multi",
"sort": "none"
}
},
"pluginVersion": "10.0.1",
"repeatDirection": "h",
"targets": [
{
"datasource": {
"type": "prometheus",
"uid": "${DS_PROMETHEUS}"
},
"editorMode": "code",
"exemplar": true,
"expr": "increase(tongweb_globalrequestprocessor_bytesreceived{ instance=\"$instance\"}[$__interval])",
"format": "time_series",
"interval": "60s",
"intervalFactor": 1,
"legendFormat": "Received {{name}}",
"range": true,
"refId": "A"
},
{
"datasource": {
"type": "prometheus",
"uid": "${DS_PROMETHEUS}"
},
"editorMode": "code",
"exemplar": true,
"expr": "increase(tongweb_globalrequestprocessor_bytessent{ instance=\"$instance\"}[$__interval])",
"format": "time_series",
"interval": "60s",
"intervalFactor": 1,
"legendFormat": "Sent {{name}}",
"range": true,
"refId": "B"
}
],
"title": "发送/接收流量",
"type": "timeseries"
},
{
"datasource": {
"type": "prometheus",
"uid": "$datasource"
},
"description": "tomcat_requestcount_total是Tomcat服务器的一个请求计数器,它记录了所有已处理的请求总数。 在Tomcat服务器中,每个客户端请求都会被处理为一个请求,在处理请求期间,服务器会从连接中读取数据、解析数据、执行应用逻辑,并返回响应。每当Tomcat服务器成功处理一个请求时,其tomcat_requestcount_total指标就会相应地增加。监控和分析该指标可以帮助管理员和开发人员更好地了解Tomcat服务器的整体负载情况和活动水平,对于性能优化和故障排除都具有一定的价值。此外,该指标也可以通过与其他指标如tomcat_bytesreceived_total和tomcat_bytessent_total等结合使用,来监测网络流量和请求响应时间等性能指标,以进一步优化Tomcat服务器的配置和性能。",
"fieldConfig": {
"defaults": {
"color": {
"mode": "palette-classic"
},
"custom": {
"axisCenteredZero": false,
"axisColorMode": "text",
"axisLabel": "",
"axisPlacement": "auto",
"barAlignment": 0,
"drawStyle": "line",
"fillOpacity": 10,
"gradientMode": "none",
"hideFrom": {
"legend": false,
"tooltip": false,
"viz": false
},
"lineInterpolation": "linear",
"lineWidth": 1,
"pointSize": 5,
"scaleDistribution": {
"type": "linear"
},
"showPoints": "never",
"spanNulls": false,
"stacking": {
"group": "A",
"mode": "none"
},
"thresholdsStyle": {
"mode": "off"
}
},
"decimals": 0,
"mappings": [],
"thresholds": {
"mode": "absolute",
"steps": [
{
"color": "green",
"value": null
},
{
"color": "red",
"value": 80
}
]
},
"unit": "short"
},
"overrides": []
},
"gridPos": {
"h": 9,
"w": 12,
"x": 12,
"y": 41
},
"id": 4,
"links": [],
"options": {
"legend": {
"calcs": [
"lastNotNull",
"max",
"min"
],
"displayMode": "table",
"placement": "right",
"showLegend": true
},
"tooltip": {
"mode": "multi",
"sort": "none"
}
},
"pluginVersion": "10.0.1",
"repeatDirection": "h",
"targets": [
{
"datasource": {
"type": "prometheus",
"uid": "${DS_PROMETHEUS}"
},
"editorMode": "code",
"exemplar": true,
"expr": "increase(tongweb_globalrequestprocessor_requestcount{ instance=\"$instance\"}[5m])",
"format": "time_series",
"interval": "60s",
"intervalFactor": 1,
"legendFormat": "Request {{name}}",
"range": true,
"refId": "A"
},
{
"datasource": {
"type": "prometheus",
"uid": "${DS_PROMETHEUS}"
},
"editorMode": "code",
"exemplar": true,
"expr": "increase(tongweb_globalrequestprocessor_errorcount{ instance=\"$instance\"}[5m])",
"format": "time_series",
"interval": "60s",
"intervalFactor": 1,
"legendFormat": "Error {{name}}",
"range": true,
"refId": "B"
}
],
"title": "请求计数/错误计数",
"type": "timeseries"
},
{
"datasource": {
"type": "prometheus",
"uid": "$datasource"
},
"description": "",
"fieldConfig": {
"defaults": {
"color": {
"mode": "palette-classic"
},
"custom": {
"axisCenteredZero": false,
"axisColorMode": "text",
"axisLabel": "",
"axisPlacement": "auto",
"barAlignment": 0,
"drawStyle": "line",
"fillOpacity": 10,
"gradientMode": "none",
"hideFrom": {
"legend": false,
"tooltip": false,
"viz": false
},
"lineInterpolation": "linear",
"lineWidth": 1,
"pointSize": 5,
"scaleDistribution": {
"type": "linear"
},
"showPoints": "never",
"spanNulls": false,
"stacking": {
"group": "A",
"mode": "none"
},
"thresholdsStyle": {
"mode": "off"
}
},
"decimals": 0,
"mappings": [],
"thresholds": {
"mode": "absolute",
"steps": [
{
"color": "green",
"value": null
},
{
"color": "red",
"value": 80
}
]
},
"unit": "none"
},
"overrides": [
{
"__systemRef": "hideSeriesFrom",
"matcher": {
"id": "byNames",
"options": {
"mode": "exclude",
"names": [
"New"
],
"prefix": "All except:",
"readOnly": true
}
},
"properties": [
{
"id": "custom.hideFrom",
"value": {
"legend": false,
"tooltip": false,
"viz": true
}
}
]
}
]
},
"gridPos": {
"h": 8,
"w": 24,
"x": 0,
"y": 50
},
"id": 5,
"links": [],
"options": {
"legend": {
"calcs": [
"lastNotNull",
"max",
"min"
],
"displayMode": "table",
"placement": "right",
"showLegend": true
},
"tooltip": {
"mode": "multi",
"sort": "none"
}
},
"pluginVersion": "10.0.1",
"targets": [
{
"datasource": {
"type": "prometheus",
"uid": "${DS_PROMETHEUS}"
},
"editorMode": "code",
"exemplar": true,
"expr": "sum(increase(tongweb_manager_sessioncounter{ instance=\"$instance\"}[5m])) by (instance)",
"format": "time_series",
"hide": false,
"interval": "60s",
"intervalFactor": 1,
"legendFormat": "New",
"range": true,
"refId": "A"
},
{
"datasource": {
"type": "prometheus",
"uid": "${DS_PROMETHEUS}"
},
"editorMode": "code",
"expr": "sum(increase(tongweb_manager_expiredsessions{ instance=\"$instance\"}[5m])) by (instance)",
"format": "time_series",
"hide": false,
"interval": "60s",
"intervalFactor": 1,
"legendFormat": "Expired",
"range": true,
"refId": "B"
},
{
"datasource": {
"type": "prometheus",
"uid": "${DS_PROMETHEUS}"
},
"editorMode": "code",
"expr": "sum(increase(tongweb_manager_rejectedsessions{ instance=\"$instance\"}[5m])) by (instance)",
"format": "time_series",
"hide": false,
"interval": "60s",
"intervalFactor": 1,
"legendFormat": "Rejected",
"range": true,
"refId": "C"
}
],
"title": "会话计数统计",
"type": "timeseries"
}
],
"refresh": "5s",
"schemaVersion": 38,
"style": "dark",
"tags": [
"Tomcat8"
],
"templating": {
"list": [
{
"current": {
"selected": false,
"text": "Prometheus",
"value": "Prometheus"
},
"hide": 0,
"includeAll": false,
"multi": false,
"name": "datasource",
"options": [],
"query": "prometheus",
"queryValue": "",
"refresh": 1,
"regex": "",
"skipUrlSync": false,
"type": "datasource"
},
{
"allValue": ".*",
"current": {},
"datasource": {
"type": "prometheus",
"uid": "${DS_PROMETHEUS}"
},
"definition": "label_values(jvm_info{},instance)",
"hide": 0,
"includeAll": false,
"label": "Instance",
"multi": false,
"name": "instance",
"options": [],
"query": {
"query": "label_values(jvm_info{},instance)",
"refId": "PrometheusVariableQueryEditor-VariableQuery"
},
"refresh": 2,
"regex": "",
"skipUrlSync": false,
"sort": 1,
"tagValuesQuery": "",
"tagsQuery": "",
"type": "query",
"useTags": false
}
]
},
"time": {
"from": "now-15m",
"to": "now"
},
"timepicker": {
"refresh_intervals": [
"5s",
"10s",
"30s",
"1m",
"5m",
"15m"
],
"time_options": [
"5m",
"15m",
"1h",
"6h",
"12h",
"24h",
"2d",
"7d",
"30d"
]
},
"timezone": "",
"title": "TongWeb_dashboard",
"uid": "tongweb",
"version": 71,
"weekStart": ""
}
{
"__inputs": [
{
"name": "DS_PROMETHEUS",
"label": "Prometheus",
"description": "",
"type": "datasource",
"pluginId": "prometheus",
"pluginName": "Prometheus"
}
],
"__requires": [
{
"type": "grafana",
"id": "grafana",
"name": "Grafana",
"version": "4.6.5"
},
{
"type": "panel",
"id": "graph",
"name": "Graph",
"version": ""
},
{
"type": "datasource",
"id": "prometheus",
"name": "Prometheus",
"version": "1.0.0"
},
{
"type": "panel",
"id": "singlestat",
"name": "Singlestat",
"version": ""
}
],
"annotations": {
"list": [
{
"builtIn": 1,
"datasource": "-- Grafana --",
"enable": true,
"hide": true,
"iconColor": "rgba(0, 211, 255, 1)",
"limit": 100,
"name": "Annotations & Alerts",
"showIn": 0,
"type": "dashboard"
},
{
"datasource": "${DS_PROMETHEUS}",
"enable": true,
"expr": "resets(process_uptime_seconds{application=\"$application\", instance=\"$instance\"}[1m]) > 0",
"iconColor": "rgba(255, 96, 96, 1)",
"name": "Restart Detection",
"showIn": 0,
"step": "1m",
"tagKeys": "restart-tag",
"textFormat": "uptime reset",
"titleFormat": "Restart"
}
]
},
"description": "Dashboard for Micrometer instrumented applications (Java, Spring Boot, Micronaut)",
"editable": true,
"gnetId": 4701,
"graphTooltip": 1,
"hideControls": false,
"id": null,
"links": [],
"refresh": "30s",
"rows": [
{
"collapse": false,
"height": "100px",
"panels": [
{
"cacheTimeout": null,
"colorBackground": false,
"colorValue": true,
"colors": [
"rgba(245, 54, 54, 0.9)",
"rgba(237, 129, 40, 0.89)",
"rgba(50, 172, 45, 0.97)"
],
"datasource": "${DS_PROMETHEUS}",
"decimals": 1,
"editable": true,
"error": false,
"format": "s",
"gauge": {
"maxValue": 100,
"minValue": 0,
"show": false,
"thresholdLabels": false,
"thresholdMarkers": true
},
"height": "",
"id": 63,
"interval": null,
"links": [],
"mappingType": 1,
"mappingTypes": [
{
"name": "value to text",
"value": 1
},
{
"name": "range to text",
"value": 2
}
],
"maxDataPoints": 100,
"nullPointMode": "connected",
"nullText": null,
"postfix": "",
"postfixFontSize": "50%",
"prefix": "",
"prefixFontSize": "70%",
"rangeMaps": [
{
"from": "null",
"text": "N/A",
"to": "null"
}
],
"span": 3,
"sparkline": {
"fillColor": "rgba(31, 118, 189, 0.18)",
"full": false,
"lineColor": "rgb(31, 120, 193)",
"show": false
},
"tableColumn": "",
"targets": [
{
"expr": "process_uptime_seconds{application=\"$application\", instance=\"$instance\"}",
"format": "time_series",
"intervalFactor": 2,
"legendFormat": "",
"metric": "",
"refId": "A",
"step": 14400
}
],
"thresholds": "",
"title": "Uptime",
"transparent": false,
"type": "singlestat",
"valueFontSize": "80%",
"valueMaps": [
{
"op": "=",
"text": "N/A",
"value": "null"
}
],
"valueName": "current"
},
{
"cacheTimeout": null,
"colorBackground": false,
"colorValue": true,
"colors": [
"rgba(245, 54, 54, 0.9)",
"rgba(237, 129, 40, 0.89)",
"rgba(50, 172, 45, 0.97)"
],
"datasource": "${DS_PROMETHEUS}",
"decimals": null,
"editable": true,
"error": false,
"format": "dateTimeAsIso",
"gauge": {
"maxValue": 100,
"minValue": 0,
"show": false,
"thresholdLabels": false,
"thresholdMarkers": true
},
"height": "",
"id": 92,
"interval": null,
"links": [],
"mappingType": 1,
"mappingTypes": [
{
"name": "value to text",
"value": 1
},
{
"name": "range to text",
"value": 2
}
],
"maxDataPoints": 100,
"nullPointMode": "connected",
"nullText": null,
"postfix": "",
"postfixFontSize": "50%",
"prefix": "",
"prefixFontSize": "70%",
"rangeMaps": [
{
"from": "null",
"text": "N/A",
"to": "null"
}
],
"span": 3,
"sparkline": {
"fillColor": "rgba(31, 118, 189, 0.18)",
"full": false,
"lineColor": "rgb(31, 120, 193)",
"show": false
},
"tableColumn": "",
"targets": [
{
"expr": "process_start_time_seconds{application=\"$application\", instance=\"$instance\"}*1000",
"format": "time_series",
"intervalFactor": 2,
"legendFormat": "",
"metric": "",
"refId": "A",
"step": 14400
}
],
"thresholds": "",
"title": "Start time",
"transparent": false,
"type": "singlestat",
"valueFontSize": "70%",
"valueMaps": [
{
"op": "=",
"text": "N/A",
"value": "null"
}
],
"valueName": "current"
},
{
"cacheTimeout": null,
"colorBackground": false,
"colorValue": true,
"colors": [
"rgba(50, 172, 45, 0.97)",
"rgba(237, 129, 40, 0.89)",
"rgba(245, 54, 54, 0.9)"
],
"datasource": "${DS_PROMETHEUS}",
"decimals": 2,
"editable": true,
"error": false,
"format": "percent",
"gauge": {
"maxValue": 100,
"minValue": 0,
"show": false,
"thresholdLabels": false,
"thresholdMarkers": true
},
"id": 65,
"interval": null,
"links": [],
"mappingType": 1,
"mappingTypes": [
{
"name": "value to text",
"value": 1
},
{
"name": "range to text",
"value": 2
}
],
"maxDataPoints": 100,
"nullPointMode": "connected",
"nullText": null,
"postfix": "",
"postfixFontSize": "50%",
"prefix": "",
"prefixFontSize": "70%",
"rangeMaps": [
{
"from": "null",
"text": "N/A",
"to": "null"
}
],
"span": 3,
"sparkline": {
"fillColor": "rgba(31, 118, 189, 0.18)",
"full": false,
"lineColor": "rgb(31, 120, 193)",
"show": false
},
"tableColumn": "",
"targets": [
{
"expr": "sum(jvm_memory_used_bytes{application=\"$application\", instance=\"$instance\", area=\"heap\"})*100/sum(jvm_memory_max_bytes{application=\"$application\",instance=\"$instance\", area=\"heap\"})",
"format": "time_series",
"intervalFactor": 2,
"legendFormat": "",
"refId": "A",
"step": 14400
}
],
"thresholds": "70,90",
"title": "Heap used",
"type": "singlestat",
"valueFontSize": "80%",
"valueMaps": [
{
"op": "=",
"text": "N/A",
"value": "null"
}
],
"valueName": "current"
},
{
"cacheTimeout": null,
"colorBackground": false,
"colorValue": true,
"colors": [
"rgba(50, 172, 45, 0.97)",
"rgba(237, 129, 40, 0.89)",
"rgba(245, 54, 54, 0.9)"
],
"datasource": "${DS_PROMETHEUS}",
"decimals": 2,
"editable": true,
"error": false,
"format": "percent",
"gauge": {
"maxValue": 100,
"minValue": 0,
"show": false,
"thresholdLabels": false,
"thresholdMarkers": true
},
"id": 75,
"interval": null,
"links": [],
"mappingType": 2,
"mappingTypes": [
{
"name": "value to text",
"value": 1
},
{
"name": "range to text",
"value": 2
}
],
"maxDataPoints": 100,
"nullPointMode": "connected",
"nullText": null,
"postfix": "",
"postfixFontSize": "50%",
"prefix": "",
"prefixFontSize": "70%",
"rangeMaps": [
{
"from": "null",
"text": "N/A",
"to": "null"
},
{
"from": "-99999999999999999999999999999999",
"text": "N/A",
"to": "0"
}
],
"span": 3,
"sparkline": {
"fillColor": "rgba(31, 118, 189, 0.18)",
"full": false,
"lineColor": "rgb(31, 120, 193)",
"show": false
},
"tableColumn": "",
"targets": [
{
"expr": "sum(jvm_memory_used_bytes{application=\"$application\", instance=\"$instance\", area=\"nonheap\"})*100/sum(jvm_memory_max_bytes{application=\"$application\",instance=\"$instance\", area=\"nonheap\"})",
"format": "time_series",
"intervalFactor": 2,
"legendFormat": "",
"refId": "A",
"step": 14400
}
],
"thresholds": "70,90",
"title": "Non-Heap used",
"type": "singlestat",
"valueFontSize": "80%",
"valueMaps": [
{
"op": "=",
"text": "N/A",
"value": "null"
},
{
"op": "=",
"text": "x",
"value": ""
}
],
"valueName": "current"
}
],
"repeat": null,
"repeatIteration": null,
"repeatRowId": null,
"showTitle": true,
"title": "Quick Facts",
"titleSize": "h6"
},
{
"collapse": false,
"height": 250,
"panels": [
{
"aliasColors": {},
"bars": false,
"dashLength": 10,
"dashes": false,
"datasource": "${DS_PROMETHEUS}",
"fill": 1,
"id": 111,
"legend": {
"avg": false,
"current": true,
"max": false,
"min": false,
"show": true,
"total": false,
"values": true
},
"lines": true,
"linewidth": 1,
"links": [],
"nullPointMode": "null",
"percentage": false,
"pointradius": 5,
"points": false,
"renderer": "flot",
"seriesOverrides": [],
"spaceLength": 10,
"span": 3,
"stack": false,
"steppedLine": false,
"targets": [
{
"expr": "sum(rate(http_server_requests_seconds_count{application=\"$application\", instance=\"$instance\"}[1m]))",
"format": "time_series",
"intervalFactor": 1,
"legendFormat": "HTTP",
"refId": "A"
}
],
"thresholds": [],
"timeFrom": null,
"timeShift": null,
"title": "Rate",
"tooltip": {
"shared": true,
"sort": 0,
"value_type": "individual"
},
"type": "graph",
"xaxis": {
"buckets": null,
"mode": "time",
"name": null,
"show": true,
"values": []
},
"yaxes": [
{
"decimals": null,
"format": "ops",
"label": null,
"logBase": 1,
"max": null,
"min": "0",
"show": true
},
{
"format": "short",
"label": null,
"logBase": 1,
"max": null,
"min": null,
"show": true
}
]
},
{
"aliasColors": {
"HTTP": "#890f02",
"HTTP - 5xx": "#bf1b00"
},
"bars": false,
"dashLength": 10,
"dashes": false,
"datasource": "${DS_PROMETHEUS}",
"fill": 1,
"id": 112,
"legend": {
"avg": false,
"current": true,
"max": false,
"min": false,
"show": true,
"total": false,
"values": true
},
"lines": true,
"linewidth": 1,
"links": [],
"nullPointMode": "null",
"percentage": false,
"pointradius": 5,
"points": false,
"renderer": "flot",
"seriesOverrides": [],
"spaceLength": 10,
"span": 3,
"stack": false,
"steppedLine": false,
"targets": [
{
"expr": "sum(rate(http_server_requests_seconds_count{application=\"$application\", instance=\"$instance\", status=~\"5..\"}[1m]))",
"format": "time_series",
"intervalFactor": 1,
"legendFormat": "HTTP - 5xx",
"refId": "A"
}
],
"thresholds": [],
"timeFrom": null,
"timeShift": null,
"title": "Errors",
"tooltip": {
"shared": true,
"sort": 0,
"value_type": "individual"
},
"type": "graph",
"xaxis": {
"buckets": null,
"mode": "time",
"name": null,
"show": true,
"values": []
},
"yaxes": [
{
"decimals": null,
"format": "ops",
"label": null,
"logBase": 1,
"max": null,
"min": "0",
"show": true
},
{
"format": "short",
"label": null,
"logBase": 1,
"max": null,
"min": null,
"show": true
}
]
},
{
"aliasColors": {},
"bars": false,
"dashLength": 10,
"dashes": false,
"datasource": "${DS_PROMETHEUS}",
"fill": 1,
"id": 113,
"legend": {
"avg": false,
"current": true,
"max": false,
"min": false,
"show": true,
"total": false,
"values": true
},
"lines": true,
"linewidth": 1,
"links": [],
"nullPointMode": "null",
"percentage": false,
"pointradius": 5,
"points": false,
"renderer": "flot",
"seriesOverrides": [],
"spaceLength": 10,
"span": 3,
"stack": false,
"steppedLine": false,
"targets": [
{
"expr": "sum(rate(http_server_requests_seconds_sum{application=\"$application\", instance=\"$instance\", status!~\"5..\"}[1m]))/sum(rate(http_server_requests_seconds_count{application=\"$application\", instance=\"$instance\", status!~\"5..\"}[1m]))",
"format": "time_series",
"hide": false,
"intervalFactor": 1,
"legendFormat": "HTTP - AVG",
"refId": "A"
},
{
"expr": "max(http_server_requests_seconds_max{application=\"$application\", instance=\"$instance\", status!~\"5..\"})",
"format": "time_series",
"hide": false,
"intervalFactor": 1,
"legendFormat": "HTTP - MAX",
"refId": "B"
}
],
"thresholds": [],
"timeFrom": null,
"timeShift": null,
"title": "Duration",
"tooltip": {
"shared": true,
"sort": 0,
"value_type": "individual"
},
"type": "graph",
"xaxis": {
"buckets": null,
"mode": "time",
"name": null,
"show": true,
"values": []
},
"yaxes": [
{
"format": "s",
"label": null,
"logBase": 1,
"max": null,
"min": "0",
"show": true
},
{
"format": "short",
"label": null,
"logBase": 1,
"max": null,
"min": null,
"show": true
}
]
},
{
"aliasColors": {},
"bars": false,
"dashLength": 10,
"dashes": false,
"datasource": "${DS_PROMETHEUS}",
"description": "",
"fill": 1,
"id": 119,
"legend": {
"alignAsTable": false,
"avg": false,
"current": true,
"max": false,
"min": false,
"show": true,
"total": false,
"values": true
},
"lines": true,
"linewidth": 1,
"links": [],
"nullPointMode": "null",
"percentage": false,
"pointradius": 5,
"points": false,
"renderer": "flot",
"seriesOverrides": [],
"spaceLength": 10,
"span": 3,
"stack": false,
"steppedLine": false,
"targets": [
{
"expr": "tomcat_threads_busy_threads{application=\"$application\", instance=\"$instance\"}",
"format": "time_series",
"hide": false,
"intervalFactor": 2,
"legendFormat": "TOMCAT - BSY",
"refId": "A"
},
{
"expr": "tomcat_threads_current_threads{application=\"$application\", instance=\"$instance\"}",
"format": "time_series",
"hide": false,
"intervalFactor": 2,
"legendFormat": "TOMCAT - CUR",
"refId": "B"
},
{
"expr": "tomcat_threads_config_max_threads{application=\"$application\", instance=\"$instance\"}",
"format": "time_series",
"hide": false,
"intervalFactor": 2,
"legendFormat": "TOMCAT - MAX",
"refId": "C"
},
{
"expr": "jetty_threads_busy{application=\"$application\", instance=\"$instance\"}",
"format": "time_series",
"hide": false,
"intervalFactor": 2,
"legendFormat": "JETTY - BSY",
"refId": "D"
},
{
"expr": "jetty_threads_current{application=\"$application\", instance=\"$instance\"}",
"format": "time_series",
"hide": false,
"intervalFactor": 2,
"legendFormat": "JETTY - CUR",
"refId": "E"
},
{
"expr": "jetty_threads_config_max{application=\"$application\", instance=\"$instance\"}",
"format": "time_series",
"hide": false,
"intervalFactor": 2,
"legendFormat": "JETTY - MAX",
"refId": "F"
}
],
"thresholds": [],
"timeFrom": null,
"timeShift": null,
"title": "Utilisation",
"tooltip": {
"shared": true,
"sort": 0,
"value_type": "individual"
},
"type": "graph",
"xaxis": {
"buckets": null,
"mode": "time",
"name": null,
"show": true,
"values": []
},
"yaxes": [
{
"format": "short",
"label": null,
"logBase": 1,
"max": null,
"min": "0",
"show": true
},
{
"format": "short",
"label": null,
"logBase": 1,
"max": null,
"min": null,
"show": true
}
]
}
],
"repeat": null,
"repeatIteration": null,
"repeatRowId": null,
"showTitle": true,
"title": "I/O Overview",
"titleSize": "h6"
},
{
"collapse": false,
"height": "250px",
"panels": [
{
"aliasColors": {},
"bars": false,
"dashLength": 10,
"dashes": false,
"datasource": "${DS_PROMETHEUS}",
"editable": true,
"error": false,
"fill": 1,
"grid": {
"leftLogBase": 1,
"leftMax": null,
"leftMin": null,
"rightLogBase": 1,
"rightMax": null,
"rightMin": null
},
"id": 24,
"legend": {
"avg": false,
"current": true,
"max": true,
"min": false,
"show": true,
"total": false,
"values": true
},
"lines": true,
"linewidth": 1,
"links": [],
"nullPointMode": "null",
"percentage": false,
"pointradius": 5,
"points": false,
"renderer": "flot",
"seriesOverrides": [],
"spaceLength": 10,
"span": 3,
"stack": false,
"steppedLine": false,
"targets": [
{
"expr": "sum(jvm_memory_used_bytes{application=\"$application\", instance=\"$instance\", area=\"heap\"})",
"format": "time_series",
"intervalFactor": 2,
"legendFormat": "used",
"metric": "",
"refId": "A",
"step": 2400
},
{
"expr": "sum(jvm_memory_committed_bytes{application=\"$application\", instance=\"$instance\", area=\"heap\"})",
"format": "time_series",
"intervalFactor": 2,
"legendFormat": "committed",
"refId": "B",
"step": 2400
},
{
"expr": "sum(jvm_memory_max_bytes{application=\"$application\", instance=\"$instance\", area=\"heap\"})",
"format": "time_series",
"intervalFactor": 2,
"legendFormat": "max",
"refId": "C",
"step": 2400
}
],
"thresholds": [],
"timeFrom": null,
"timeShift": null,
"title": "JVM Heap",
"tooltip": {
"msResolution": false,
"shared": true,
"sort": 0,
"value_type": "cumulative"
},
"type": "graph",
"x-axis": true,
"xaxis": {
"buckets": null,
"mode": "time",
"name": null,
"show": true,
"values": []
},
"y-axis": true,
"y_formats": [
"mbytes",
"short"
],
"yaxes": [
{
"format": "bytes",
"label": null,
"logBase": 1,
"max": null,
"min": 0,
"show": true
},
{
"format": "short",
"label": null,
"logBase": 1,
"max": null,
"min": null,
"show": true
}
]
},
{
"aliasColors": {},
"bars": false,
"dashLength": 10,
"dashes": false,
"datasource": "${DS_PROMETHEUS}",
"editable": true,
"error": false,
"fill": 1,
"grid": {
"leftLogBase": 1,
"leftMax": null,
"leftMin": null,
"rightLogBase": 1,
"rightMax": null,
"rightMin": null
},
"id": 25,
"legend": {
"avg": false,
"current": true,
"max": true,
"min": false,
"show": true,
"total": false,
"values": true
},
"lines": true,
"linewidth": 1,
"links": [],
"nullPointMode": "null",
"percentage": false,
"pointradius": 5,
"points": false,
"renderer": "flot",
"seriesOverrides": [],
"spaceLength": 10,
"span": 3,
"stack": false,
"steppedLine": false,
"targets": [
{
"expr": "sum(jvm_memory_used_bytes{application=\"$application\", instance=\"$instance\", area=\"nonheap\"})",
"format": "time_series",
"interval": "",
"intervalFactor": 2,
"legendFormat": "used",
"metric": "",
"refId": "A",
"step": 2400
},
{
"expr": "sum(jvm_memory_committed_bytes{application=\"$application\", instance=\"$instance\", area=\"nonheap\"})",
"format": "time_series",
"intervalFactor": 2,
"legendFormat": "committed",
"refId": "B",
"step": 2400
},
{
"expr": "sum(jvm_memory_max_bytes{application=\"$application\", instance=\"$instance\", area=\"nonheap\"})",
"format": "time_series",
"intervalFactor": 2,
"legendFormat": "max",
"refId": "C",
"step": 2400
}
],
"thresholds": [],
"timeFrom": null,
"timeShift": null,
"title": "JVM Non-Heap",
"tooltip": {
"msResolution": false,
"shared": true,
"sort": 0,
"value_type": "cumulative"
},
"type": "graph",
"x-axis": true,
"xaxis": {
"buckets": null,
"mode": "time",
"name": null,
"show": true,
"values": []
},
"y-axis": true,
"y_formats": [
"mbytes",
"short"
],
"yaxes": [
{
"format": "bytes",
"label": null,
"logBase": 1,
"max": null,
"min": 0,
"show": true
},
{
"format": "short",
"label": null,
"logBase": 1,
"max": null,
"min": null,
"show": true
}
]
},
{
"aliasColors": {},
"bars": false,
"dashLength": 10,
"dashes": false,
"datasource": "${DS_PROMETHEUS}",
"editable": true,
"error": false,
"fill": 1,
"grid": {
"leftLogBase": 1,
"leftMax": null,
"leftMin": null,
"rightLogBase": 1,
"rightMax": null,
"rightMin": null
},
"id": 26,
"legend": {
"alignAsTable": false,
"avg": false,
"current": true,
"max": true,
"min": false,
"show": true,
"total": false,
"values": true
},
"lines": true,
"linewidth": 1,
"links": [],
"nullPointMode": "null",
"percentage": false,
"pointradius": 5,
"points": false,
"renderer": "flot",
"seriesOverrides": [],
"spaceLength": 10,
"span": 3,
"stack": false,
"steppedLine": false,
"targets": [
{
"expr": "sum(jvm_memory_used_bytes{application=\"$application\", instance=\"$instance\"})",
"format": "time_series",
"intervalFactor": 2,
"legendFormat": "used",
"metric": "",
"refId": "A",
"step": 2400
},
{
"expr": "sum(jvm_memory_committed_bytes{application=\"$application\", instance=\"$instance\"})",
"format": "time_series",
"intervalFactor": 2,
"legendFormat": "committed",
"refId": "B",
"step": 2400
},
{
"expr": "sum(jvm_memory_max_bytes{application=\"$application\", instance=\"$instance\"})",
"format": "time_series",
"intervalFactor": 2,
"legendFormat": "max",
"refId": "C",
"step": 2400
}
],
"thresholds": [],
"timeFrom": null,
"timeShift": null,
"title": "JVM Total",
"tooltip": {
"msResolution": false,
"shared": true,
"sort": 0,
"value_type": "cumulative"
},
"type": "graph",
"x-axis": true,
"xaxis": {
"buckets": null,
"mode": "time",
"name": null,
"show": true,
"values": []
},
"y-axis": true,
"y_formats": [
"mbytes",
"short"
],
"yaxes": [
{
"format": "bytes",
"label": "",
"logBase": 1,
"max": null,
"min": 0,
"show": true
},
{
"format": "short",
"label": null,
"logBase": 1,
"max": null,
"min": null,
"show": true
}
]
},
{
"aliasColors": {},
"bars": false,
"dashLength": 10,
"dashes": false,
"datasource": "${DS_PROMETHEUS}",
"editable": true,
"error": false,
"fill": 1,
"grid": {
"leftLogBase": 1,
"leftMax": null,
"leftMin": null,
"rightLogBase": 1,
"rightMax": null,
"rightMin": null
},
"id": 86,
"legend": {
"avg": false,
"current": true,
"max": true,
"min": false,
"show": true,
"total": false,
"values": true
},
"lines": true,
"linewidth": 1,
"links": [],
"nullPointMode": "null",
"percentage": false,
"pointradius": 5,
"points": false,
"renderer": "flot",
"seriesOverrides": [],
"spaceLength": 10,
"span": 3,
"stack": false,
"steppedLine": false,
"targets": [
{
"expr": "process_memory_vss_bytes{application=\"$application\", instance=\"$instance\"}",
"format": "time_series",
"hide": true,
"intervalFactor": 2,
"legendFormat": "vss",
"metric": "",
"refId": "A",
"step": 2400
},
{
"expr": "process_memory_rss_bytes{application=\"$application\", instance=\"$instance\"}",
"format": "time_series",
"intervalFactor": 2,
"legendFormat": "rss",
"refId": "B"
},
{
"expr": "process_memory_swap_bytes{application=\"$application\", instance=\"$instance\"}",
"format": "time_series",
"intervalFactor": 2,
"legendFormat": "swap",
"refId": "C"
},
{
"expr": "process_memory_rss_bytes{application=\"$application\", instance=\"$instance\"} + process_memory_swap_bytes{application=\"$application\", instance=\"$instance\"}",
"format": "time_series",
"intervalFactor": 2,
"legendFormat": "total",
"refId": "D"
}
],
"thresholds": [],
"timeFrom": null,
"timeShift": null,
"title": "JVM Process Memory",
"tooltip": {
"msResolution": false,
"shared": true,
"sort": 0,
"value_type": "cumulative"
},
"type": "graph",
"x-axis": true,
"xaxis": {
"buckets": null,
"mode": "time",
"name": null,
"show": true,
"values": []
},
"y-axis": true,
"y_formats": [
"mbytes",
"short"
],
"yaxes": [
{
"format": "bytes",
"label": "",
"logBase": 1,
"max": null,
"min": "0",
"show": true
},
{
"format": "short",
"label": null,
"logBase": 1,
"max": null,
"min": null,
"show": true
}
]
}
],
"repeat": null,
"repeatIteration": null,
"repeatRowId": null,
"showTitle": true,
"title": "JVM Memory",
"titleSize": "h6"
},
{
"collapse": false,
"height": 250,
"panels": [
{
"aliasColors": {},
"bars": false,
"dashLength": 10,
"dashes": false,
"datasource": "${DS_PROMETHEUS}",
"editable": true,
"error": false,
"fill": 1,
"grid": {
"leftLogBase": 1,
"leftMax": null,
"leftMin": null,
"rightLogBase": 1,
"rightMax": null,
"rightMin": null
},
"id": 106,
"legend": {
"avg": false,
"current": true,
"max": true,
"min": false,
"show": true,
"total": false,
"values": true
},
"lines": true,
"linewidth": 1,
"links": [],
"nullPointMode": "null",
"percentage": false,
"pointradius": 5,
"points": false,
"renderer": "flot",
"seriesOverrides": [],
"spaceLength": 10,
"span": 3,
"stack": false,
"steppedLine": false,
"targets": [
{
"expr": "system_cpu_usage{application=\"$application\", instance=\"$instance\"}",
"format": "time_series",
"hide": false,
"intervalFactor": 1,
"legendFormat": "system",
"metric": "",
"refId": "A",
"step": 2400
},
{
"expr": "process_cpu_usage{application=\"$application\", instance=\"$instance\"}",
"format": "time_series",
"hide": false,
"intervalFactor": 1,
"legendFormat": "process",
"refId": "B"
},
{
"expr": "avg_over_time(process_cpu_usage{application=\"$application\", instance=\"$instance\"}[15m])",
"format": "time_series",
"hide": false,
"intervalFactor": 1,
"legendFormat": "process-15m",
"refId": "C"
}
],
"thresholds": [],
"timeFrom": null,
"timeShift": null,
"title": "CPU Usage",
"tooltip": {
"msResolution": false,
"shared": true,
"sort": 0,
"value_type": "cumulative"
},
"type": "graph",
"x-axis": true,
"xaxis": {
"buckets": null,
"mode": "time",
"name": null,
"show": true,
"values": []
},
"y-axis": true,
"y_formats": [
"short",
"short"
],
"yaxes": [
{
"decimals": 1,
"format": "percentunit",
"label": "",
"logBase": 1,
"max": "1",
"min": 0,
"show": true
},
{
"format": "short",
"label": null,
"logBase": 1,
"max": null,
"min": null,
"show": true
}
]
},
{
"aliasColors": {},
"bars": false,
"dashLength": 10,
"dashes": false,
"datasource": "${DS_PROMETHEUS}",
"editable": true,
"error": false,
"fill": 1,
"grid": {
"leftLogBase": 1,
"leftMax": null,
"leftMin": null,
"rightLogBase": 1,
"rightMax": null,
"rightMin": null
},
"id": 93,
"legend": {
"avg": false,
"current": true,
"max": true,
"min": false,
"show": true,
"total": false,
"values": true
},
"lines": true,
"linewidth": 1,
"links": [],
"nullPointMode": "null",
"percentage": false,
"pointradius": 5,
"points": false,
"renderer": "flot",
"seriesOverrides": [],
"spaceLength": 10,
"span": 3,
"stack": false,
"steppedLine": false,
"targets": [
{
"expr": "system_load_average_1m{application=\"$application\", instance=\"$instance\"}",
"format": "time_series",
"intervalFactor": 2,
"legendFormat": "system-1m",
"metric": "",
"refId": "A",
"step": 2400
},
{
"expr": "system_cpu_count{application=\"$application\", instance=\"$instance\"}",
"format": "time_series",
"intervalFactor": 2,
"legendFormat": "cpus",
"refId": "B"
}
],
"thresholds": [],
"timeFrom": null,
"timeShift": null,
"title": "Load",
"tooltip": {
"msResolution": false,
"shared": true,
"sort": 0,
"value_type": "cumulative"
},
"type": "graph",
"x-axis": true,
"xaxis": {
"buckets": null,
"mode": "time",
"name": null,
"show": true,
"values": []
},
"y-axis": true,
"y_formats": [
"short",
"short"
],
"yaxes": [
{
"decimals": 1,
"format": "short",
"label": "",
"logBase": 1,
"max": null,
"min": 0,
"show": true
},
{
"format": "short",
"label": null,
"logBase": 1,
"max": null,
"min": null,
"show": true
}
]
},
{
"aliasColors": {},
"bars": false,
"dashLength": 10,
"dashes": false,
"datasource": "${DS_PROMETHEUS}",
"editable": true,
"error": false,
"fill": 1,
"grid": {
"leftLogBase": 1,
"leftMax": null,
"leftMin": null,
"rightLogBase": 1,
"rightMax": null,
"rightMin": null
},
"id": 32,
"legend": {
"avg": false,
"current": true,
"max": true,
"min": false,
"show": true,
"total": false,
"values": true
},
"lines": true,
"linewidth": 1,
"links": [],
"nullPointMode": "null",
"percentage": false,
"pointradius": 5,
"points": false,
"renderer": "flot",
"seriesOverrides": [],
"spaceLength": 10,
"span": 3,
"stack": false,
"steppedLine": false,
"targets": [
{
"expr": "jvm_threads_live_threads{application=\"$application\", instance=\"$instance\"}",
"format": "time_series",
"intervalFactor": 2,
"legendFormat": "live",
"metric": "",
"refId": "A",
"step": 2400
},
{
"expr": "jvm_threads_daemon_threads{application=\"$application\", instance=\"$instance\"}",
"format": "time_series",
"intervalFactor": 2,
"legendFormat": "daemon",
"metric": "",
"refId": "B",
"step": 2400
},
{
"expr": "jvm_threads_peak_threads{application=\"$application\", instance=\"$instance\"}",
"format": "time_series",
"intervalFactor": 2,
"legendFormat": "peak",
"refId": "C",
"step": 2400
},
{
"expr": "process_threads{application=\"$application\", instance=\"$instance\"}",
"format": "time_series",
"interval": "",
"intervalFactor": 2,
"legendFormat": "process",
"refId": "D",
"step": 2400
}
],
"thresholds": [],
"timeFrom": null,
"timeShift": null,
"title": "Threads",
"tooltip": {
"msResolution": false,
"shared": true,
"sort": 0,
"value_type": "cumulative"
},
"type": "graph",
"x-axis": true,
"xaxis": {
"buckets": null,
"mode": "time",
"name": null,
"show": true,
"values": []
},
"y-axis": true,
"y_formats": [
"short",
"short"
],
"yaxes": [
{
"decimals": 0,
"format": "short",
"label": null,
"logBase": 1,
"max": null,
"min": 0,
"show": true
},
{
"format": "short",
"label": null,
"logBase": 1,
"max": null,
"min": null,
"show": true
}
]
},
{
"aliasColors": {
"blocked": "#bf1b00",
"new": "#fce2de",
"runnable": "#7eb26d",
"terminated": "#511749",
"timed-waiting": "#c15c17",
"waiting": "#eab839"
},
"bars": false,
"dashLength": 10,
"dashes": false,
"datasource": "${DS_PROMETHEUS}",
"fill": 1,
"id": 124,
"legend": {
"alignAsTable": false,
"avg": false,
"current": true,
"max": true,
"min": false,
"rightSide": false,
"show": true,
"total": false,
"values": true
},
"lines": true,
"linewidth": 1,
"links": [],
"nullPointMode": "null",
"percentage": false,
"pointradius": 5,
"points": false,
"renderer": "flot",
"seriesOverrides": [],
"spaceLength": 10,
"span": 3,
"stack": false,
"steppedLine": false,
"targets": [
{
"expr": "jvm_threads_states_threads{application=\"$application\", instance=\"$instance\"}",
"format": "time_series",
"intervalFactor": 2,
"legendFormat": "{{state}}",
"refId": "A"
}
],
"thresholds": [],
"timeFrom": null,
"timeShift": null,
"title": "Thread States",
"tooltip": {
"shared": true,
"sort": 0,
"value_type": "individual"
},
"type": "graph",
"xaxis": {
"buckets": null,
"mode": "time",
"name": null,
"show": true,
"values": []
},
"yaxes": [
{
"format": "short",
"label": null,
"logBase": 1,
"max": null,
"min": null,
"show": true
},
{
"format": "short",
"label": null,
"logBase": 1,
"max": null,
"min": null,
"show": true
}
]
},
{
"aliasColors": {},
"bars": false,
"dashLength": 10,
"dashes": false,
"datasource": "${DS_PROMETHEUS}",
"description": "The percent of time spent on Garbage Collection over all CPUs assigned to the JVM process.",
"fill": 1,
"id": 138,
"legend": {
"avg": false,
"current": true,
"max": true,
"min": false,
"show": true,
"total": false,
"values": true
},
"lines": true,
"linewidth": 1,
"links": [],
"nullPointMode": "null",
"percentage": false,
"pointradius": 5,
"points": false,
"renderer": "flot",
"seriesOverrides": [],
"spaceLength": 10,
"span": 3,
"stack": false,
"steppedLine": false,
"targets": [
{
"expr": "sum(rate(jvm_gc_pause_seconds_sum{application=\"$application\", instance=\"$instance\"}[1m])) by (application, instance) / on(application, instance) system_cpu_count",
"format": "time_series",
"intervalFactor": 1,
"legendFormat": "CPU time spent on GC",
"refId": "A"
}
],
"thresholds": [],
"timeFrom": null,
"timeShift": null,
"title": "GC Pressure",
"tooltip": {
"shared": true,
"sort": 0,
"value_type": "individual"
},
"type": "graph",
"xaxis": {
"buckets": null,
"mode": "time",
"name": null,
"show": true,
"values": []
},
"yaxes": [
{
"decimals": 1,
"format": "percentunit",
"label": null,
"logBase": 1,
"max": "1",
"min": "0",
"show": true
},
{
"format": "short",
"label": null,
"logBase": 1,
"max": null,
"min": null,
"show": true
}
]
},
{
"aliasColors": {
"debug": "#1F78C1",
"error": "#BF1B00",
"info": "#508642",
"trace": "#6ED0E0",
"warn": "#EAB839"
},
"bars": false,
"dashLength": 10,
"dashes": false,
"datasource": "${DS_PROMETHEUS}",
"editable": true,
"error": false,
"fill": 1,
"grid": {
"leftLogBase": 1,
"leftMax": null,
"leftMin": null,
"rightLogBase": 1,
"rightMax": null,
"rightMin": null
},
"height": "",
"id": 91,
"legend": {
"alignAsTable": false,
"avg": false,
"current": true,
"hideEmpty": false,
"hideZero": false,
"max": true,
"min": false,
"rightSide": false,
"show": true,
"total": false,
"values": true
},
"lines": true,
"linewidth": 1,
"links": [],
"nullPointMode": "null",
"percentage": true,
"pointradius": 5,
"points": false,
"renderer": "flot",
"seriesOverrides": [
{
"alias": "error",
"yaxis": 1
},
{
"alias": "warn",
"yaxis": 1
}
],
"spaceLength": 10,
"span": 6,
"stack": false,
"steppedLine": false,
"targets": [
{
"expr": "increase(logback_events_total{application=\"$application\", instance=\"$instance\"}[1m])",
"format": "time_series",
"interval": "",
"intervalFactor": 2,
"legendFormat": "{{level}}",
"metric": "",
"refId": "A",
"step": 1200
}
],
"thresholds": [],
"timeFrom": null,
"timeShift": null,
"title": "Log Events",
"tooltip": {
"msResolution": false,
"shared": true,
"sort": 0,
"value_type": "individual"
},
"transparent": false,
"type": "graph",
"x-axis": true,
"xaxis": {
"buckets": null,
"mode": "time",
"name": null,
"show": true,
"values": []
},
"y-axis": true,
"y_formats": [
"short",
"short"
],
"yaxes": [
{
"decimals": 0,
"format": "opm",
"label": null,
"logBase": 1,
"max": null,
"min": "0",
"show": true
},
{
"format": "short",
"label": null,
"logBase": 1,
"max": null,
"min": null,
"show": true
}
]
},
{
"aliasColors": {},
"bars": false,
"dashLength": 10,
"dashes": false,
"datasource": "${DS_PROMETHEUS}",
"editable": true,
"error": false,
"fill": 1,
"grid": {
"leftLogBase": 1,
"leftMax": null,
"leftMin": null,
"rightLogBase": 1,
"rightMax": null,
"rightMin": null
},
"id": 61,
"legend": {
"avg": false,
"current": true,
"max": true,
"min": false,
"show": true,
"total": false,
"values": true
},
"lines": true,
"linewidth": 1,
"links": [],
"nullPointMode": "null",
"percentage": false,
"pointradius": 5,
"points": false,
"renderer": "flot",
"seriesOverrides": [],
"spaceLength": 10,
"span": 3,
"stack": false,
"steppedLine": false,
"targets": [
{
"expr": "process_files_open_files{application=\"$application\", instance=\"$instance\"}",
"format": "time_series",
"hide": false,
"intervalFactor": 2,
"legendFormat": "open",
"metric": "",
"refId": "A",
"step": 2400
},
{
"expr": "process_files_max_files{application=\"$application\", instance=\"$instance\"}",
"format": "time_series",
"hide": false,
"intervalFactor": 2,
"legendFormat": "max",
"metric": "",
"refId": "B",
"step": 2400
}
],
"thresholds": [],
"timeFrom": null,
"timeShift": null,
"title": "File Descriptors",
"tooltip": {
"msResolution": false,
"shared": true,
"sort": 0,
"value_type": "cumulative"
},
"type": "graph",
"x-axis": true,
"xaxis": {
"buckets": null,
"mode": "time",
"name": null,
"show": true,
"values": []
},
"y-axis": true,
"y_formats": [
"short",
"short"
],
"yaxes": [
{
"decimals": 0,
"format": "short",
"label": null,
"logBase": 10,
"max": null,
"min": 0,
"show": true
},
{
"format": "short",
"label": null,
"logBase": 1,
"max": null,
"min": null,
"show": true
}
]
}
],
"repeat": null,
"repeatIteration": null,
"repeatRowId": null,
"showTitle": true,
"title": "JVM Misc",
"titleSize": "h6"
},
{
"collapse": false,
"height": "250px",
"panels": [
{
"aliasColors": {},
"bars": false,
"dashLength": 10,
"dashes": false,
"datasource": "${DS_PROMETHEUS}",
"editable": true,
"error": false,
"fill": 1,
"grid": {
"leftLogBase": 1,
"leftMax": null,
"leftMin": null,
"rightLogBase": 1,
"rightMax": null,
"rightMin": null
},
"id": 3,
"legend": {
"alignAsTable": false,
"avg": false,
"current": true,
"max": true,
"min": false,
"rightSide": false,
"show": true,
"total": false,
"values": true
},
"lines": true,
"linewidth": 1,
"links": [],
"minSpan": 4,
"nullPointMode": "null",
"percentage": false,
"pointradius": 5,
"points": false,
"renderer": "flot",
"repeat": "jvm_memory_pool_heap",
"seriesOverrides": [],
"spaceLength": 10,
"span": 4,
"stack": false,
"steppedLine": false,
"targets": [
{
"expr": "jvm_memory_used_bytes{application=\"$application\", instance=\"$instance\", id=~\"$jvm_memory_pool_heap\"}",
"format": "time_series",
"hide": false,
"interval": "",
"intervalFactor": 2,
"legendFormat": "used",
"metric": "",
"refId": "A",
"step": 1800
},
{
"expr": "jvm_memory_committed_bytes{application=\"$application\", instance=\"$instance\", id=~\"$jvm_memory_pool_heap\"}",
"format": "time_series",
"hide": false,
"interval": "",
"intervalFactor": 2,
"legendFormat": "commited",
"metric": "",
"refId": "B",
"step": 1800
},
{
"expr": "jvm_memory_max_bytes{application=\"$application\", instance=\"$instance\", id=~\"$jvm_memory_pool_heap\"}",
"format": "time_series",
"hide": false,
"interval": "",
"intervalFactor": 2,
"legendFormat": "max",
"metric": "",
"refId": "C",
"step": 1800
}
],
"thresholds": [],
"timeFrom": null,
"timeShift": null,
"title": "$jvm_memory_pool_heap",
"tooltip": {
"msResolution": false,
"shared": true,
"sort": 0,
"value_type": "cumulative"
},
"type": "graph",
"x-axis": true,
"xaxis": {
"buckets": null,
"mode": "time",
"name": null,
"show": true,
"values": []
},
"y-axis": true,
"y_formats": [
"mbytes",
"short"
],
"yaxes": [
{
"format": "bytes",
"label": null,
"logBase": 1,
"max": null,
"min": 0,
"show": true
},
{
"format": "short",
"label": null,
"logBase": 1,
"max": null,
"min": null,
"show": true
}
]
}
],
"repeat": "persistence_counts",
"repeatIteration": null,
"repeatRowId": null,
"showTitle": true,
"title": "JVM Memory Pools (Heap)",
"titleSize": "h6"
},
{
"collapse": false,
"height": 250,
"panels": [
{
"aliasColors": {},
"bars": false,
"dashLength": 10,
"dashes": false,
"datasource": "${DS_PROMETHEUS}",
"editable": true,
"error": false,
"fill": 1,
"grid": {
"leftLogBase": 1,
"leftMax": null,
"leftMin": null,
"rightLogBase": 1,
"rightMax": null,
"rightMin": null
},
"id": 78,
"legend": {
"alignAsTable": false,
"avg": false,
"current": true,
"max": true,
"min": false,
"rightSide": false,
"show": true,
"total": false,
"values": true
},
"lines": true,
"linewidth": 1,
"links": [],
"minSpan": 4,
"nullPointMode": "null",
"percentage": false,
"pointradius": 5,
"points": false,
"renderer": "flot",
"repeat": "jvm_memory_pool_nonheap",
"seriesOverrides": [],
"spaceLength": 10,
"span": 4,
"stack": false,
"steppedLine": false,
"targets": [
{
"expr": "jvm_memory_used_bytes{application=\"$application\", instance=\"$instance\", id=~\"$jvm_memory_pool_nonheap\"}",
"format": "time_series",
"hide": false,
"interval": "",
"intervalFactor": 2,
"legendFormat": "used",
"metric": "",
"refId": "A",
"step": 1800
},
{
"expr": "jvm_memory_committed_bytes{application=\"$application\", instance=\"$instance\", id=~\"$jvm_memory_pool_nonheap\"}",
"format": "time_series",
"hide": false,
"interval": "",
"intervalFactor": 2,
"legendFormat": "commited",
"metric": "",
"refId": "B",
"step": 1800
},
{
"expr": "jvm_memory_max_bytes{application=\"$application\", instance=\"$instance\", id=~\"$jvm_memory_pool_nonheap\"}",
"format": "time_series",
"hide": false,
"interval": "",
"intervalFactor": 2,
"legendFormat": "max",
"metric": "",
"refId": "C",
"step": 1800
}
],
"thresholds": [],
"timeFrom": null,
"timeShift": null,
"title": "$jvm_memory_pool_nonheap",
"tooltip": {
"msResolution": false,
"shared": true,
"sort": 0,
"value_type": "cumulative"
},
"type": "graph",
"x-axis": true,
"xaxis": {
"buckets": null,
"mode": "time",
"name": null,
"show": true,
"values": []
},
"y-axis": true,
"y_formats": [
"mbytes",
"short"
],
"yaxes": [
{
"format": "bytes",
"label": null,
"logBase": 1,
"max": null,
"min": 0,
"show": true
},
{
"format": "short",
"label": null,
"logBase": 1,
"max": null,
"min": null,
"show": true
}
]
}
],
"repeat": null,
"repeatIteration": null,
"repeatRowId": null,
"showTitle": true,
"title": "JVM Memory Pools (Non-Heap)",
"titleSize": "h6"
},
{
"collapse": false,
"height": 250,
"panels": [
{
"aliasColors": {},
"bars": false,
"dashLength": 10,
"dashes": false,
"datasource": "${DS_PROMETHEUS}",
"fill": 1,
"id": 98,
"legend": {
"avg": false,
"current": false,
"max": false,
"min": false,
"show": true,
"total": false,
"values": false
},
"lines": true,
"linewidth": 1,
"links": [],
"nullPointMode": "null",
"percentage": false,
"pointradius": 5,
"points": false,
"renderer": "flot",
"seriesOverrides": [],
"spaceLength": 10,
"span": 4,
"stack": false,
"steppedLine": false,
"targets": [
{
"expr": "rate(jvm_gc_pause_seconds_count{application=\"$application\", instance=\"$instance\"}[1m])",
"format": "time_series",
"hide": false,
"intervalFactor": 1,
"legendFormat": "{{action}} ({{cause}})",
"refId": "A"
}
],
"thresholds": [],
"timeFrom": null,
"timeShift": null,
"title": "Collections",
"tooltip": {
"shared": true,
"sort": 0,
"value_type": "individual"
},
"type": "graph",
"xaxis": {
"buckets": null,
"mode": "time",
"name": null,
"show": true,
"values": []
},
"yaxes": [
{
"format": "ops",
"label": null,
"logBase": 1,
"max": null,
"min": "0",
"show": true
},
{
"format": "short",
"label": "",
"logBase": 1,
"max": null,
"min": null,
"show": true
}
]
},
{
"aliasColors": {},
"bars": false,
"dashLength": 10,
"dashes": false,
"datasource": "${DS_PROMETHEUS}",
"fill": 1,
"id": 101,
"legend": {
"avg": false,
"current": false,
"max": false,
"min": false,
"show": true,
"total": false,
"values": false
},
"lines": true,
"linewidth": 1,
"links": [],
"nullPointMode": "null",
"percentage": false,
"pointradius": 5,
"points": false,
"renderer": "flot",
"seriesOverrides": [],
"spaceLength": 10,
"span": 4,
"stack": false,
"steppedLine": false,
"targets": [
{
"expr": "rate(jvm_gc_pause_seconds_sum{application=\"$application\", instance=\"$instance\"}[1m])/rate(jvm_gc_pause_seconds_count{application=\"$application\", instance=\"$instance\"}[1m])",
"format": "time_series",
"hide": false,
"instant": false,
"intervalFactor": 1,
"legendFormat": "avg {{action}} ({{cause}})",
"refId": "A"
},
{
"expr": "jvm_gc_pause_seconds_max{application=\"$application\", instance=\"$instance\"}",
"format": "time_series",
"hide": false,
"instant": false,
"intervalFactor": 1,
"legendFormat": "max {{action}} ({{cause}})",
"refId": "B"
}
],
"thresholds": [],
"timeFrom": null,
"timeShift": null,
"title": "Pause Durations",
"tooltip": {
"shared": true,
"sort": 0,
"value_type": "individual"
},
"type": "graph",
"xaxis": {
"buckets": null,
"mode": "time",
"name": null,
"show": true,
"values": []
},
"yaxes": [
{
"format": "s",
"label": null,
"logBase": 1,
"max": null,
"min": "0",
"show": true
},
{
"format": "short",
"label": "",
"logBase": 1,
"max": null,
"min": null,
"show": true
}
]
},
{
"aliasColors": {},
"bars": false,
"dashLength": 10,
"dashes": false,
"datasource": "${DS_PROMETHEUS}",
"fill": 1,
"id": 99,
"legend": {
"avg": false,
"current": false,
"max": false,
"min": false,
"show": true,
"total": false,
"values": false
},
"lines": true,
"linewidth": 1,
"links": [],
"nullPointMode": "null",
"percentage": false,
"pointradius": 5,
"points": false,
"renderer": "flot",
"seriesOverrides": [],
"spaceLength": 10,
"span": 4,
"stack": false,
"steppedLine": false,
"targets": [
{
"expr": "rate(jvm_gc_memory_allocated_bytes_total{application=\"$application\", instance=\"$instance\"}[1m])",
"format": "time_series",
"interval": "",
"intervalFactor": 1,
"legendFormat": "allocated",
"refId": "A"
},
{
"expr": "rate(jvm_gc_memory_promoted_bytes_total{application=\"$application\", instance=\"$instance\"}[1m])",
"format": "time_series",
"interval": "",
"intervalFactor": 1,
"legendFormat": "promoted",
"refId": "B"
}
],
"thresholds": [],
"timeFrom": null,
"timeShift": null,
"title": "Allocated/Promoted",
"tooltip": {
"shared": true,
"sort": 0,
"value_type": "individual"
},
"type": "graph",
"xaxis": {
"buckets": null,
"mode": "time",
"name": null,
"show": true,
"values": []
},
"yaxes": [
{
"format": "Bps",
"label": null,
"logBase": 1,
"max": null,
"min": "0",
"show": true
},
{
"format": "short",
"label": null,
"logBase": 1,
"max": null,
"min": null,
"show": true
}
]
}
],
"repeat": null,
"repeatIteration": null,
"repeatRowId": null,
"showTitle": true,
"title": "Garbage Collection",
"titleSize": "h6"
},
{
"collapse": false,
"height": "250px",
"panels": [
{
"aliasColors": {},
"bars": false,
"dashLength": 10,
"dashes": false,
"datasource": "${DS_PROMETHEUS}",
"editable": true,
"error": false,
"fill": 1,
"grid": {
"leftLogBase": 1,
"leftMax": null,
"leftMin": null,
"rightLogBase": 1,
"rightMax": null,
"rightMin": null
},
"id": 37,
"legend": {
"avg": false,
"current": false,
"max": false,
"min": false,
"show": true,
"total": false,
"values": false
},
"lines": true,
"linewidth": 1,
"links": [],
"nullPointMode": "null",
"percentage": false,
"pointradius": 5,
"points": false,
"renderer": "flot",
"seriesOverrides": [],
"spaceLength": 10,
"span": 6,
"stack": false,
"steppedLine": false,
"targets": [
{
"expr": "jvm_classes_loaded_classes{application=\"$application\", instance=\"$instance\"}",
"format": "time_series",
"intervalFactor": 2,
"legendFormat": "loaded",
"metric": "",
"refId": "A",
"step": 1200
}
],
"thresholds": [],
"timeFrom": null,
"timeShift": null,
"title": "Classes loaded",
"tooltip": {
"msResolution": false,
"shared": true,
"sort": 0,
"value_type": "cumulative"
},
"type": "graph",
"x-axis": true,
"xaxis": {
"buckets": null,
"mode": "time",
"name": null,
"show": true,
"values": []
},
"y-axis": true,
"y_formats": [
"short",
"short"
],
"yaxes": [
{
"format": "short",
"label": null,
"logBase": 1,
"max": null,
"min": 0,
"show": true
},
{
"format": "short",
"label": null,
"logBase": 1,
"max": null,
"min": null,
"show": true
}
]
},
{
"aliasColors": {},
"bars": false,
"dashLength": 10,
"dashes": false,
"datasource": "${DS_PROMETHEUS}",
"editable": true,
"error": false,
"fill": 1,
"grid": {
"leftLogBase": 1,
"leftMax": null,
"leftMin": null,
"rightLogBase": 1,
"rightMax": null,
"rightMin": null
},
"id": 38,
"legend": {
"avg": false,
"current": false,
"max": false,
"min": false,
"show": true,
"total": false,
"values": false
},
"lines": true,
"linewidth": 1,
"links": [],
"nullPointMode": "null",
"percentage": false,
"pointradius": 5,
"points": false,
"renderer": "flot",
"seriesOverrides": [],
"spaceLength": 10,
"span": 6,
"stack": false,
"steppedLine": false,
"targets": [
{
"expr": "delta(jvm_classes_loaded_classes{application=\"$application\",instance=\"$instance\"}[1m])",
"format": "time_series",
"hide": false,
"interval": "",
"intervalFactor": 1,
"legendFormat": "delta-1m",
"metric": "",
"refId": "A",
"step": 1200
}
],
"thresholds": [],
"timeFrom": null,
"timeShift": null,
"title": "Class delta",
"tooltip": {
"msResolution": false,
"shared": true,
"sort": 0,
"value_type": "cumulative"
},
"type": "graph",
"x-axis": true,
"xaxis": {
"buckets": null,
"mode": "time",
"name": null,
"show": true,
"values": []
},
"y-axis": true,
"y_formats": [
"ops",
"short"
],
"yaxes": [
{
"decimals": null,
"format": "short",
"label": "",
"logBase": 1,
"max": null,
"min": null,
"show": true
},
{
"format": "short",
"label": null,
"logBase": 1,
"max": null,
"min": null,
"show": true
}
]
}
],
"repeat": null,
"repeatIteration": null,
"repeatRowId": null,
"showTitle": true,
"title": "Classloading",
"titleSize": "h6"
},
{
"collapse": false,
"height": "250px",
"panels": [
{
"aliasColors": {},
"bars": false,
"dashLength": 10,
"dashes": false,
"datasource": "${DS_PROMETHEUS}",
"fill": 1,
"id": 131,
"legend": {
"avg": false,
"current": false,
"max": false,
"min": false,
"show": true,
"total": false,
"values": false
},
"lines": true,
"linewidth": 1,
"links": [],
"minSpan": 4,
"nullPointMode": "null",
"percentage": false,
"pointradius": 5,
"points": false,
"renderer": "flot",
"repeat": "jvm_buffer_pool",
"seriesOverrides": [
{
"alias": "count",
"yaxis": 2
},
{
"alias": "buffers",
"yaxis": 2
}
],
"spaceLength": 10,
"span": 4,
"stack": false,
"steppedLine": false,
"targets": [
{
"expr": "jvm_buffer_memory_used_bytes{application=\"$application\", instance=\"$instance\", id=~\"$jvm_buffer_pool\"}",
"format": "time_series",
"intervalFactor": 2,
"legendFormat": "used",
"refId": "A"
},
{
"expr": "jvm_buffer_total_capacity_bytes{application=\"$application\", instance=\"$instance\", id=~\"$jvm_buffer_pool\"}",
"format": "time_series",
"intervalFactor": 2,
"legendFormat": "capacity",
"refId": "B"
},
{
"expr": "jvm_buffer_count_buffers{application=\"$application\", instance=\"$instance\", id=~\"$jvm_buffer_pool\"}",
"format": "time_series",
"hide": false,
"intervalFactor": 2,
"legendFormat": "buffers",
"refId": "C"
}
],
"thresholds": [],
"timeFrom": null,
"timeShift": null,
"title": "$jvm_buffer_pool",
"tooltip": {
"shared": true,
"sort": 0,
"value_type": "individual"
},
"type": "graph",
"xaxis": {
"buckets": null,
"mode": "time",
"name": null,
"show": true,
"values": []
},
"yaxes": [
{
"format": "decbytes",
"label": null,
"logBase": 1,
"max": null,
"min": "0",
"show": true
},
{
"decimals": 0,
"format": "short",
"label": "",
"logBase": 1,
"max": null,
"min": "0",
"show": true
}
]
}
],
"repeat": null,
"repeatIteration": null,
"repeatRowId": null,
"showTitle": true,
"title": "Buffer Pools",
"titleSize": "h6"
}
],
"schemaVersion": 14,
"style": "dark",
"tags": [],
"templating": {
"list": [
{
"allValue": null,
"current": {},
"datasource": "${DS_PROMETHEUS}",
"hide": 0,
"includeAll": false,
"label": "Application",
"multi": false,
"name": "application",
"options": [],
"query": "label_values(application)",
"refresh": 2,
"regex": "",
"sort": 0,
"tagValuesQuery": "",
"tags": [],
"tagsQuery": "",
"type": "query",
"useTags": false
},
{
"allFormat": "glob",
"allValue": null,
"current": {},
"datasource": "${DS_PROMETHEUS}",
"hide": 0,
"includeAll": false,
"label": "Instance",
"multi": false,
"multiFormat": "glob",
"name": "instance",
"options": [],
"query": "label_values(jvm_memory_used_bytes{application=\"$application\"}, instance)",
"refresh": 2,
"regex": "",
"sort": 0,
"tagValuesQuery": "",
"tags": [],
"tagsQuery": "",
"type": "query",
"useTags": false
},
{
"allFormat": "glob",
"allValue": null,
"current": {},
"datasource": "${DS_PROMETHEUS}",
"hide": 2,
"includeAll": true,
"label": "JVM Memory Pools Heap",
"multi": false,
"multiFormat": "glob",
"name": "jvm_memory_pool_heap",
"options": [],
"query": "label_values(jvm_memory_used_bytes{application=\"$application\", instance=\"$instance\", area=\"heap\"},id)",
"refresh": 1,
"regex": "",
"sort": 1,
"tagValuesQuery": "",
"tags": [],
"tagsQuery": "",
"type": "query",
"useTags": false
},
{
"allFormat": "glob",
"allValue": null,
"current": {},
"datasource": "${DS_PROMETHEUS}",
"hide": 2,
"includeAll": true,
"label": "JVM Memory Pools Non-Heap",
"multi": false,
"multiFormat": "glob",
"name": "jvm_memory_pool_nonheap",
"options": [],
"query": "label_values(jvm_memory_used_bytes{application=\"$application\", instance=\"$instance\", area=\"nonheap\"},id)",
"refresh": 1,
"regex": "",
"sort": 2,
"tagValuesQuery": "",
"tags": [],
"tagsQuery": "",
"type": "query",
"useTags": false
},
{
"allFormat": "glob",
"allValue": null,
"current": {},
"datasource": "${DS_PROMETHEUS}",
"hide": 2,
"includeAll": true,
"label": "JVM Buffer Pools",
"multi": false,
"multiFormat": "glob",
"name": "jvm_buffer_pool",
"options": [],
"query": "label_values(jvm_buffer_memory_used_bytes{application=\"$application\", instance=\"$instance\"},id)",
"refresh": 1,
"regex": "",
"sort": 1,
"tagValuesQuery": "",
"tags": [],
"tagsQuery": "",
"type": "query",
"useTags": false
}
]
},
"time": {
"from": "now-24h",
"to": "now"
},
"timepicker": {
"now": true,
"refresh_intervals": [
"5s",
"10s",
"30s",
"1m",
"5m",
"15m",
"30m",
"1h",
"2h",
"1d"
],
"time_options": [
"5m",
"15m",
"1h",
"6h",
"12h",
"24h",
"2d",
"7d",
"30d"
]
},
"timezone": "browser",
"title": "JVM (Micrometer)",
"version": 33
}
4.tw嵌入式jar包本地引入依赖并测试运行
本次示范用的是TongWeb7.0.E.6_P5下的spring-boot-accesslog-2.x:
请在本地开发环境配置好mavernhome,配置教程如下:
maven环境变量配置(超详细!)
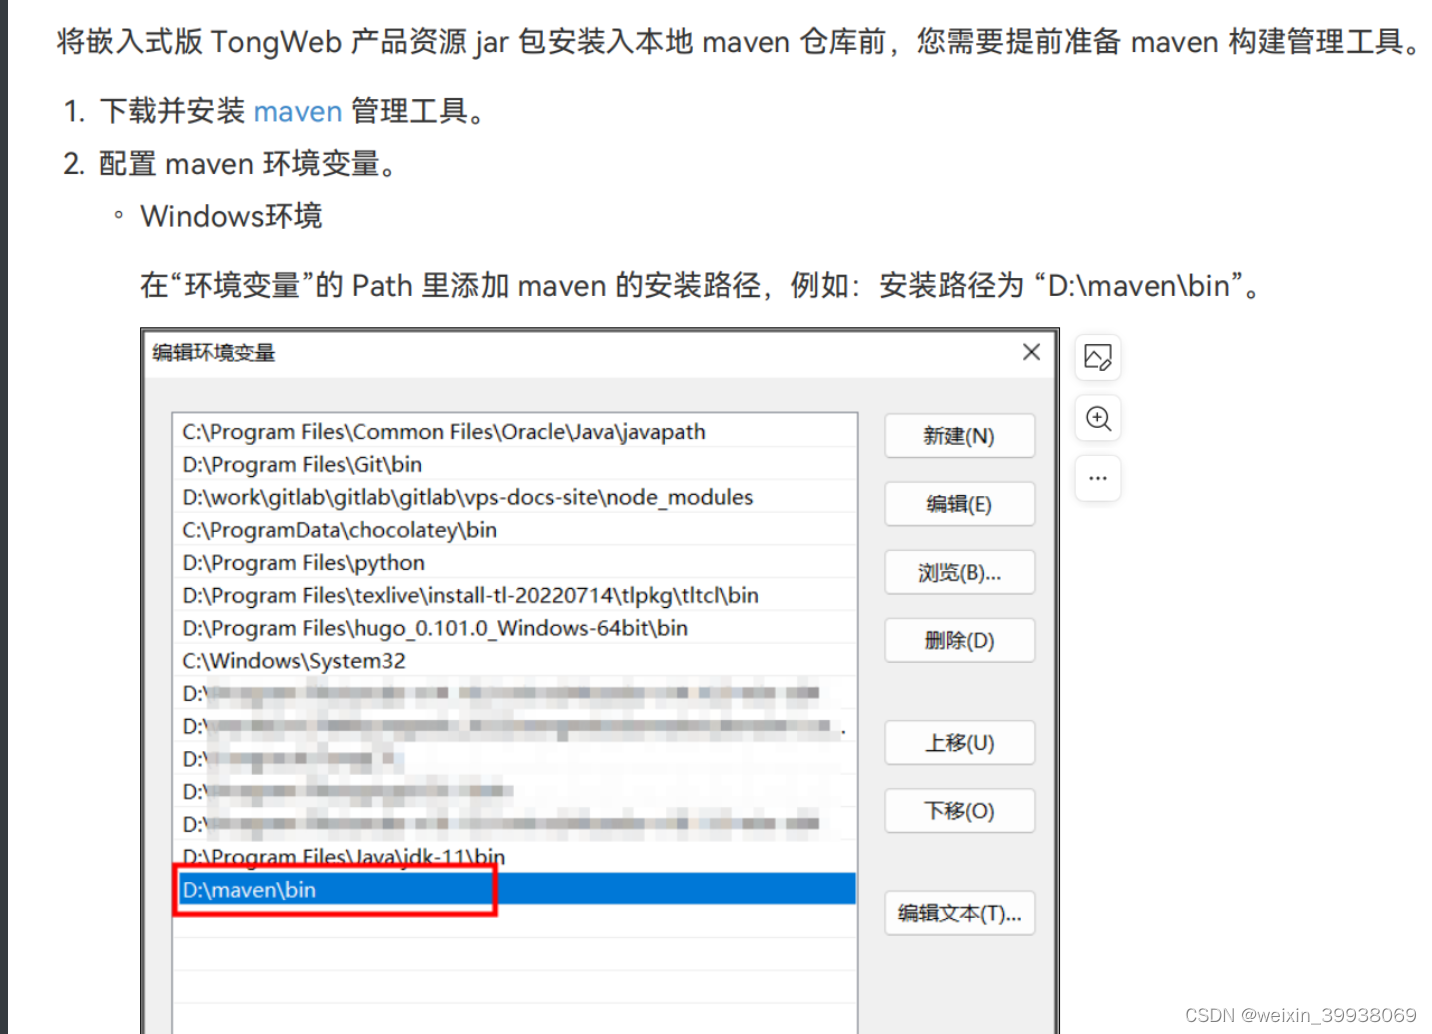
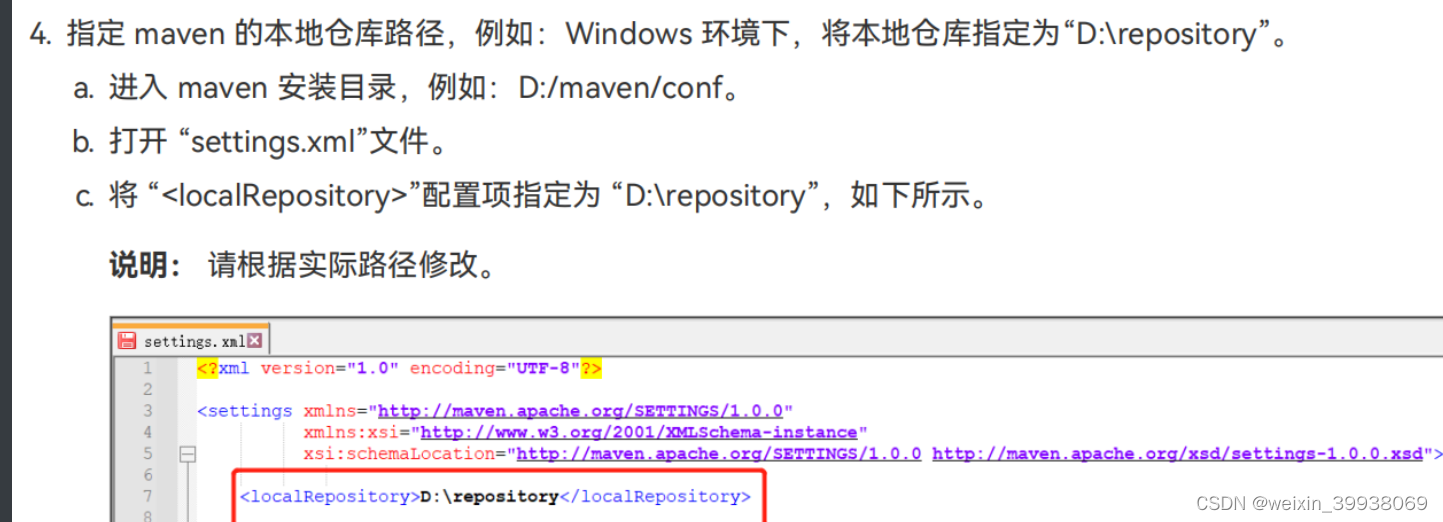
配置后,window下,使用 installAll-{n} 脚本,解压 TongWeb 嵌入式版资源包,将 lib 目录中的 jar 包安装到本地 maven 仓库。
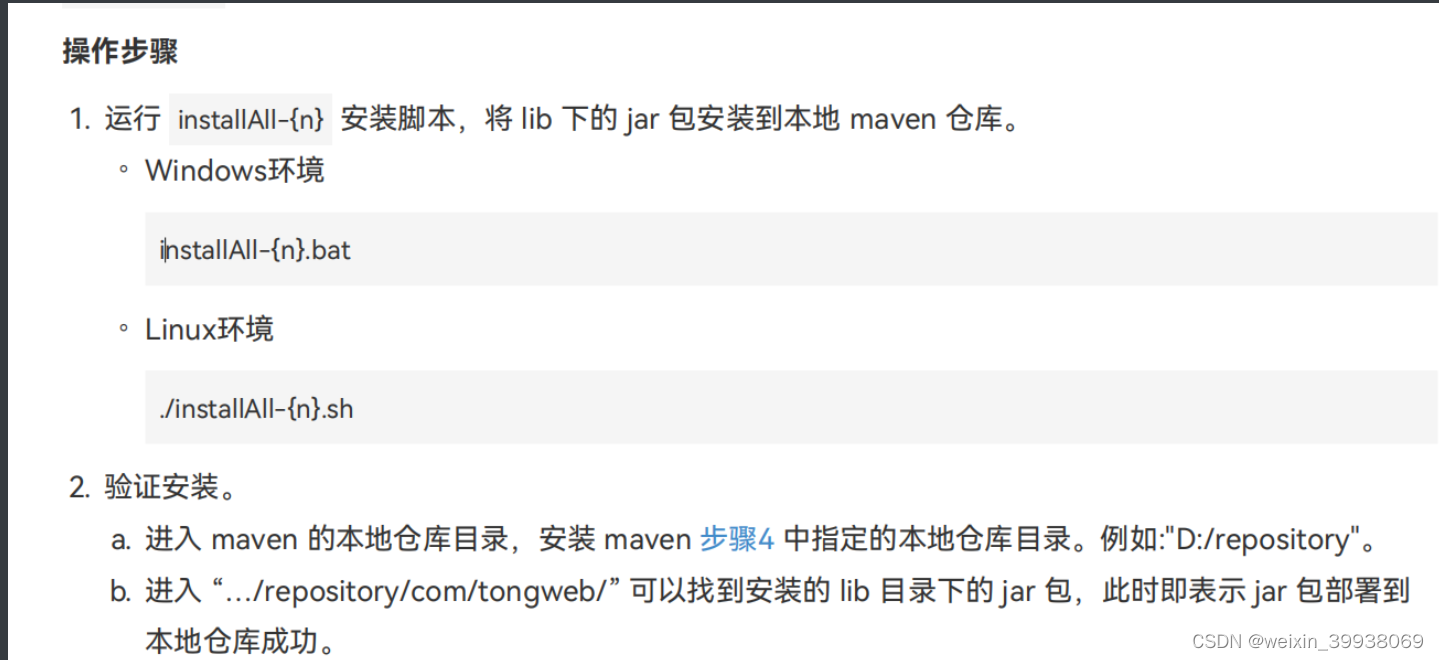
配置以下依赖到pom文件里(这一步可以参考手册:TongWeb V7.0 嵌入式版_JavaEE标准容器用户指南,记得去掉tomcat的依赖):
   <!--TongWeb 嵌入式版提供的与springboot集成的starter。 -->
        <dependency>
           <groupId>org.springframework.boot</groupId>
           <artifactId>spring-boot-starter-websocket</artifactId>
        </dependency>
        <dependency>
          <groupId>com.tongweb.springboot</groupId>
            <artifactId>tongweb-spring-boot-websocket-2.x</artifactId>
           <version>7.0.E.6_P5</version>
        </dependency>
        <dependency>
           <groupId>com.tongweb.springboot</groupId>
           <artifactId>tongweb-spring-boot-starter-2.x</artifactId>
           <version>7.0.E.6_P5</version>
        </dependency>
        <dependency>
           <groupId>org.springframework.boot</groupId>
            <artifactId>spring-boot-starter-web</artifactId>
           <exclusions>
          <exclusion>
           <groupId>org.springframework.boot</groupId>
            <artifactId>spring-boot-starter-tomcat</artifactId>
          </exclusion>
       </exclusions>
        </dependency>
        <!-- jsp支持-->
        <dependency>
            <groupId>com.tongweb</groupId>
            <artifactId>tongweb-jsp</artifactId>
            <version>7.0.E.6_P5</version>
        </dependency>
刷新maven,然后看看tongweb的依赖是否已经导入到项目里
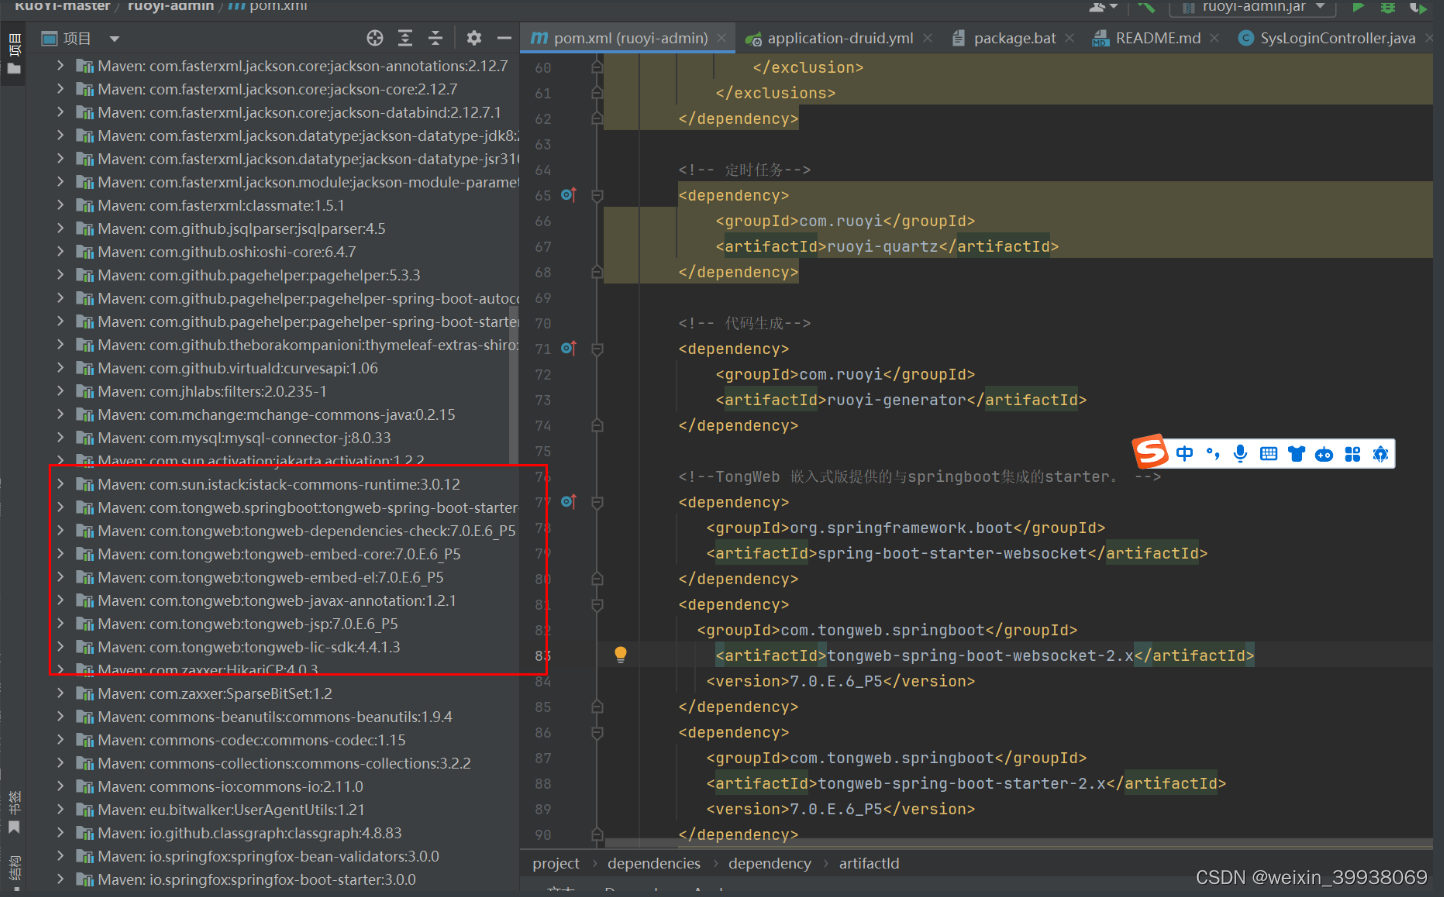
授权文件放入到resource目录下,propeities配置文件配置:
server.tongweb.license.path=classpath:license.dat
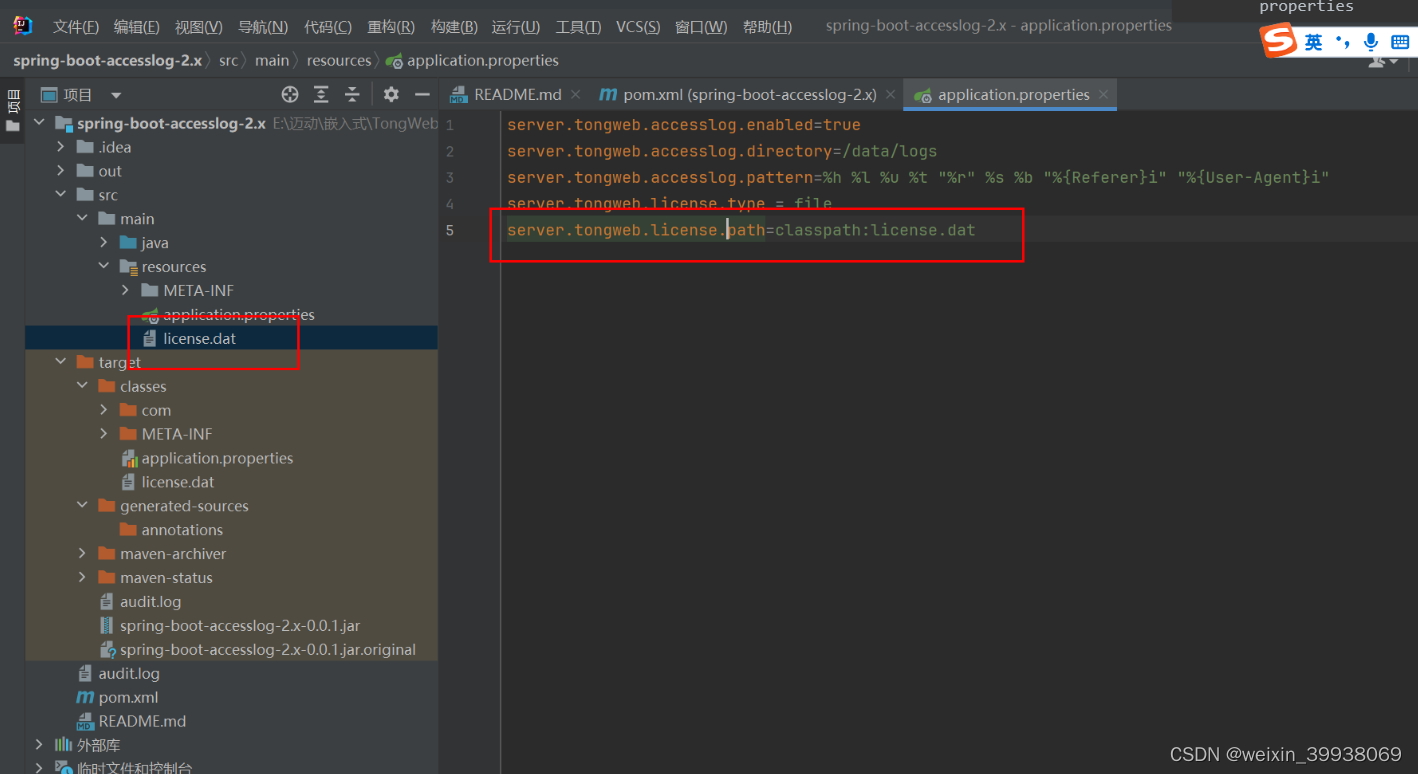
如果用的不是propeities文件,配置参考如下:
server:
  tongweb:
    license:
      path: classpath:license.dat
之后进行打包,打包看看有没有报错,有的话看看报错信息,如果是依赖冲突,可以使用mavenhelp,参考:
maven解决包冲突简单方式(插件maven helper | maven指令)
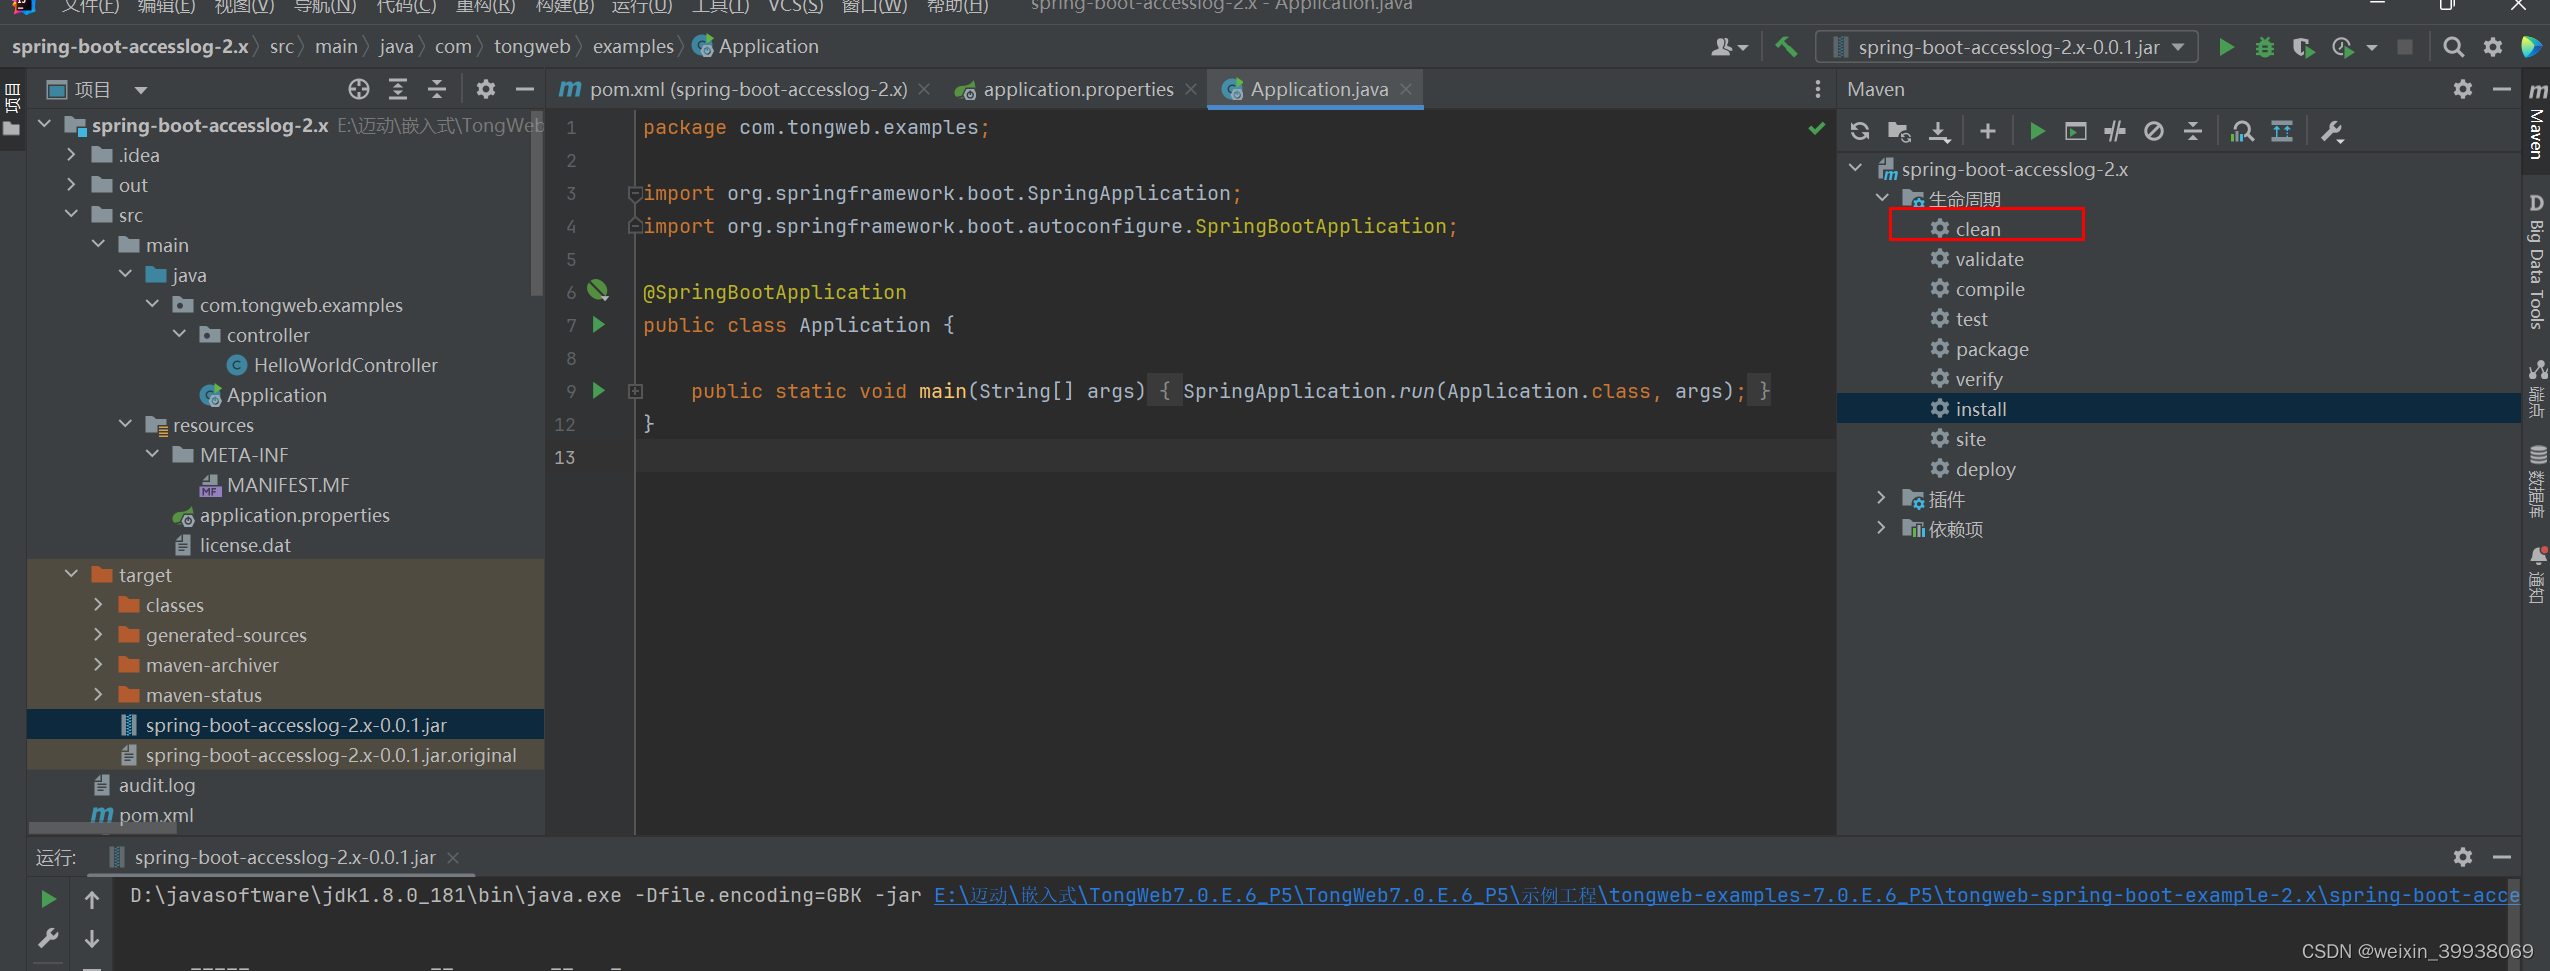
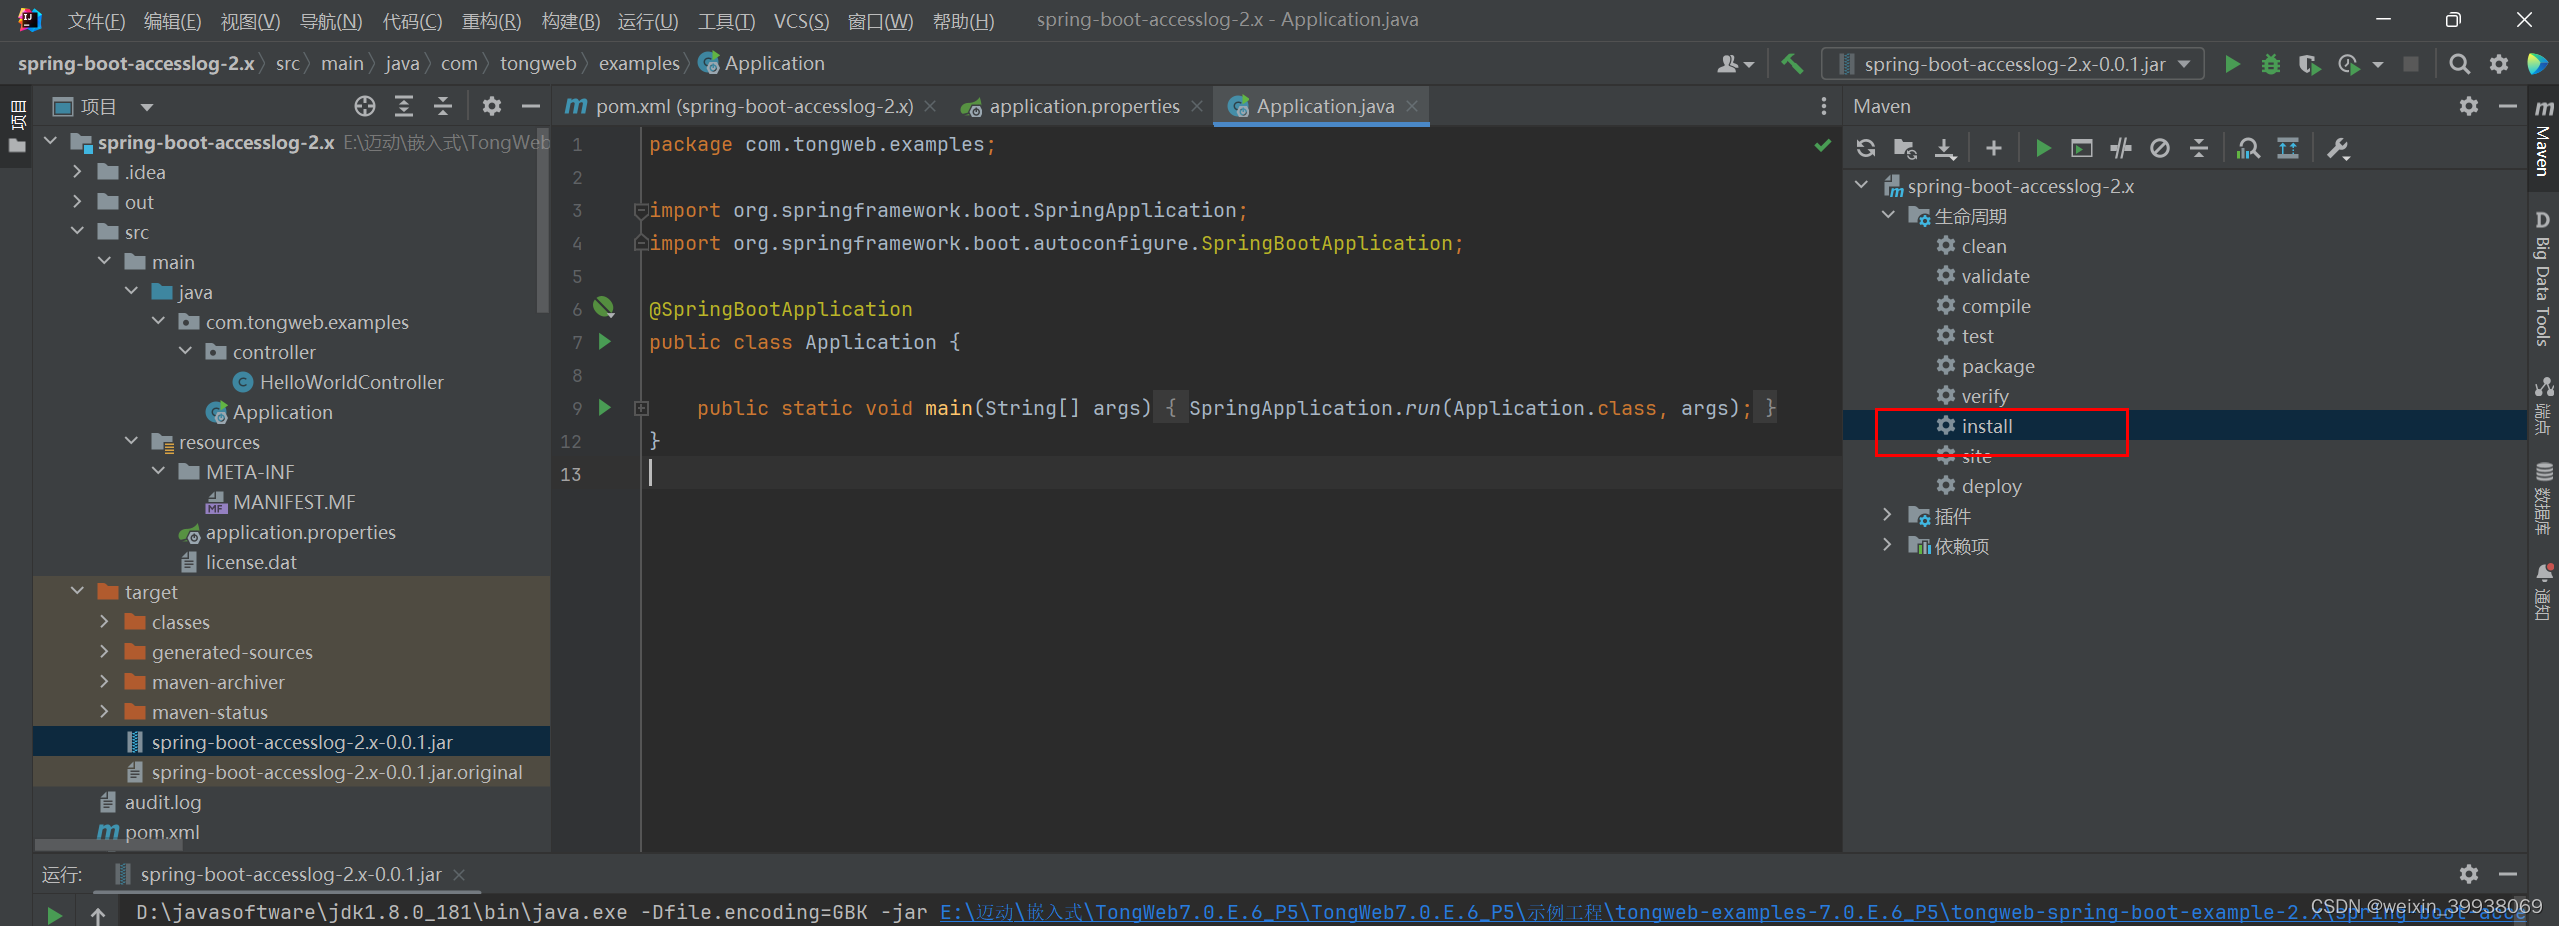
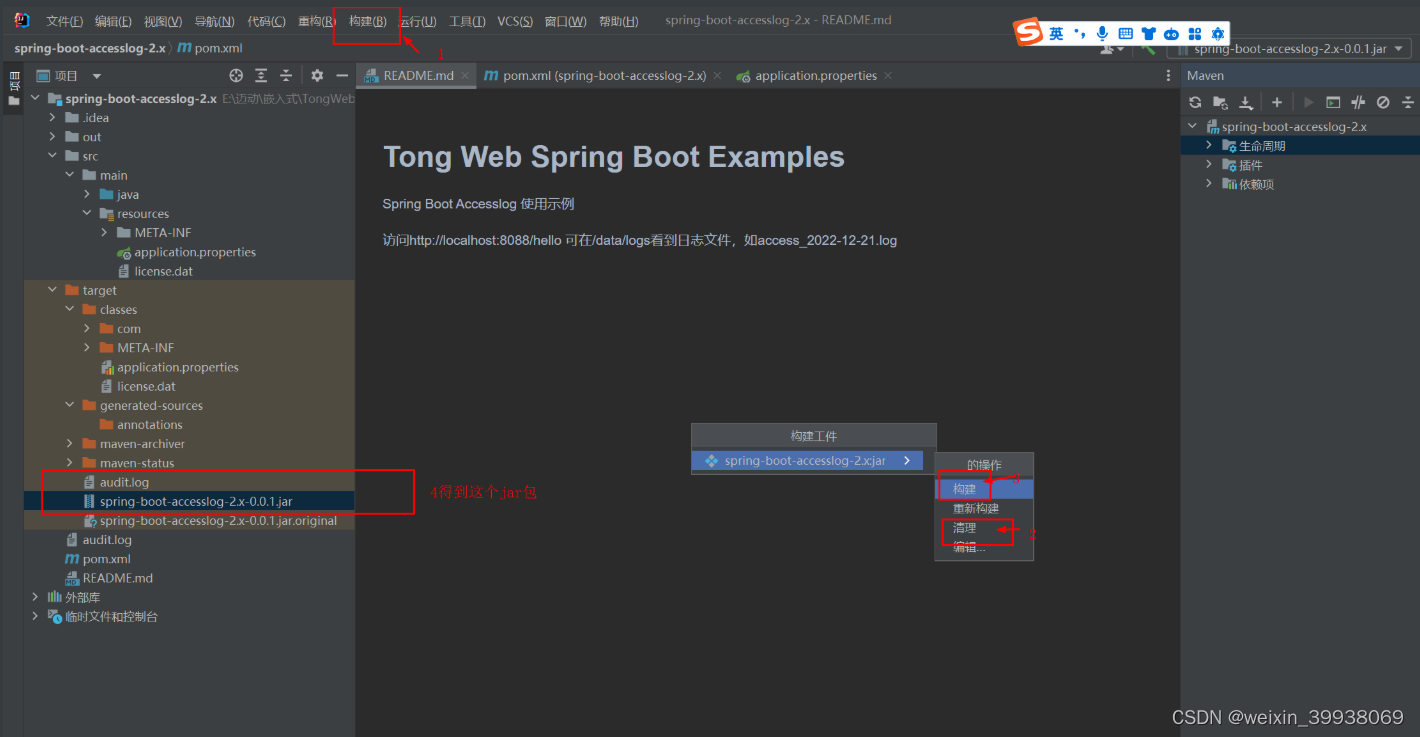
打包后最好在本地跑一次看看有没有问题。
5.运行jmx_prometheus_javaagent-0.19.0.jar形式获取监控数据(方法一)
方法一和方法二任选其一即可。
将打包好的应用jar包和已经下载好的jmx.xxxjar放入到服务器,下面是我放入服务器的目录截图:
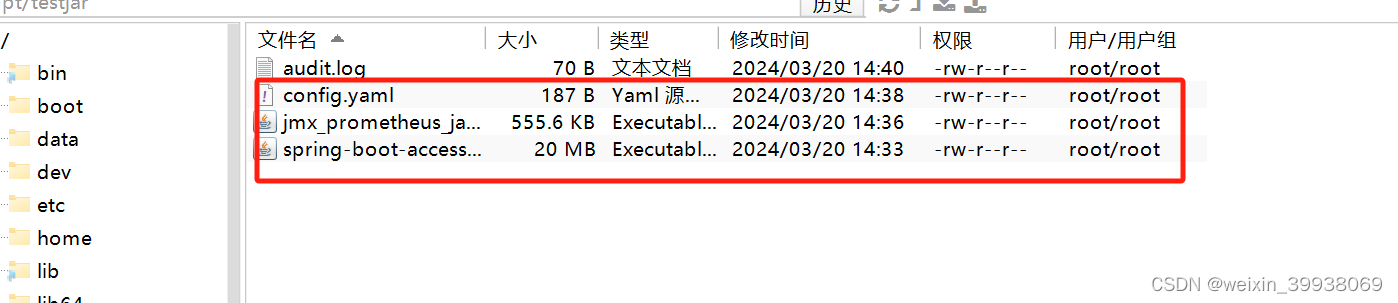
自己新建一个config.yaml,最好喝上传的jmx的jar包放一起,以下是配置内容:
wercaseOutputLabelNames: true
lowercaseOutputName: true
whitelistObjectNames: ["java.lang:type=OperatingSystem", "TONGWEB:*","config:*"]
blacklistObjectNames: []
rules:
  - pattern: ".*"
执行指令启动应用
java -javaagent:jmx_prometheus_javaagent-0.19.0.jar=39081:config.yaml -jar spring-boot-accesslog-2.x-0.0.1.jar
访问服务器ip:39081/metrics
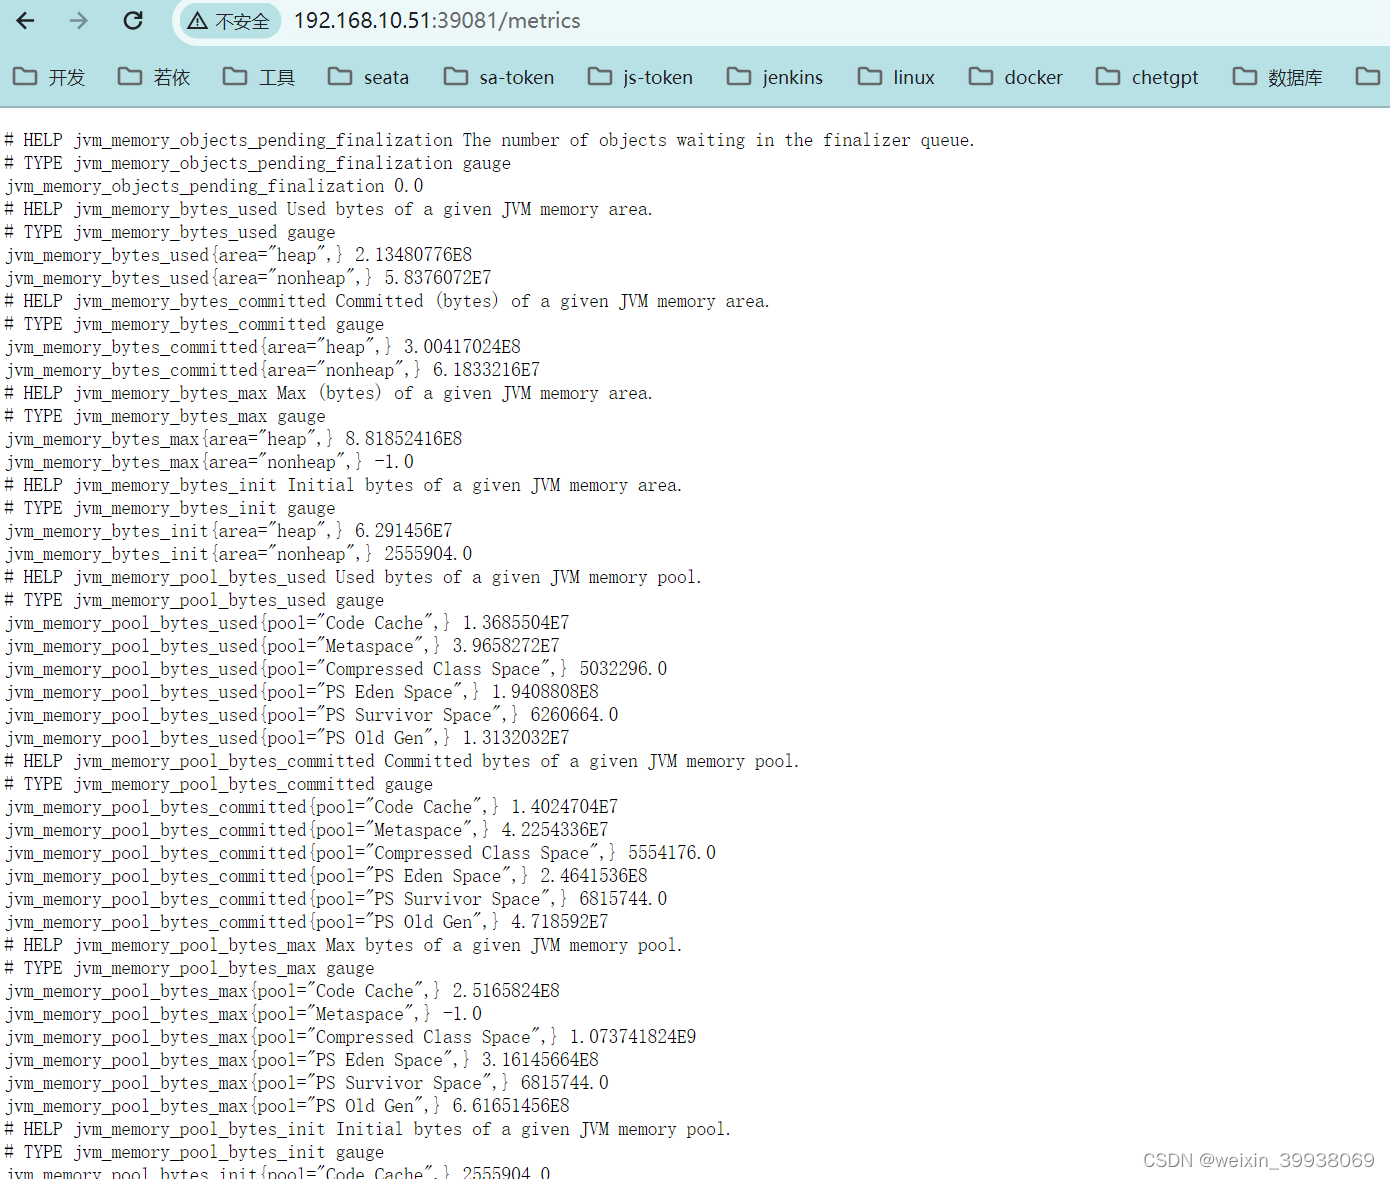
6.使用Actuator 获取监听数据(方法二)
方法一和方法二任选其一即可。选择了方法二的可以跳过这一步。
请在项目的pom.xml文件中添加以下两个依赖坐标:
	<!--整合prometheus-->
		<dependency>
			<groupId>io.micrometer</groupId>
			<artifactId>micrometer-registry-prometheus</artifactId>
		</dependency>

		<dependency>
			<groupId>org.springframework.boot</groupId>
			<artifactId>spring-boot-starter-actuator</artifactId>
		</dependency>
添加后下载好依赖,然后在application.properties配置文件里添加这一段:
server.tongweb.license.path=classpath:license.dat
management.server.port=9099
management.endpoints.web.base-path=/actuator
management.endpoints.web.exposure.include=*
添加打包成jar吧,上传到服务器,或者在本地执行java -jar 应用jar包名,测试访问ip:9099/actuator/prometheus:
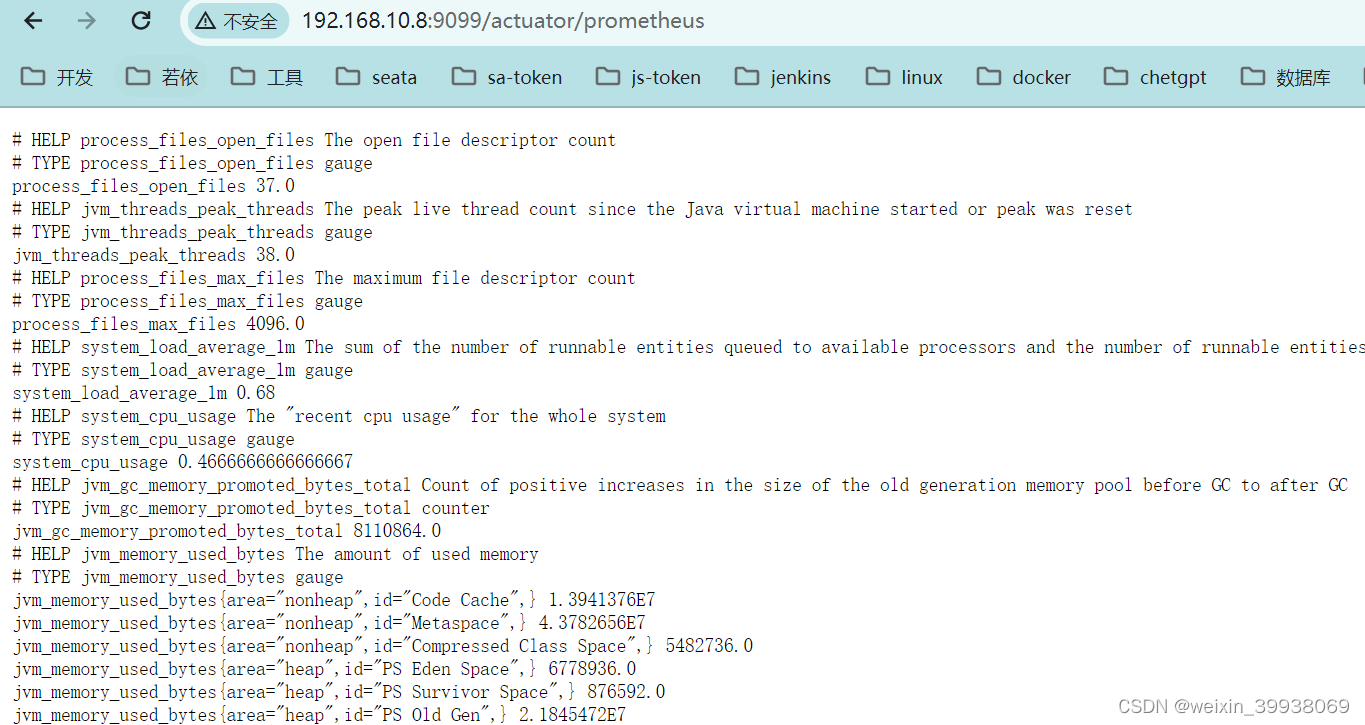
如上图所示即为成功。
7.Prometheus部署
参考:一篇文章搞定Prometheus普罗米修斯监控系统的部署
8.Prometheus配置
配置prometheus.yml:
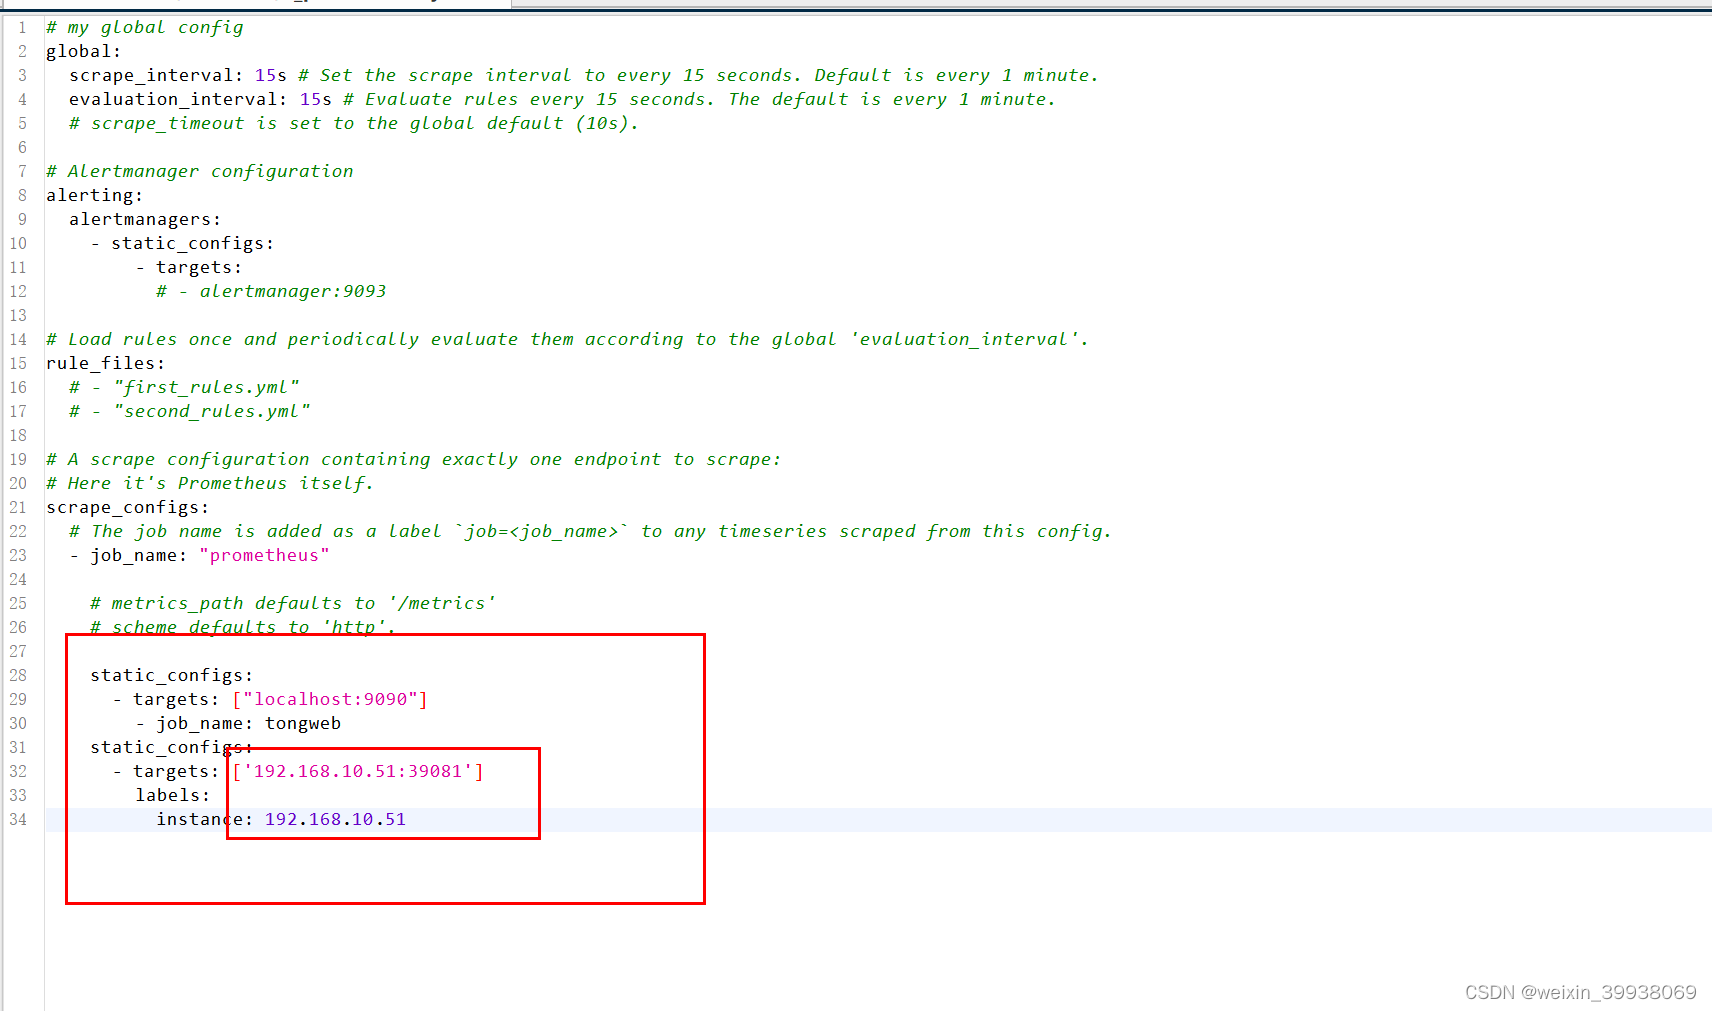
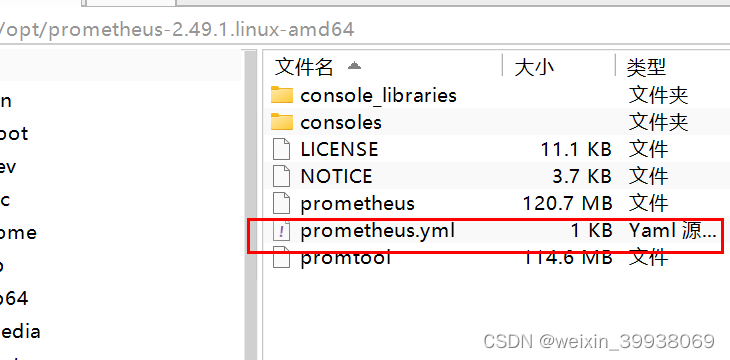
方法一的配置参考(注意缩进,192.168.10.51和39081分别对应的是tongweb这边的端口和ip):
    static_configs:
      - targets: ["localhost:9090"]
        - job_name: tongweb
    static_configs:
      - targets: ['192.168.10.51:39081']
        labels:
          instance: 192.168.10.51
下面是我本地方法一的配置文件,自行删除不需要的部分:
global:
  scrape_interval: 15s        # Set the scrape interval to every 15 seconds. Default is every 1 minute.
  evaluation_interval: 15s    # Evaluate rules every 15 seconds. The default is every 1 minute.
  # scrape_timeout is set to the global default (10s).

alerting:
  alertmanagers:
    - static_configs:
        - targets:
          # - alertmanager:9093

rule_files:
  # - "first_rules.yml"
  # - "second_rules.yml"

scrape_configs:
  - job_name: "prometheus"
    # metrics_path defaults to '/metrics'
    # scheme defaults to 'http'.
    static_configs:
      - targets: ["localhost:9090"]

  - job_name: 'Prometheus19'
    metrics_path: /metrics
    static_configs:
      - targets:
        - rds
    relabel_configs:
      - source_labels: [__address__]
        target_label: __param_target
      - source_labels: [__param_target]
        target_label: instance
      - target_label: __address__
        replacement: 192.168.10.19:9098

  - job_name: 'Prometheus20'
    metrics_path: /metrics
    static_configs:
      - targets:
        - rds
    relabel_configs:
      - source_labels: [__address__]
        target_label: __param_target
      - source_labels: [__param_target]
        target_label: instance
      - target_label: __address__
        replacement: 192.168.10.20:9098

  - job_name: "tongweb"
    static_configs:
      - targets: ['192.168.10.51:39081']
        labels:
          instance: 192.168.10.51
方法二的配置:
  - job_name: 'tongweb'
    static_configs:
      - targets: ['10.2.1.231:9527']

  - job_name: 'prometheusapp'
    metrics_path: '/actuator/prometheus'
    static_configs:
      - targets: ['10.2.1.159:8080']
以下是我在本地使用的方法二的配置文件,自行删除不需要的部分
global:
  scrape_interval: 15s        # Set the scrape interval to every 15 seconds. Default is every 1 minute.
  evaluation_interval: 15s    # Evaluate rules every 15 seconds. The default is every 1 minute.
  # scrape_timeout is set to the global default (10s).

alerting:
  alertmanagers:
    - static_configs:
        - targets:
          # - alertmanager:9093

rule_files:
  # - "first_rules.yml"
  # - "second_rules.yml"

scrape_configs:
  - job_name: "prometheus"
    # metrics_path defaults to '/metrics'
    # scheme defaults to 'http'.
    static_configs:
      - targets: ["localhost:9090"]

  - job_name: 'Prometheus19'
    metrics_path: /metrics
    static_configs:
      - targets:
        - rds
    relabel_configs:
      - source_labels: [__address__]
        target_label: __param_target
      - source_labels: [__param_target]
        target_label: instance
      - target_label: __address__
        replacement: 192.168.10.19:9098

  - job_name: 'Prometheus20'
    metrics_path: /metrics
    static_configs:
      - targets:
        - rds
    relabel_configs:
      - source_labels: [__address__]
        target_label: __param_target
      - source_labels: [__param_target]
        target_label: instance
      - target_label: __address__
        replacement: 192.168.10.20:9098

  - job_name: "tongweb"
    static_configs:
      - targets: ['192.168.10.51:39081']
        labels:
          instance: 192.168.10.51

  - job_name: 'spring-actuator-tw'
    metrics_path: '/actuator/prometheus'
    static_configs:
      - targets: ['192.168.10.51:9099']  # 这里填写你的Spring Boot应用的地址和端口
修改完启动Prometheus
cd /usr/local/promethues/

./prometheus --config.file="/usr/local/promethues/prometheus.yml" &

ps ef |grep promethues
访问服务器ip:9090/targets?search=,点击status,target,就可以看到我们配置的信息:
方法一的:
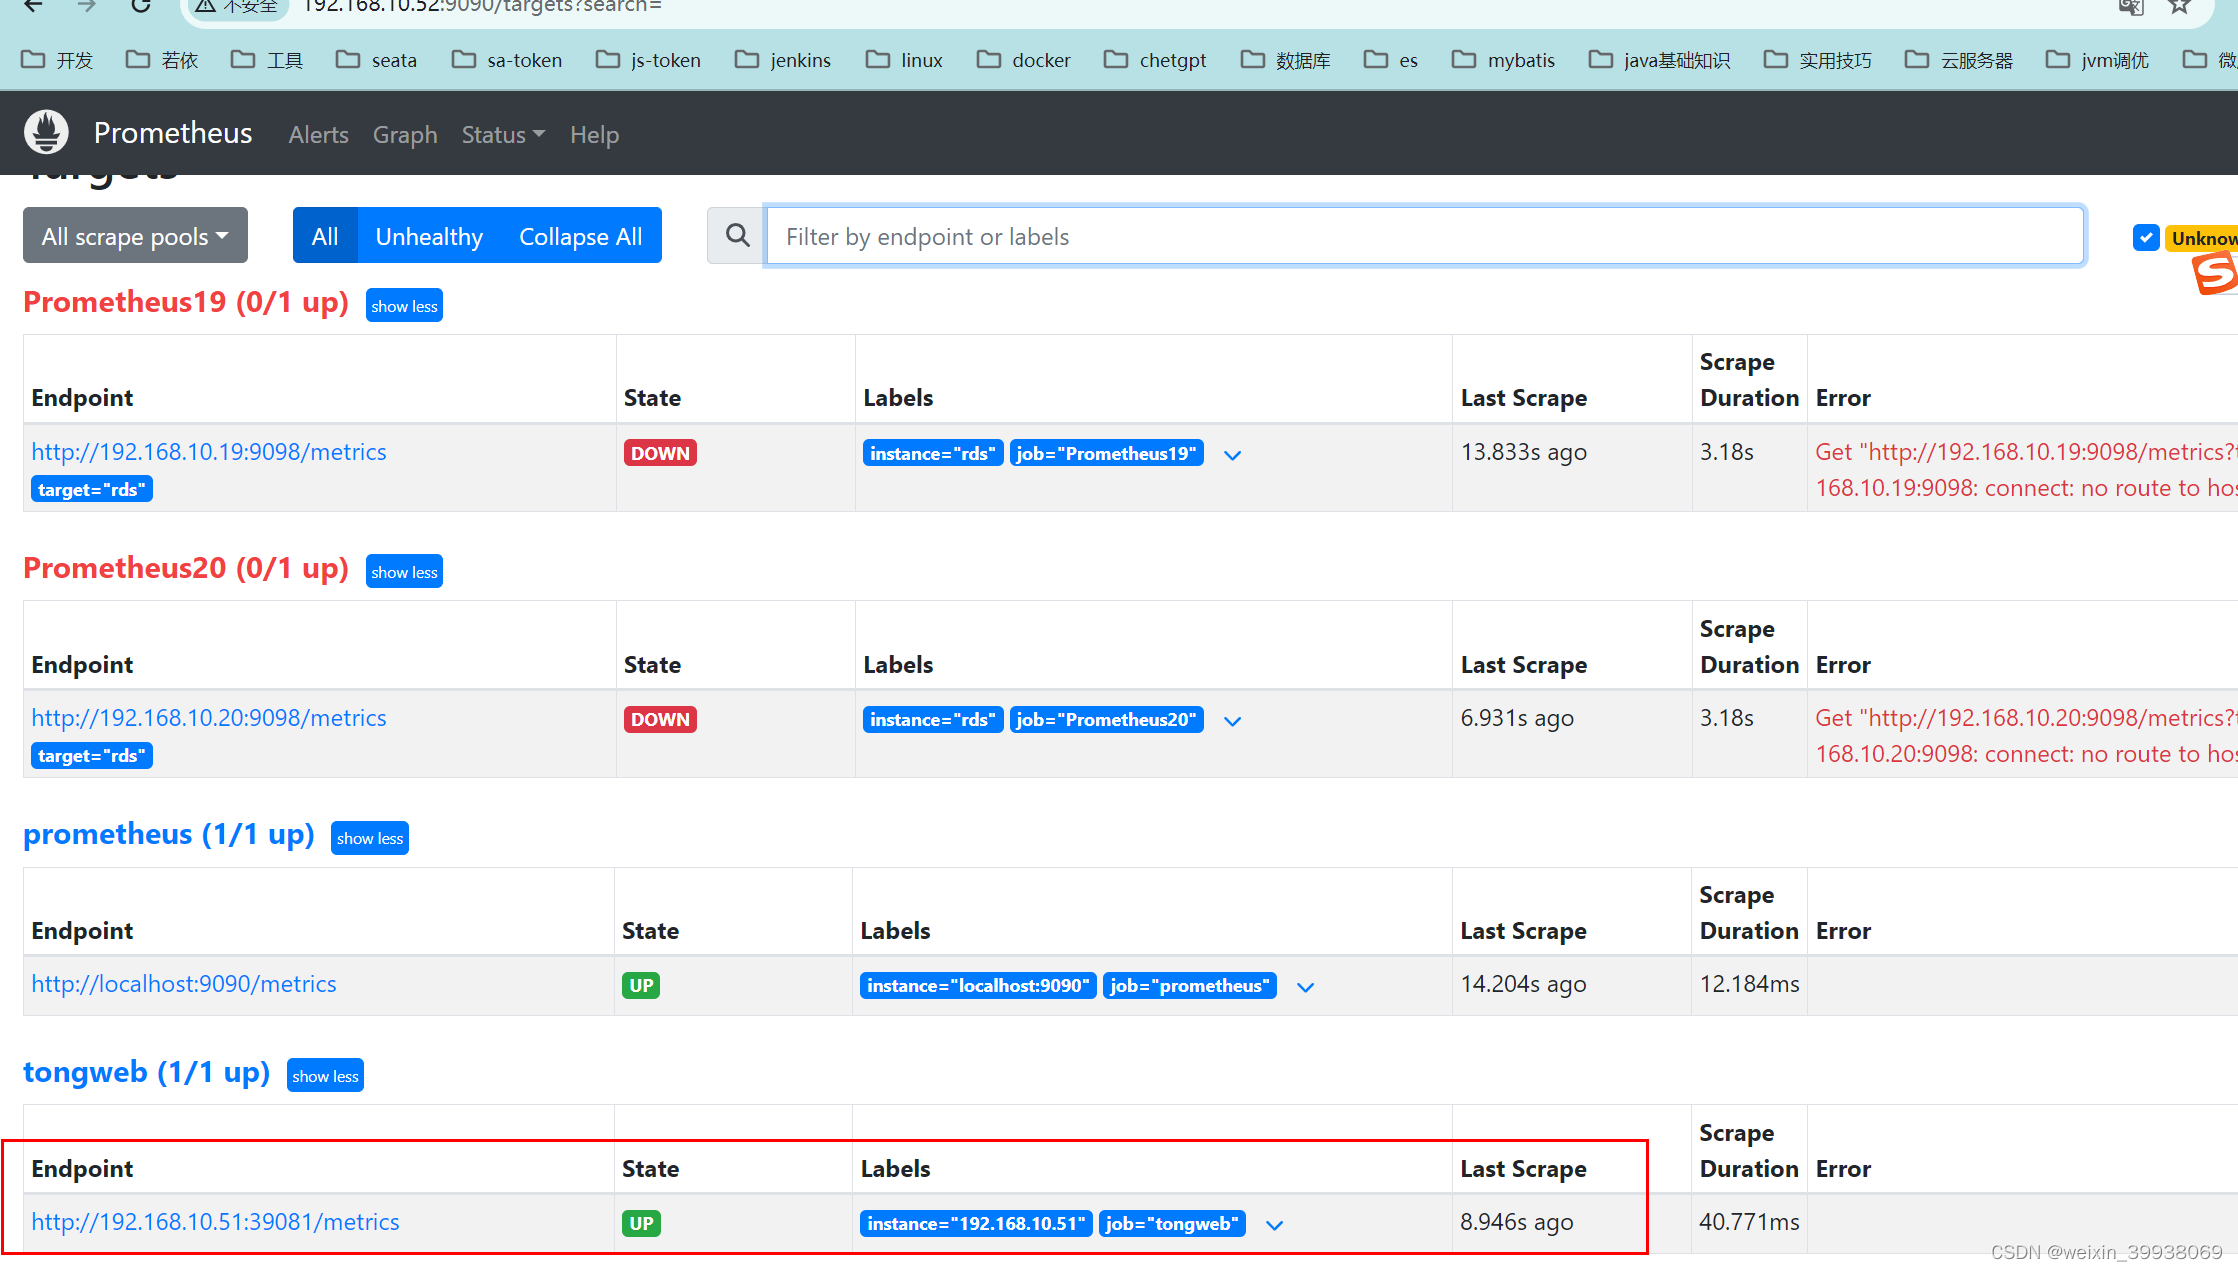
方法二的:
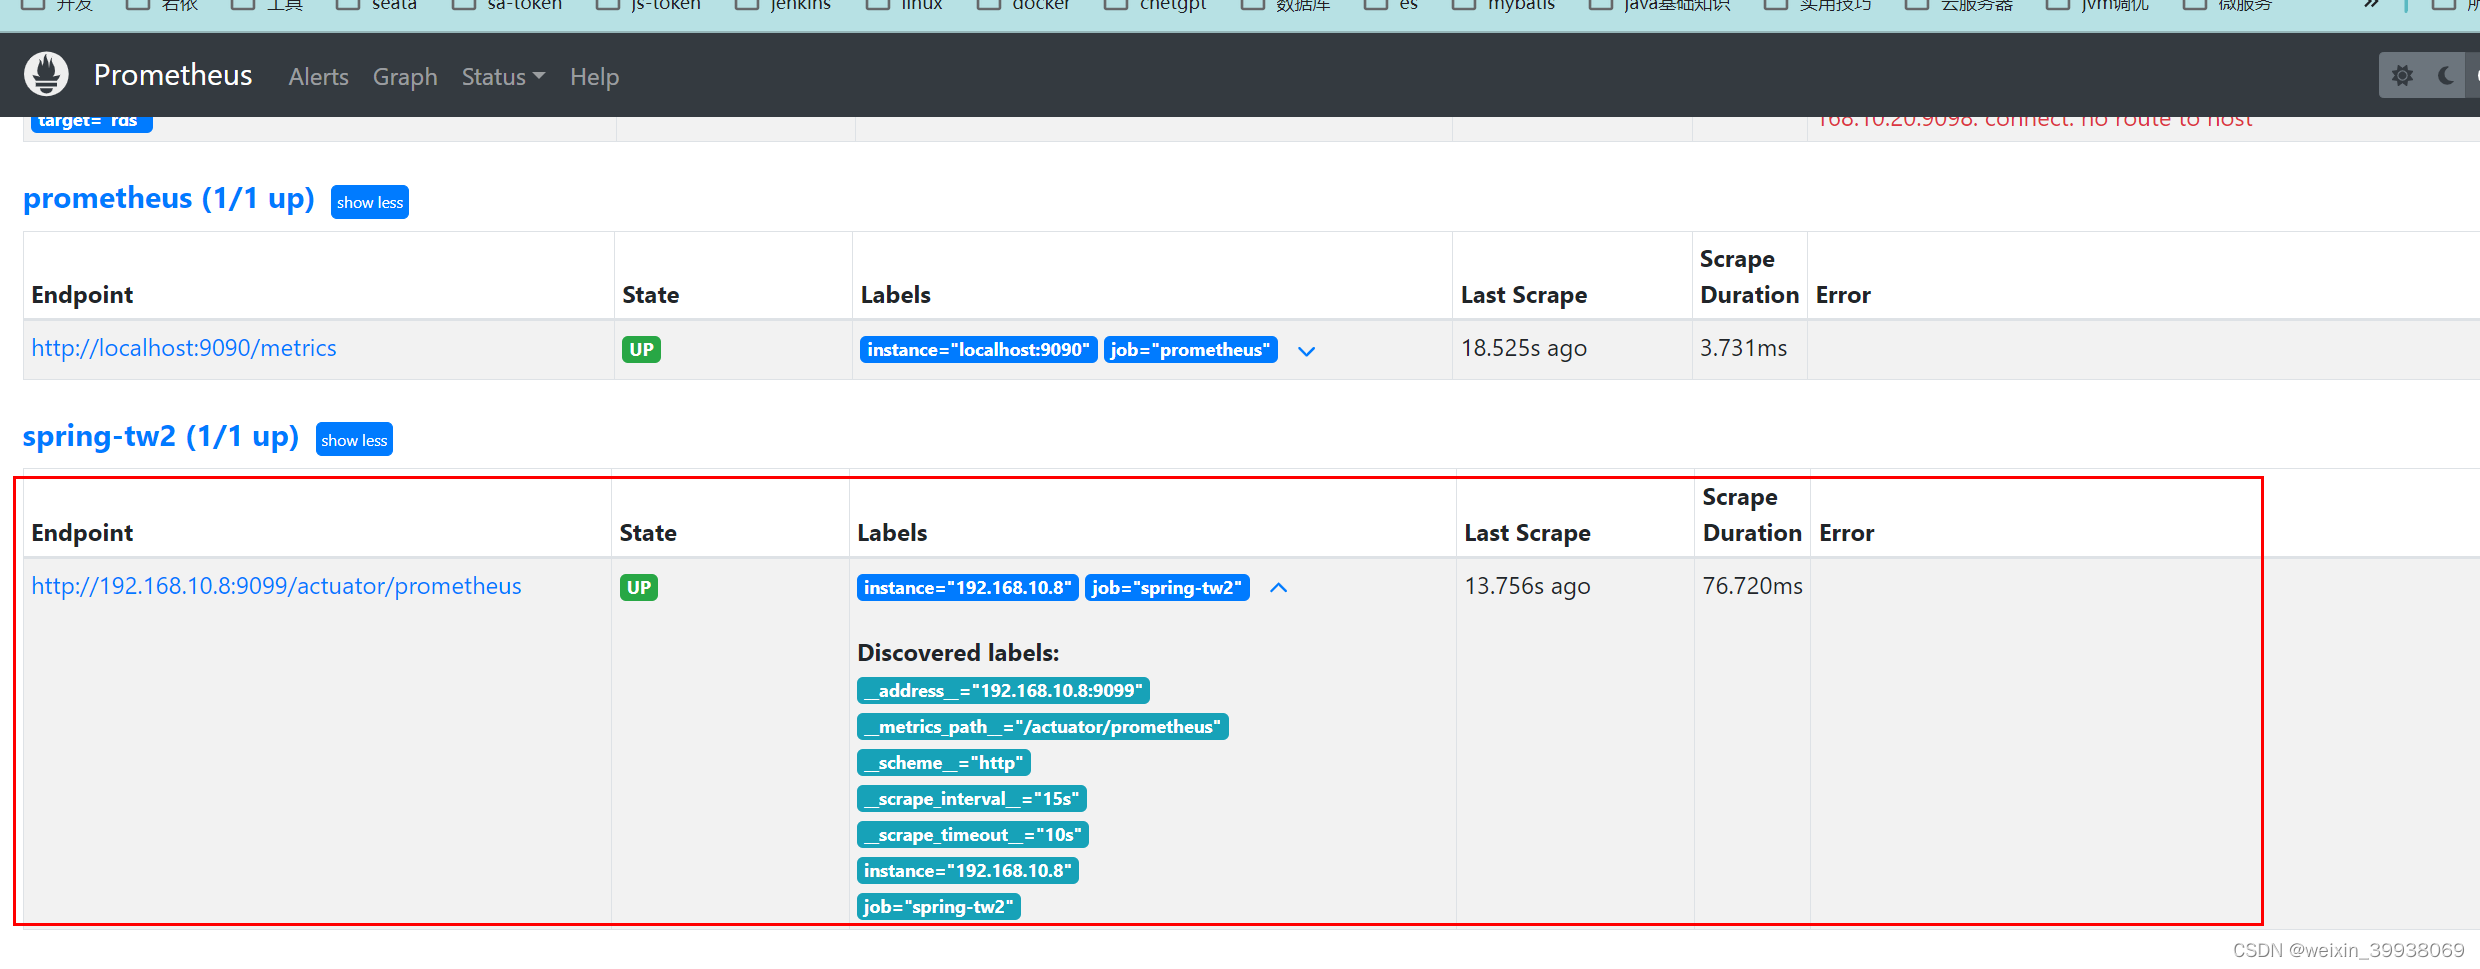
9.安装和配置Grafana
Grafana下载地址
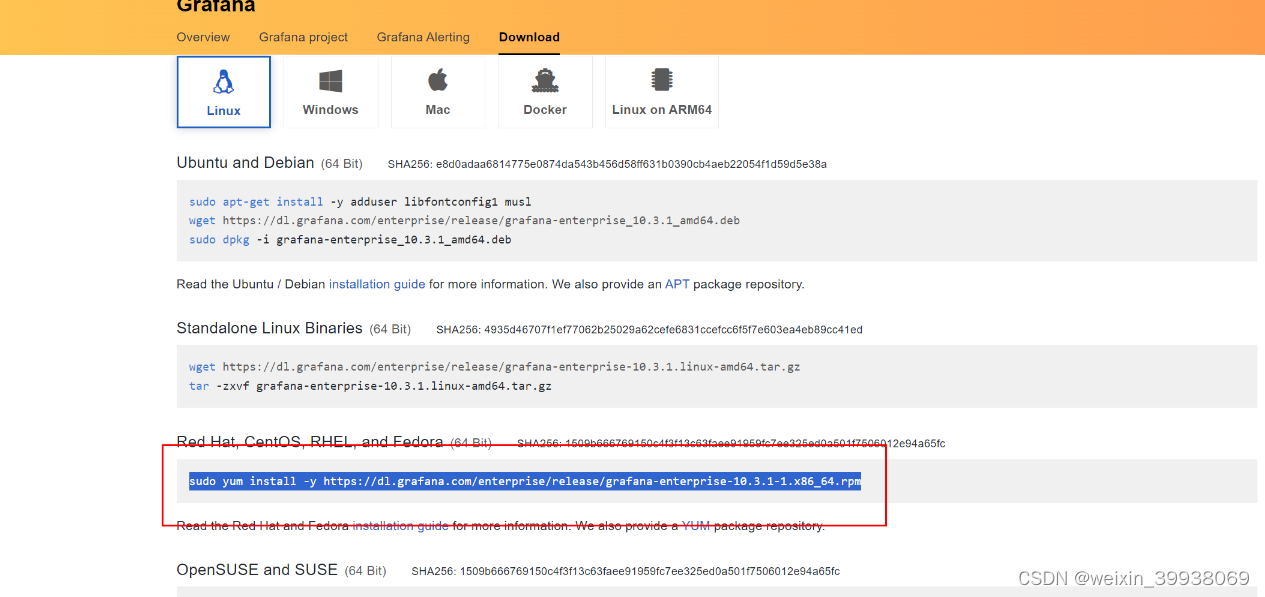
上图的话,安装后用 systemctl start grafana-server 启动,会方便一些。
或者用这个也行,这个的话后面启动要用脚本启动(本文使用这种方式)。
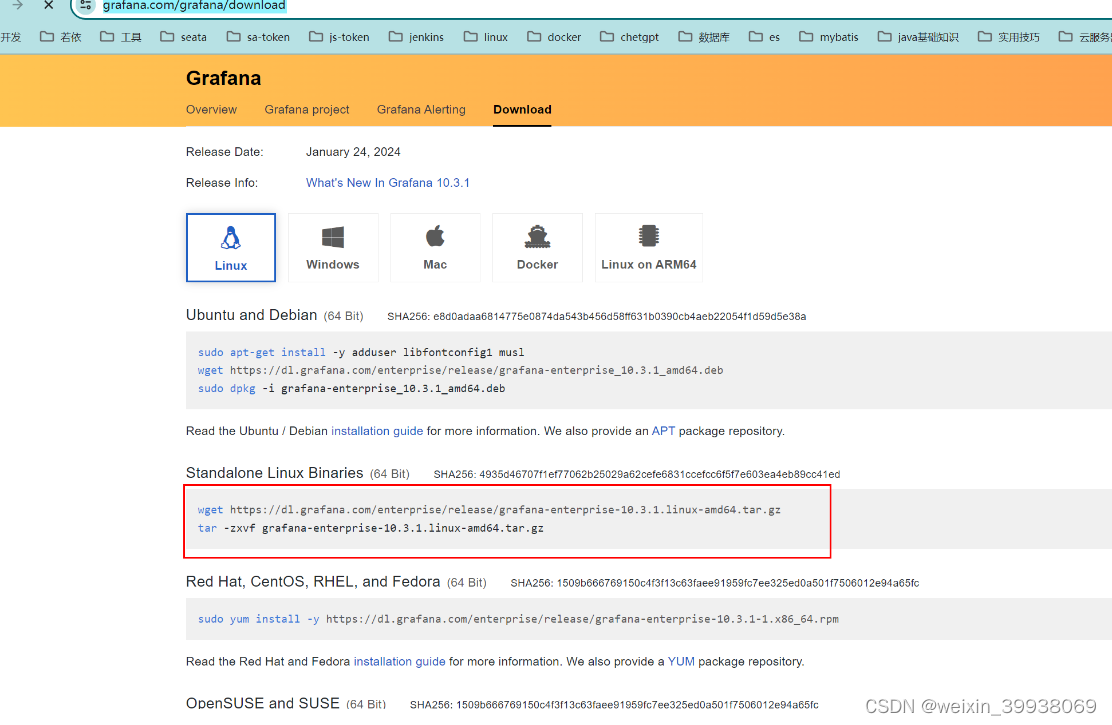
解压一下安装包
tar -vxf grafana-enterprise-10.3.1.linux-amd64.tar.gz
启动:
cd 到安装目录bin目录,执行./grafana-server,然后访问服务器ip:3000
注意:默认账号密码为:
账号:admin
密码:admin


如果你想卸载,可以关闭服务(直接pkill grafana-server也行),直接删除安装目录,然后删除对应配置

```xml
sudo rm -rf /var/lib/grafana
sudo rm -rf /var/log/grafana
sudo rm -rf /etc/grafana
sudo rm -rf /etc/grafana/grafana.ini
sudo rm -rf  /var/lib/grafana/grafana.db
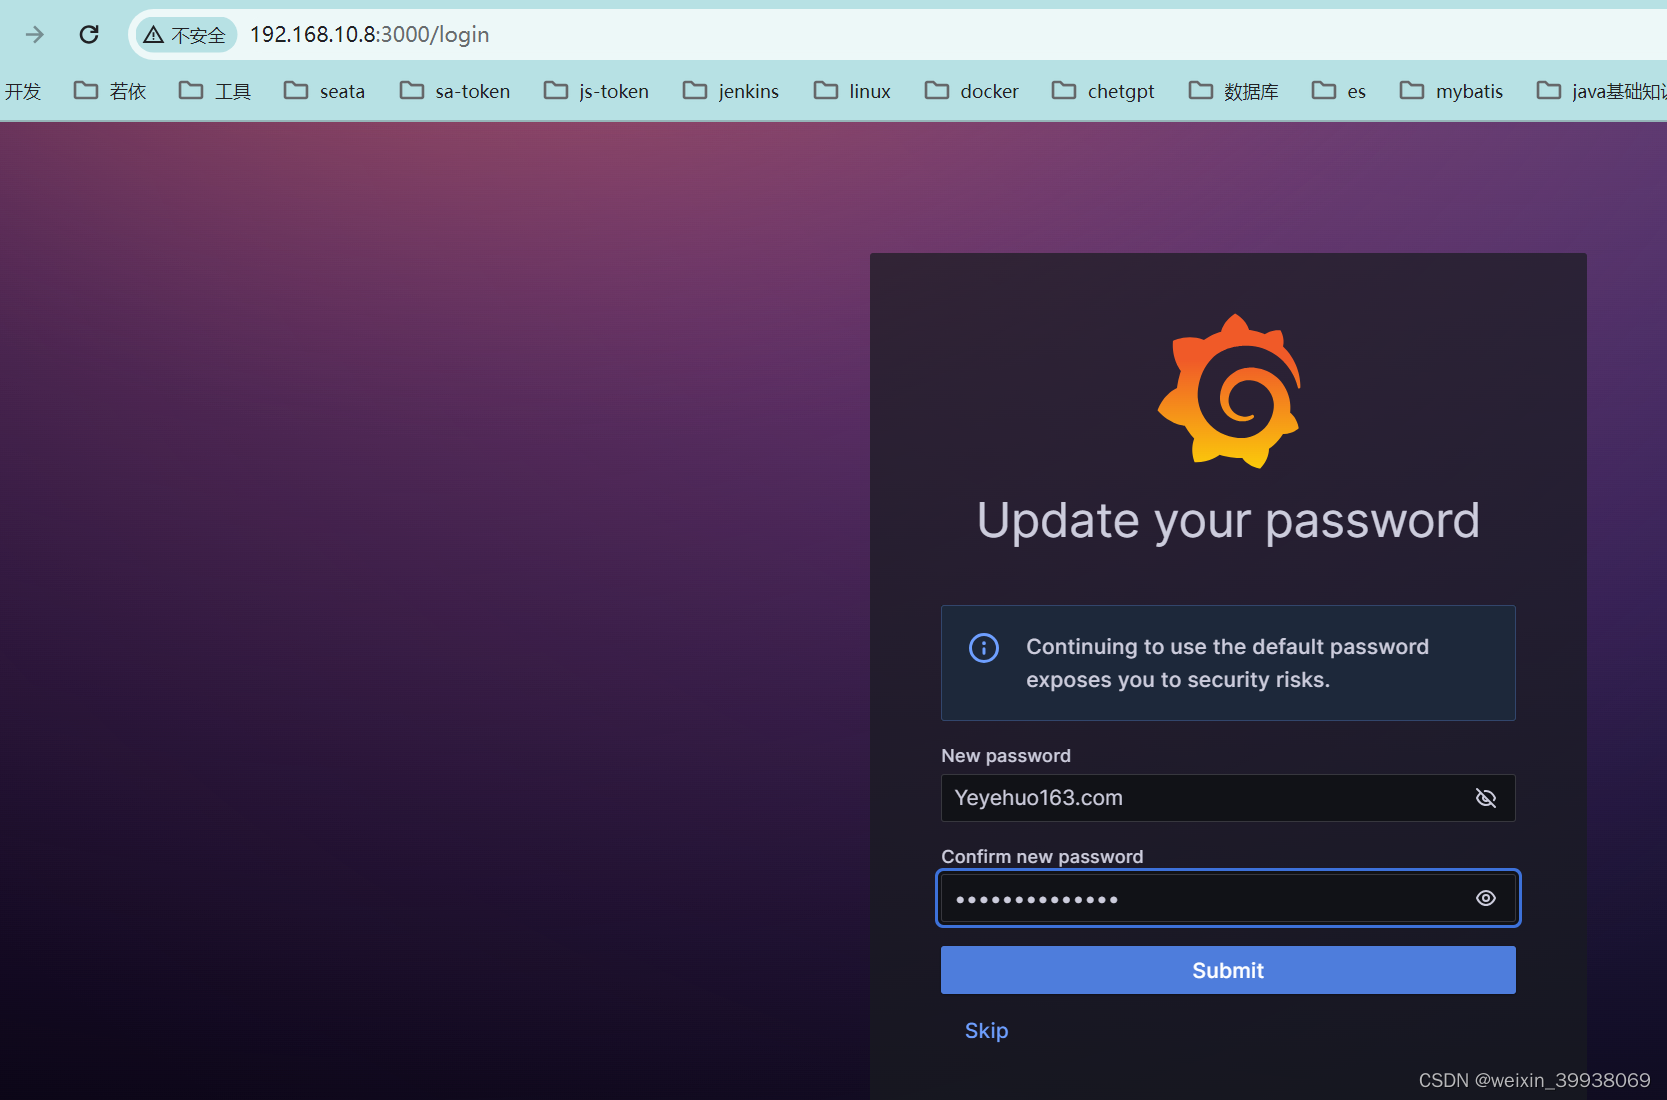
通常情况下,Grafana 服务的配置文件位于 /etc/grafana/grafana.ini,日志通常存储在 /var/log/grafana,而数据库默认位于 /var/lib/grafana/grafana.db。您可能需要查看这些文件以进行故障排查或者进行配置更改。记得在修改配置文件之后重启 Grafana 服务使更改生效。
Grafana只用于展示数据,需要配置Prometheus数据源。
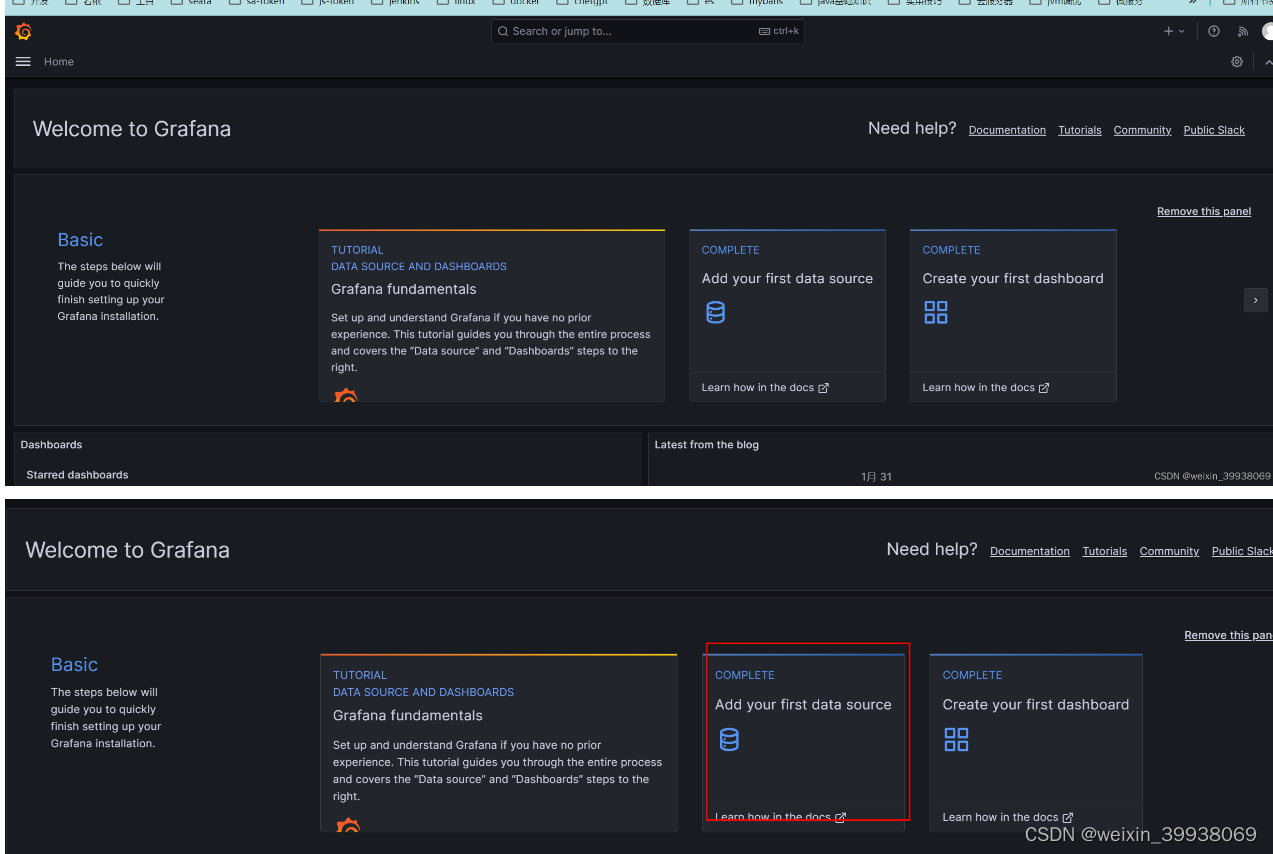
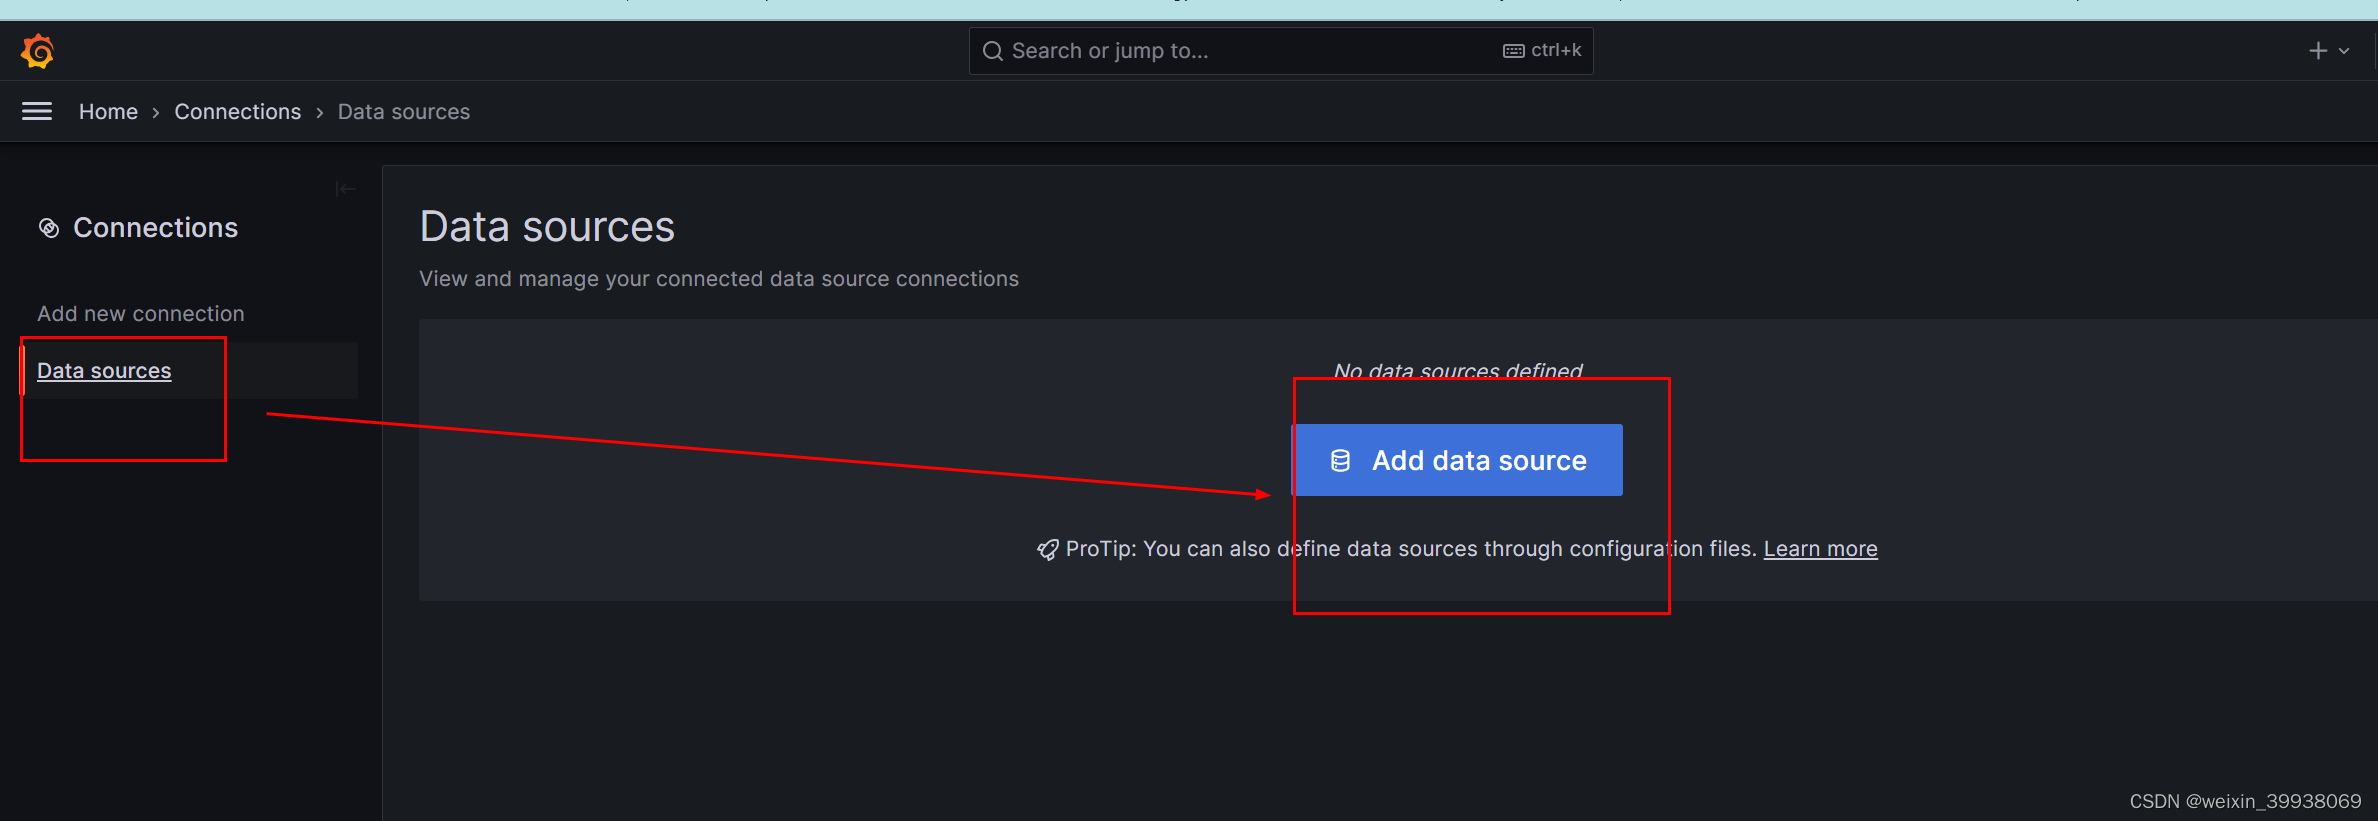
写你的prometheus的url,带上端口号9090:
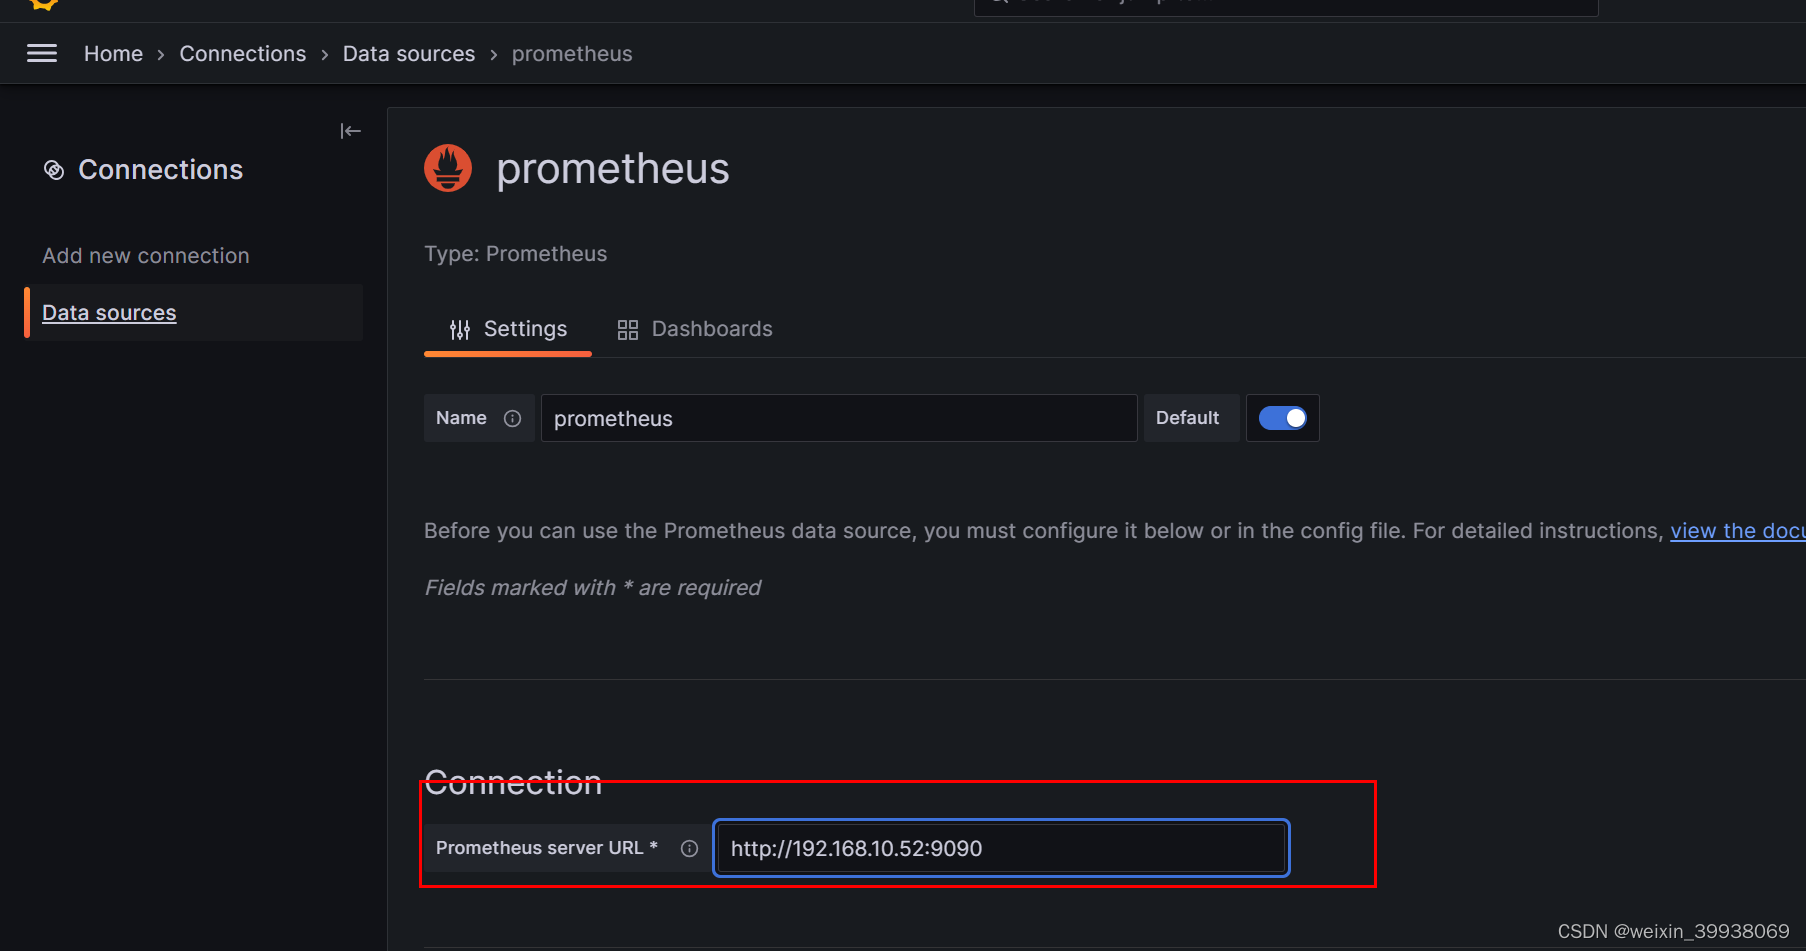
点击下方的sava&test,有下图的提示说明成功:
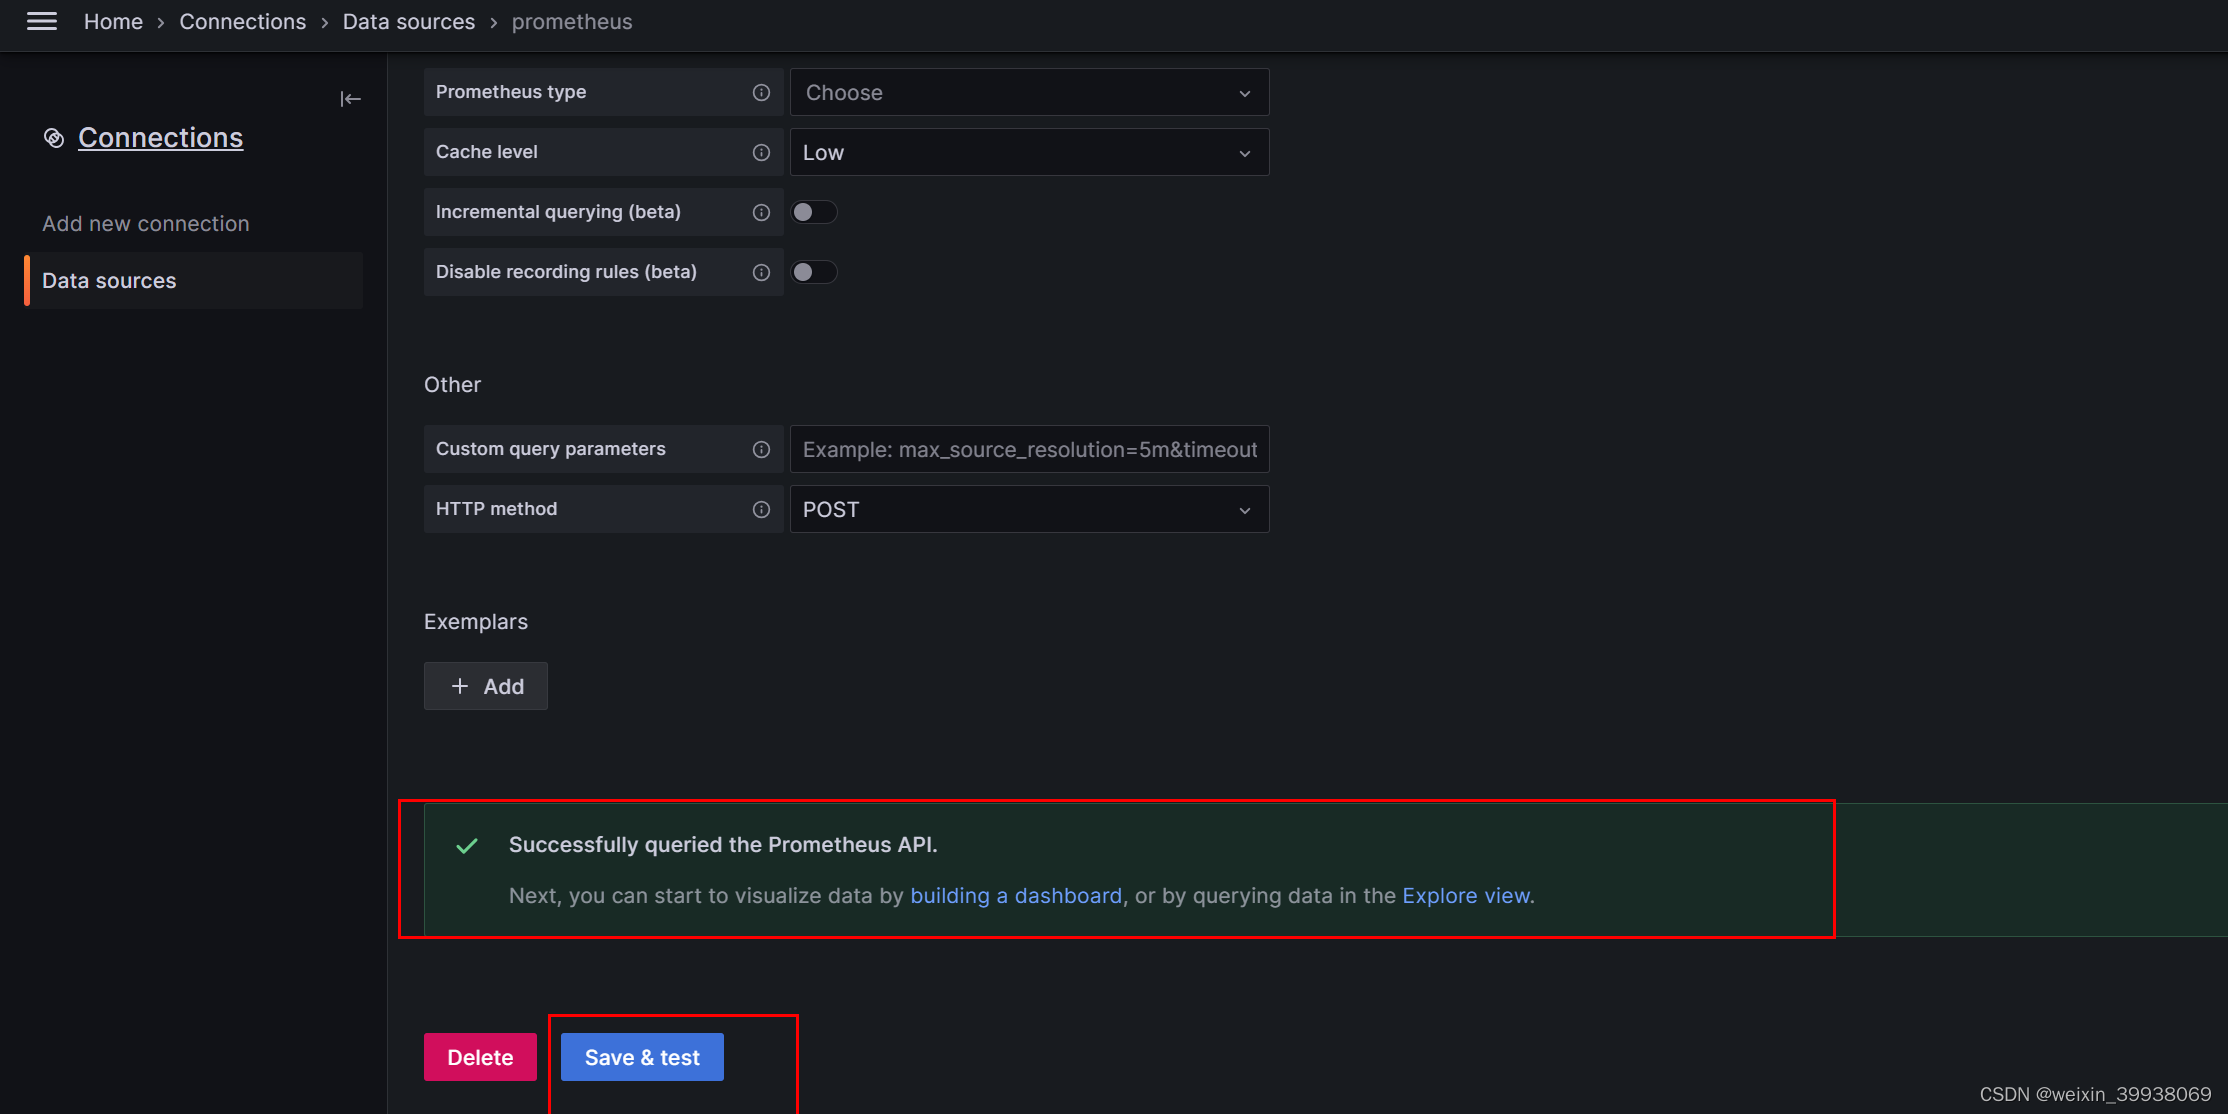
然后回到home,找到Create your first dashboard:
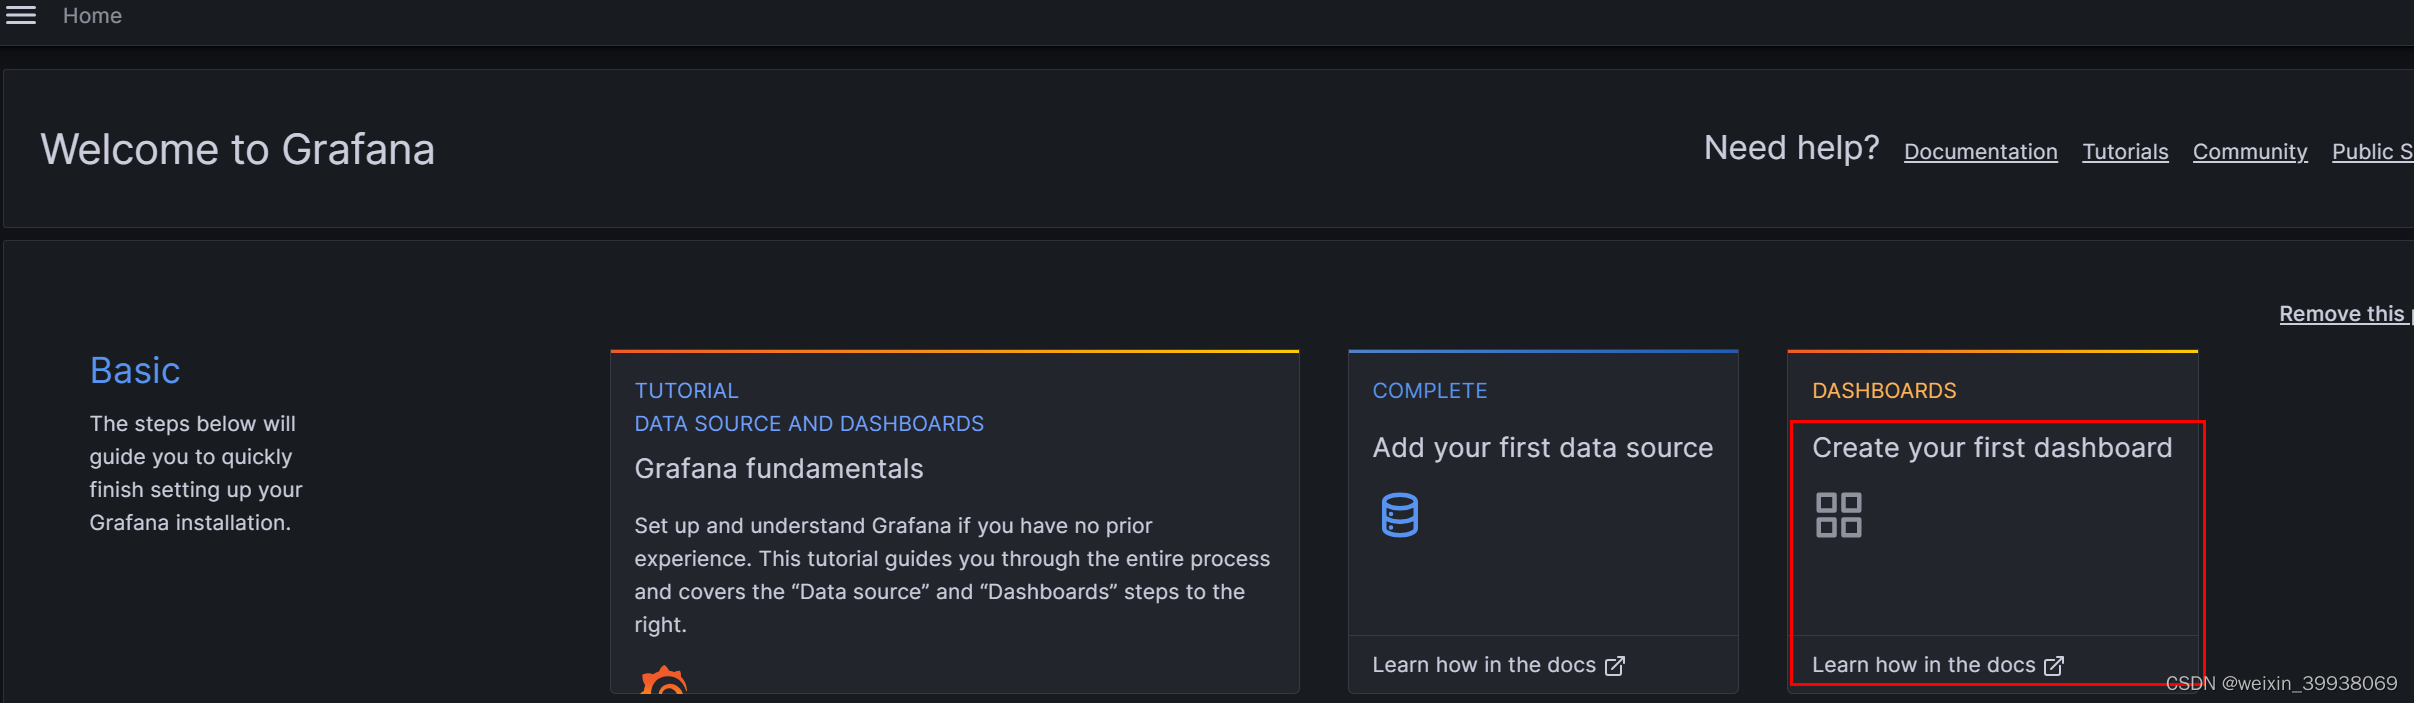
点击import a dashboard:
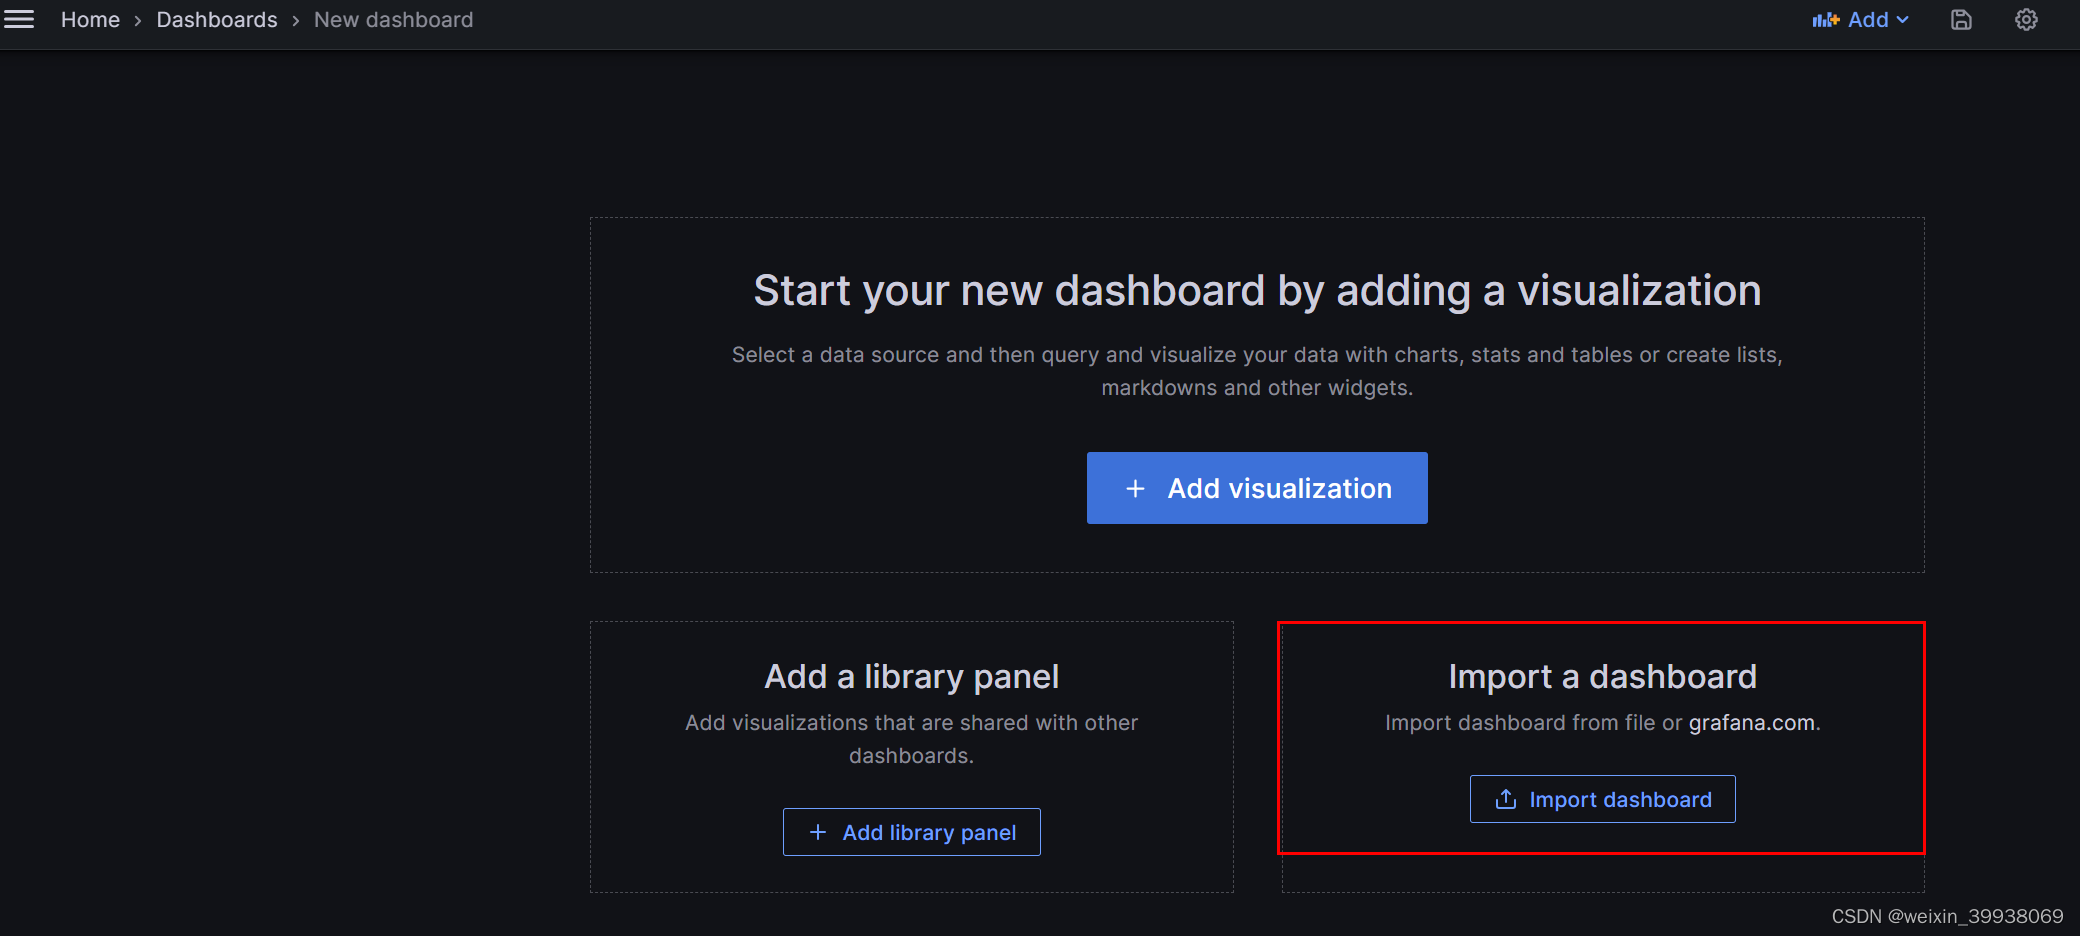
上传之前下载的json文件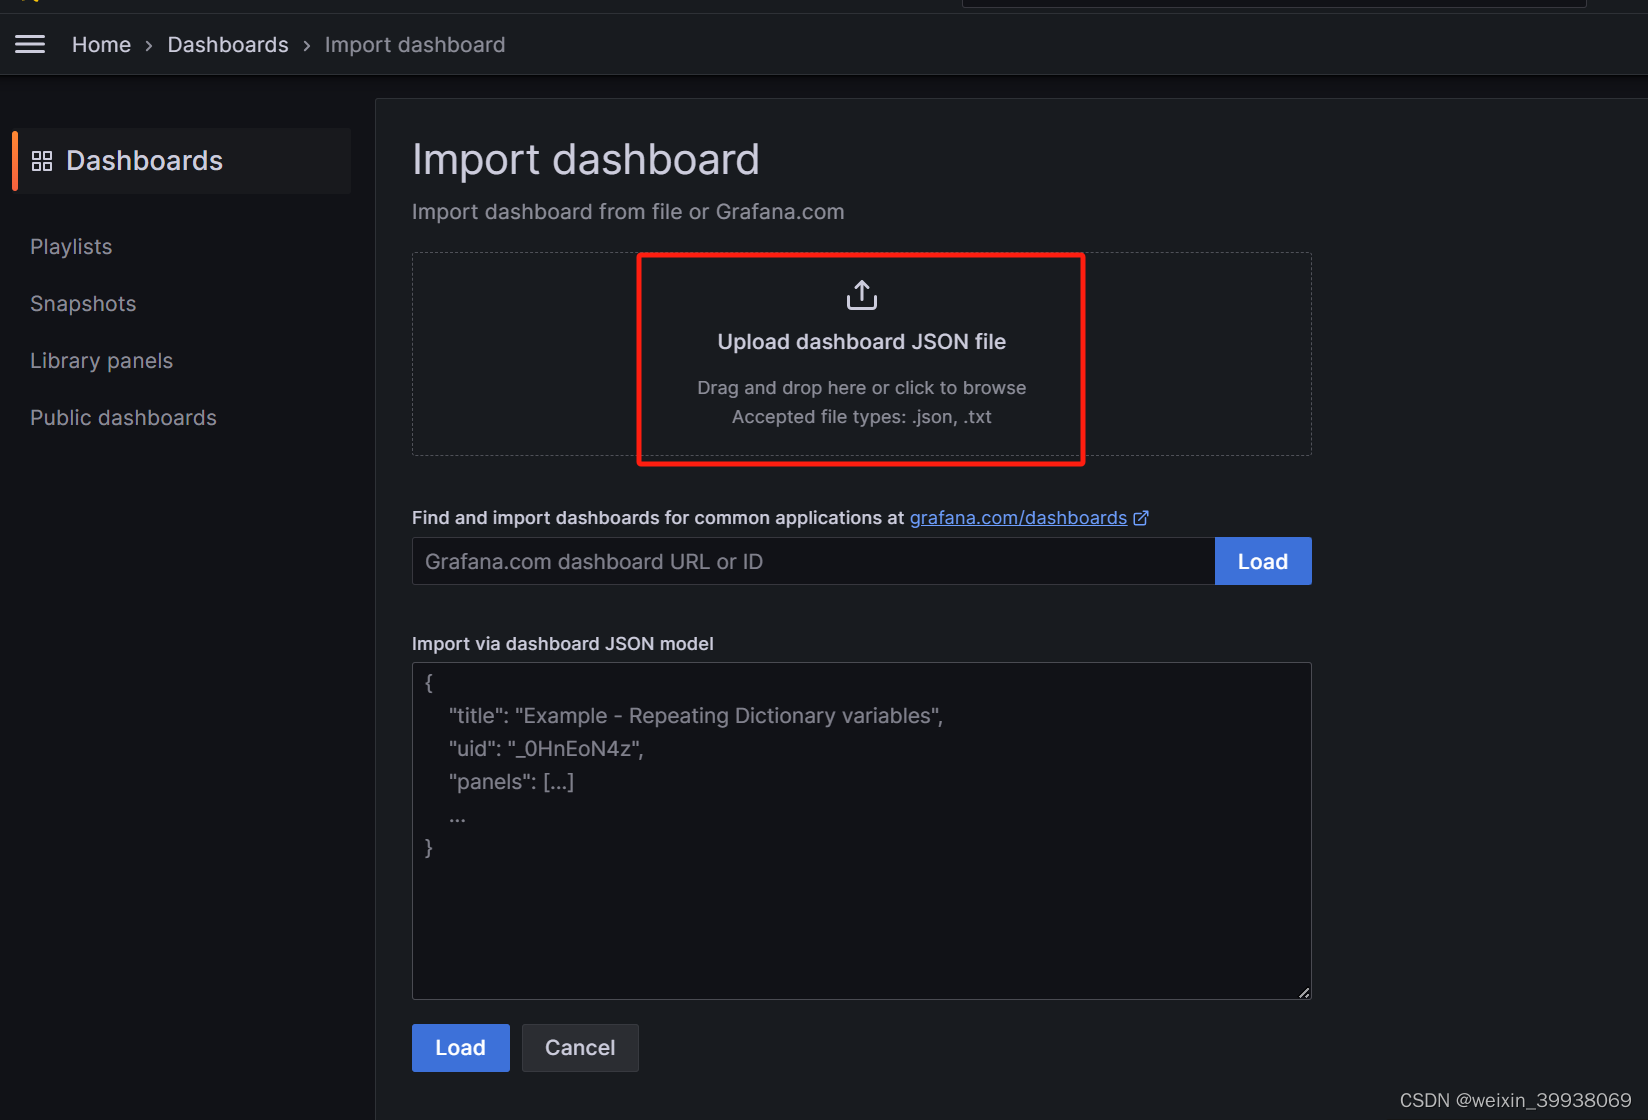
上传后选择一下prometheus:
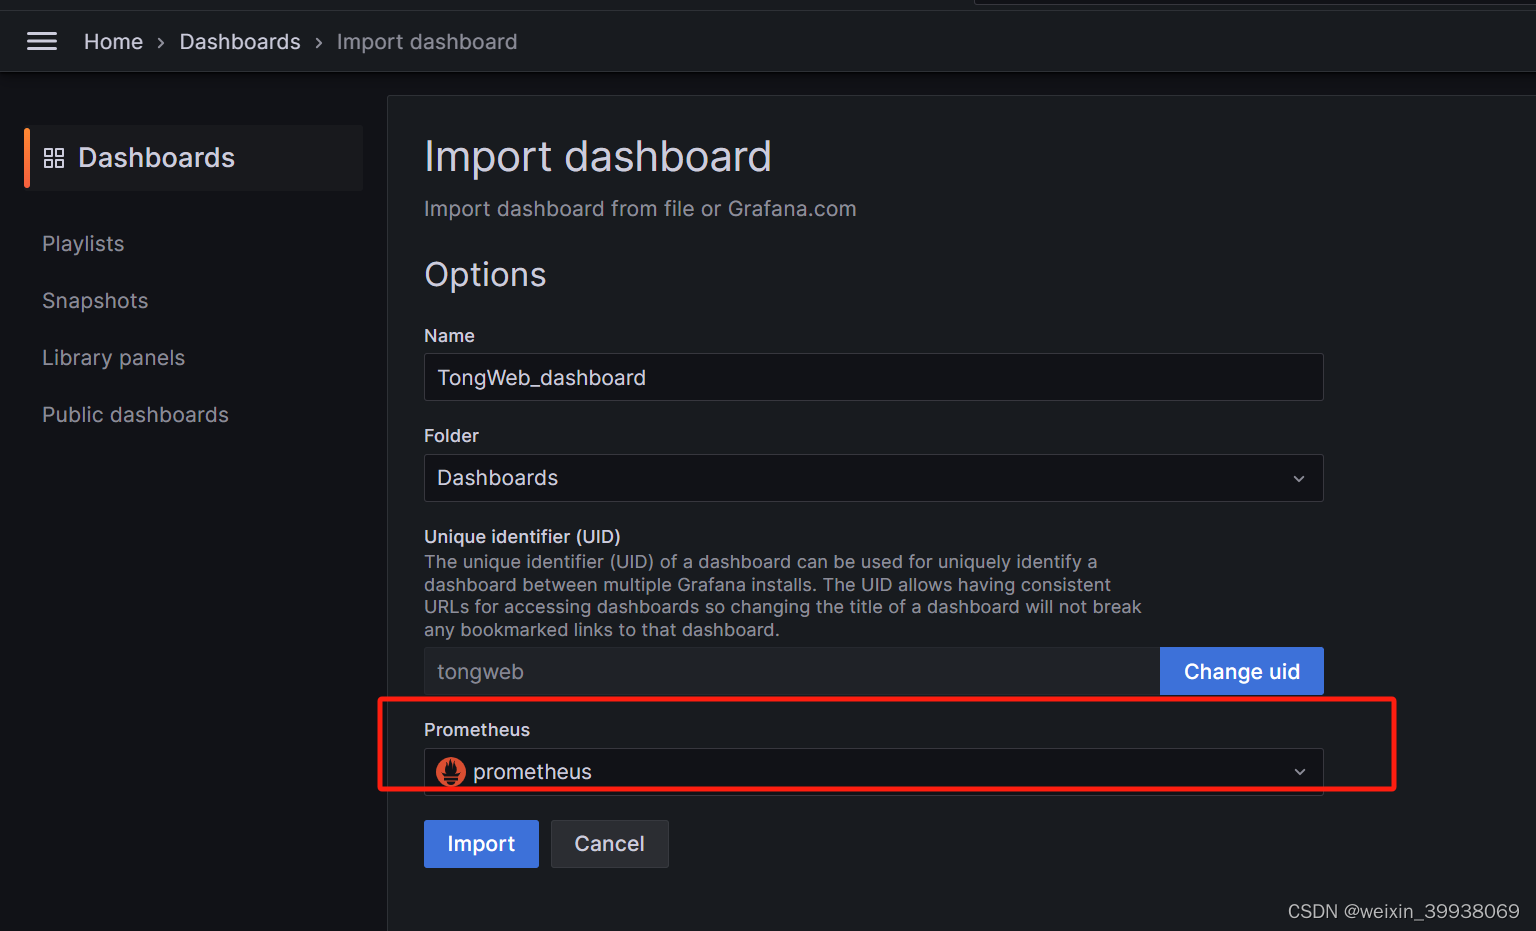
然后点击import,仪表盘就出现了: