增加其他功能
一、增加变量显示
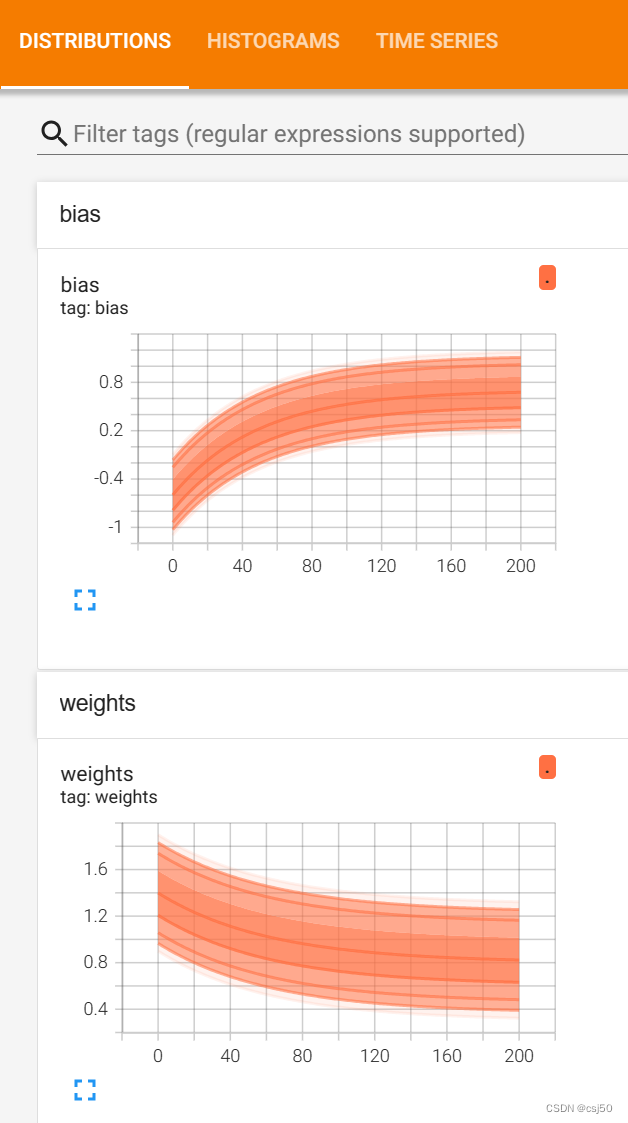
1、目的:在TensorBoard当中观察模型的参数、损失值等变量值的变化
2、收集变量
不同的变量要用不同的方式收集
(1)tf.summary.scalar(name='', tensor)
收集对于损失函数和准确率等单值变量,name为变量的名字,tensor为值
(2)tf.summary.histogram(name='', tensor)
收集高维度的变量参数
(3)tf.summary.image(name='', tensor)
收集输入的图片张量,能显示图片
3、合并变量写入事件文件
(1)merged = tf.summary.merge_all()
4、修改代码
import os
os.environ['TF_CPP_MIN_LOG_LEVEL']='2'
import tensorflow as tf

def tensorflow_demo():
    """
    TensorFlow的基本结构
    """

    # TensorFlow实现加减法运算
    a_t = tf.constant(2)
    b_t = tf.constant(3)
    c_t = a_t + b_t
    print("TensorFlow加法运算结果:\n", c_t)
    print(c_t.numpy())

    # 2.0版本不需要开启会话,已经没有会话模块了

    return None

def graph_demo():
    """
    图的演示
    """
    # TensorFlow实现加减法运算
    a_t = tf.constant(2)
    b_t = tf.constant(3)
    c_t = a_t + b_t
    print("TensorFlow加法运算结果:\n", c_t)
    print(c_t.numpy())

    # 查看默认图
    # 方法1:调用方法
    default_g = tf.compat.v1.get_default_graph()
    print("default_g:\n", default_g)

    # 方法2:查看属性
    # print("a_t的图属性:\n", a_t.graph)
    # print("c_t的图属性:\n", c_t.graph)

    # 自定义图
    new_g = tf.Graph()
    # 在自己的图中定义数据和操作
    with new_g.as_default():
        a_new = tf.constant(20)
        b_new = tf.constant(30)
        c_new = a_new + b_new
        print("c_new:\n", c_new)
        print("a_new的图属性:\n", a_new.graph)
        print("b_new的图属性:\n", b_new.graph)

    # 开启new_g的会话
    with tf.compat.v1.Session(graph=new_g) as sess:
        c_new_value = sess.run(c_new)
        print("c_new_value:\n", c_new_value)
        print("我们自己创建的图为:\n", sess.graph)

    # 可视化自定义图
    # 1)创建一个writer
    writer = tf.summary.create_file_writer("./tmp/summary")
    # 2)将图写入
    with writer.as_default():
        tf.summary.graph(new_g)

    return None

def session_run_demo():
    """
    feed操作
    """
    tf.compat.v1.disable_eager_execution()

    # 定义占位符
    a = tf.compat.v1.placeholder(tf.float32)
    b = tf.compat.v1.placeholder(tf.float32)
    sum_ab = tf.add(a, b)
    print("a:\n", a)
    print("b:\n", b)
    print("sum_ab:\n", sum_ab)
    # 开启会话
    with tf.compat.v1.Session() as sess:
        print("占位符的结果:\n", sess.run(sum_ab, feed_dict={a: 1.1, b: 2.2}))

    return None

def tensor_demo():
    """
    张量的演示
    """
    tensor1 = tf.constant(4.0)
    tensor2 = tf.constant([1, 2, 3, 4])
    linear_squares = tf.constant([[4], [9], [16], [25]], dtype=tf.int32)
    print("tensor1:\n", tensor1)
    print("tensor2:\n", tensor2)
    print("linear_squares:\n", linear_squares)

    # 张量类型的修改
    l_cast = tf.cast(linear_squares, dtype=tf.float32)
    print("before:\n", linear_squares)
    print("l_cast:\n", l_cast)

    return None

def variable_demo():
    """
    变量的演示
    """
    a = tf.Variable(initial_value=50)
    b = tf.Variable(initial_value=40)
    c = tf.add(a, b)
    print("a:\n", a)
    print("b:\n", b)
    print("c:\n", c)
    with tf.compat.v1.variable_scope("my_scope"):
        d = tf.Variable(initial_value=30)
        e = tf.Variable(initial_value=20)
        f = tf.add(d, e)
    print("d:\n", d)
    print("e:\n", e)
    print("f:\n", f)
    return None

def linear_regression():
    """
    自实现一个线性回归
    """
    # 1、准备数据
    x = tf.random.normal(shape=[100,1])
    y_true = tf.matmul(x, [[0.8]]) + 0.7

    # 2、构造模型
    # 定义模型参数,用变量
    weights = tf.Variable(initial_value=tf.random.normal(shape=[1, 1]))
    bias = tf.Variable(initial_value=tf.random.normal(shape=[1, 1]))
    y_predict = tf.matmul(x, weights) + bias

    # 3、构造损失函数
    error = tf.reduce_mean(tf.square(y_predict - y_true))

    # 4、优化器
    #optimizer = tf.train.GradientDescentOptimizer(learning_rate=0.01).minimize(error)
    optimizer = tf.keras.optimizers.SGD(learning_rate=0.01)

    # 创建事件文件
    file_writer = tf.summary.create_file_writer("./tmp/summary")

    # 收集变量
    with file_writer.as_default():
        tf.summary.experimental.set_step(0)
        # 记录标量变量
        tf.summary.scalar("error", error)
        # 记录变量的直方图
        tf.summary.histogram("weights", weights)
        tf.summary.histogram("bias", bias)

    # 5、查看初始化模型参数之后的值
    print("训练前模型参数为:权重%f,偏置%f,损失%f" % (weights, bias, error))

    # 6、开始训练
    num_epoch = 200 # 定义迭代次数

    for e in range(num_epoch): # 迭代多次
        with tf.GradientTape() as tape:
            y_predict = tf.matmul(x, weights) + bias
            error = tf.reduce_mean(tf.square(y_predict - y_true))
            #error = loss_function(y_predict, y_true)
        grads = tape.gradient(error, [weights, bias]) # 求损失关于参数weights、bias的梯度
        optimizer.apply_gradients(grads_and_vars=zip(grads, [weights, bias])) # 自动根据梯度更新参数,即利用梯度信息修改weights与bias,使得损失减小

        # 每个步骤记录变量
        with file_writer.as_default():
            tf.summary.experimental.set_step(e + 1)
            # 记录标量变量
            tf.summary.scalar("error", error)
            # 记录变量的直方图
            tf.summary.histogram("weights", weights)
            tf.summary.histogram("bias", bias)

    file_writer.close()
    print("训练后模型参数为:权重%f,偏置%f,损失%f" % (weights, bias, error))

    return None

if __name__ == "__main__":
    # 代码1:TensorFlow的基本结构
    # tensorflow_demo()
    # 代码2:图的演示
    #graph_demo()
    # feed操作
    #session_run_demo()
    # 代码4:张量的演示
    #tensor_demo()
    # 代码5:变量的演示
    #variable_demo()
    # 代码6:自实现一个线性回归
    linear_regression()
运行结果:
训练前模型参数为:权重1.398883,偏置-0.596879,损失1.965775
训练后模型参数为:权重0.823115,偏置0.676830,损失0.001003
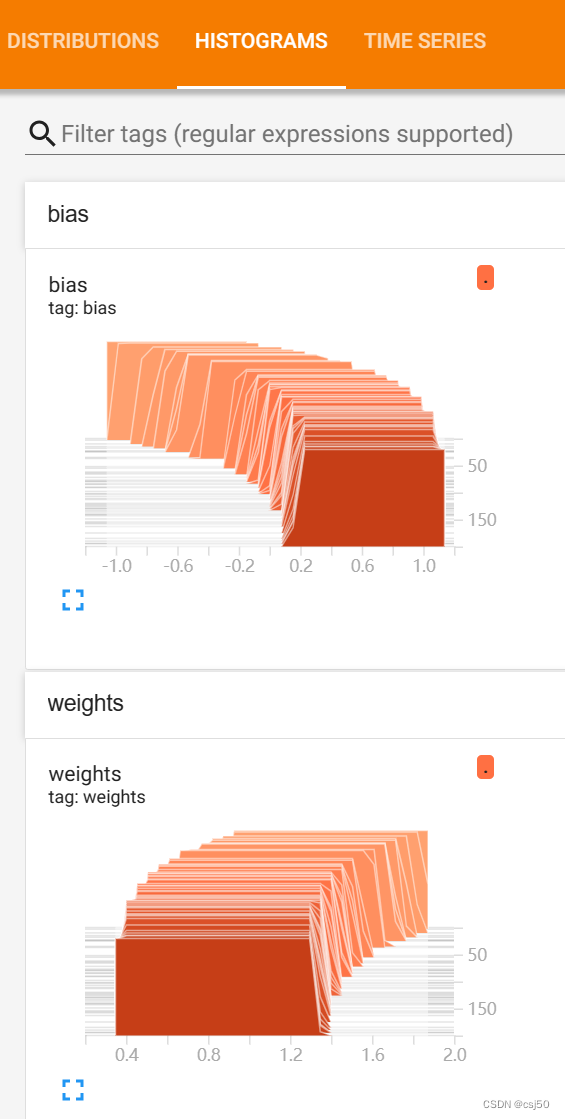
5、查看TensorBoard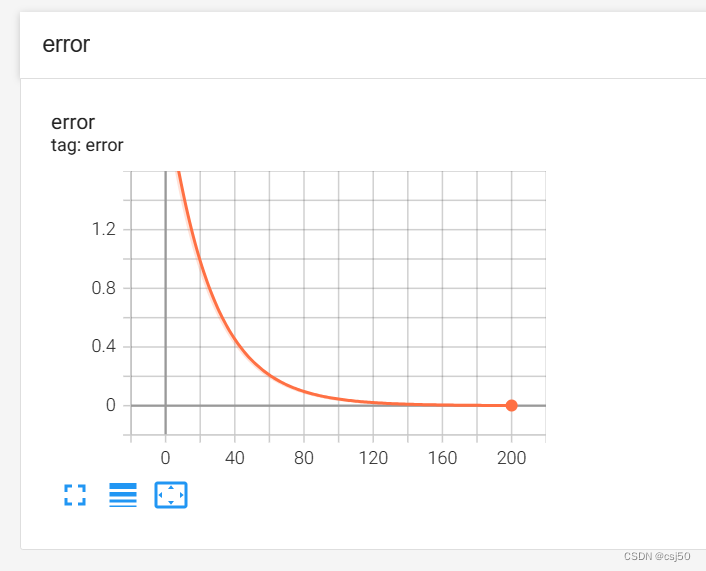
二、TensorFlow2.0如何显示静态图
1、在TensorFlow1.0时代,采用的是静态计算图,需要先使用TensorFlow的各种算子创建计算图,然后再开启一个会话Session,显式执行计算图
2、而在TensorFlow2.0时代,采用的是动态计算图,即每使用一个算子后,该算子会被动态加入到隐含的默认计算图中立即执行得到结果,而无需开启Session
3、如果需要在TensorFlow2.0中使用静态图,可以使用@tf.function装饰器将普通Python函数转换成对应的TensorFlow计算图构建代码。运行该函数就相当于在TensorFlow1.0中用Session执行代码。使用tf.function构建静态图的方式叫做Autograph
4、计算图简介
计算图由节点(nodes)和线(edges)组成
节点表示操作符Operator,或者称之为算子,线表示计算间的依赖
实线表示有数据传递依赖,传递的数据即张量
虚线通常可以表示控制依赖,即执行先后顺序
5、因为代码里用到了变量,没法用tf.function把静态图弄出来

