本笔记记录Himmelblau函数优化案例代码,包括函数的图形绘制和梯度下降求解局部最优解的过程。
import tensorflow as tf
import numpy as np
from mpl_toolkits.mplot3d import Axes3D
from matplotlib import pyplot as plt
tf.__version__

#Himmelblau函数
#https://zhuanlan.zhihu.com/p/682566976
#最小值(0)位置(x,y)有四个:(3.0, 2.0),(-2.805118, 3.131312),(-3.779310,-3.283186),(3.584428,-1.848126)
def himmelblau(xy):
    return (xy[0]**2 + xy[1] - 11)**2 + (xy[0] + xy[1]**2 - 7)**2
#首先通过meshgrid绘制H函数的图像
x = np.arange(-6, 6, 0.1)
y = np.arange(-6, 6, 0.1)
X,Y = np.meshgrid(x, y)
Z = himmelblau([X,Y])

fig = plt.figure("Himmelblau Figure")
axes = fig.add_axes(Axes3D(fig))
axes.plot_surface(X, Y, Z)
axes.view_init(30, -30)
axes.set_xlabel("X")
axes.set_ylabel("Y")
plt.show()

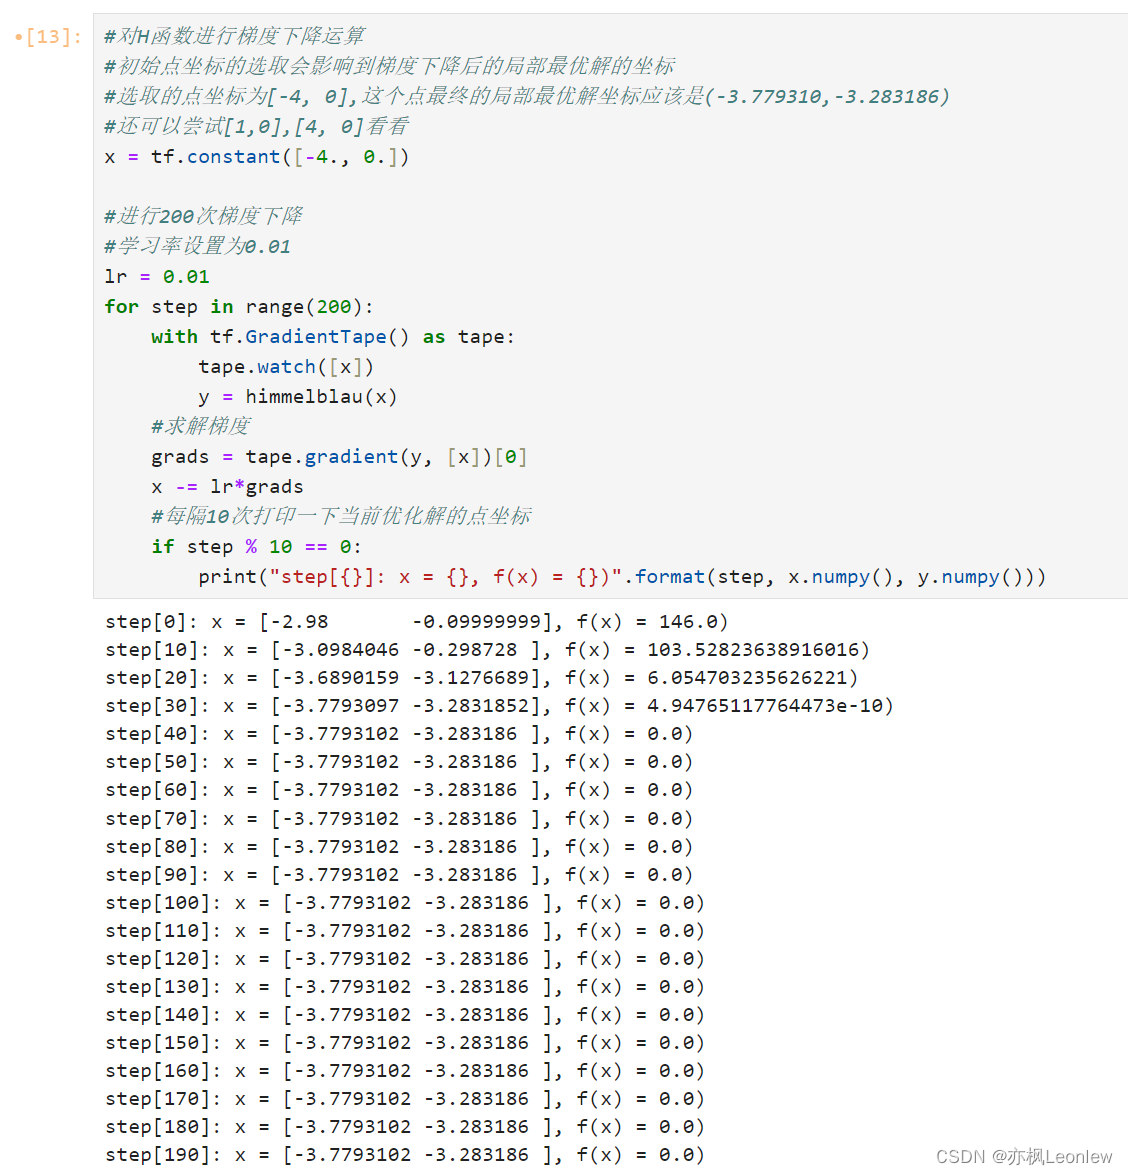
#对H函数进行梯度下降运算
#初始点坐标的选取会影响到梯度下降后的局部最优解的坐标
#选取的点坐标为[-4, 0],这个点最终的局部最优解坐标应该是(-3.779310,-3.283186)
#还可以尝试[1,0],[4, 0]看看
x = tf.constant([-4., 0.])

#进行200次梯度下降
#学习率设置为0.01
lr = 0.01
for step in range(200):
    with tf.GradientTape() as tape:
        tape.watch([x])
        y = himmelblau(x)
    #求解梯度
    grads = tape.gradient(y, [x])[0]
    x -= lr*grads
    #每隔10次打印一下当前优化解的点坐标
    if step % 10 == 0:
        print("step[{}]: x = {}, f(x) = {})".format(step, x.numpy(), y.numpy()))
运行结果:



![2078: [蓝桥杯2023初赛] 01 串的熵](https://img-blog.csdnimg.cn/img_convert/d5473d1330c7732a8a60e8e1897c7de4.png)
