< template>
< div>
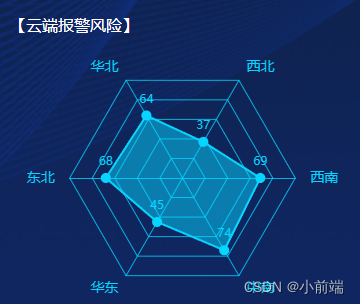
< div> 【云端报警风险】< / div>
< div ref= "target" class = "w-full h-full" style= 'width:200px;height:300px' > < / div>
< / div>
< / template>
< script setup>
import { ref, onMounted, watch } from 'vue' ;
import * as echarts from "echarts" ;
let myChart = null ;
const target = ref ( null ) ;
onMounted ( ( ) => {
myChart = echarts. init ( target. value) ;
renderChart ( ) ;
} ) ;
let resData= [
{
"id" : 1 ,
"name" : "华北" ,
"value" : 64
} ,
{
"id" : 2 ,
"name" : "东北" ,
"value" : 68
} ,
{
"id" : 3 ,
"name" : "华东" ,
"value" : 45
} ,
{
"id" : 4 ,
"name" : "中南" ,
"value" : 74
} ,
{
"id" : 5 ,
"name" : "西南" ,
"value" : 69
} ,
{
"id" : 6 ,
"name" : "西北" ,
"value" : 37
}
]
const renderChart = ( ) => {
const options = {
radar : {
name : {
textStyle : {
color : "#05D5FF" ,
fontSize : 14
}
} ,
shape : 'polygon' ,
center : [ '50%' , '50%' ] ,
radius : '80%' ,
startAngle : 120 ,
axisLine : {
lineStyle : {
color : 'rgba(2,213,255,.8)'
}
} ,
splitLine : {
show : true ,
lineStyle : {
with : 1 ,
color : 'rgba(5,213,255,.8)'
}
} ,
indicator : resData. map ( item => ( {
name : item. name,
max : 100
} ) ) ,
splitArea : {
show : false
}
} ,
polar : {
center : [ '50%' , '50%' ] ,
radius : '0%'
} ,
angleAxis : {
min : 0 ,
interval : 5 ,
clockwise : false ,
} ,
radiusAxis : {
min : 0 ,
interval : 20 ,
splitLine : {
show : true
}
} ,
series : {
type : 'radar' ,
symbol : 'circle' ,
symbolSize : 10 ,
itemStyle : {
normal : {
color : '#05D5FF'
}
} ,
areaStyle : {
normal : {
color : '#05D5FF' ,
opacity : 0.5
}
} ,
lineStyle : {
with : 2 ,
color : '#05D5FF'
} ,
label : {
normal : {
show : true ,
color : '#05D5FF' ,
}
} ,
data : [
{
value : resData. map ( item => item. value)
}
]
}
}
myChart. setOption ( options) ;
} ;
watch ( ( ) => resData, renderChart)
< / script>
< style lang= "scss" scoped>
< / style>