上一次介绍了Python绘制svg的优秀可视化库Pygal,今天我们介绍一下一个优秀的R地图可视化绘制包-linemap包,顾名思义,该包是是为了绘制由线组成的地图,其官网如下:https://github.com/rCarto/linemap。该包主要拥有两个绘图函数:linemap()和 getgrid(),其中:linemap()使用网格数据的数据框显示由线组成的地图。getgrid()将一组多边形(sf对象)转换为绘制linemap()的合适数据框(data.frame)。
更多详细的数据可视化教程,可阅读我们的课程店铺:

R-linemap 样例介绍
这里我们介绍下官网提供的例子,样例1的绘图代码如下:
library(sf)
library(linemap)
data("popOcc")
data("occitanie")
opar <- par(mar=c(0,0,0,0), bg = "ivory2")
plot(st_geometry(occitanie), col="ivory1", border = NA)
linemap(x = popOcc, var = "pop", k = 2.5, threshold = 50,
        col = "ivory1", border = "ivory4", lwd = 0.6, add = TRUE)

mtext(text = "Population\nen Occitanie", side = 3, line = -4,
      col = "black", font = 4, adj = 0.05, cex = 2)
mtext(text = "Données carroyées à 1 kilomètre, INSEE 2010", side=1,
      line = - 1, col = "black", font = 3, adj = 0.98, cex = 1)
par(opar)
可视化结果如下:
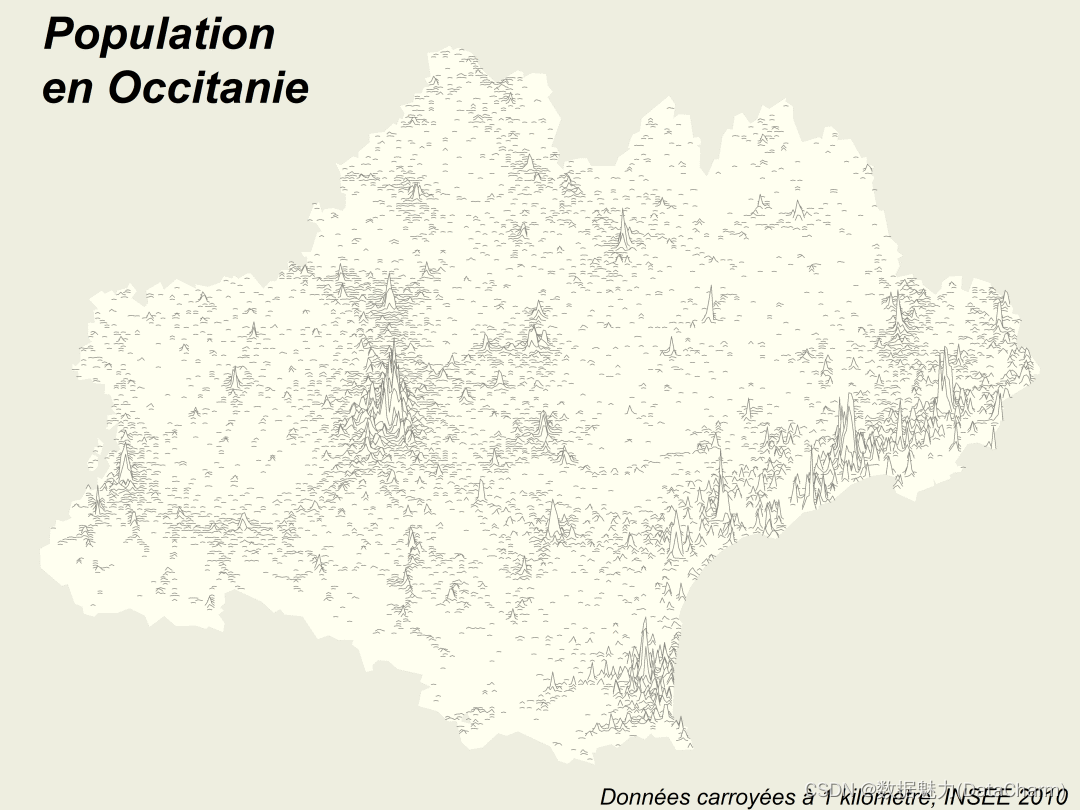
linemap() charts
这里我们看一下具体用于绘制的数据类型,首先地图数据occitanie,其结果如下:
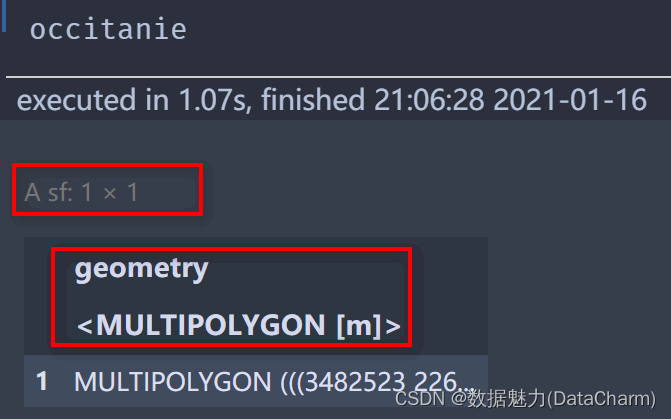
地图数据occitanie
可以看出其为sf地图文件类型。popOcc的数据类型则如下:

数据popOcc
很明显,其为 data.frame 数据类型,而当我们没有用于绘制图表的合适数据时,我们可以使用linemap的另一个函数getgrid()将其转换即可,介绍如下:
-
导入数据
library(linemap)
library(sf)
data("bretagne")
data("france")

opar <- par(mar=c(0,0,0,0), bg = "ivory2")
plot(st_geometry(bretagne))
快速绘制的可视化结果如下:
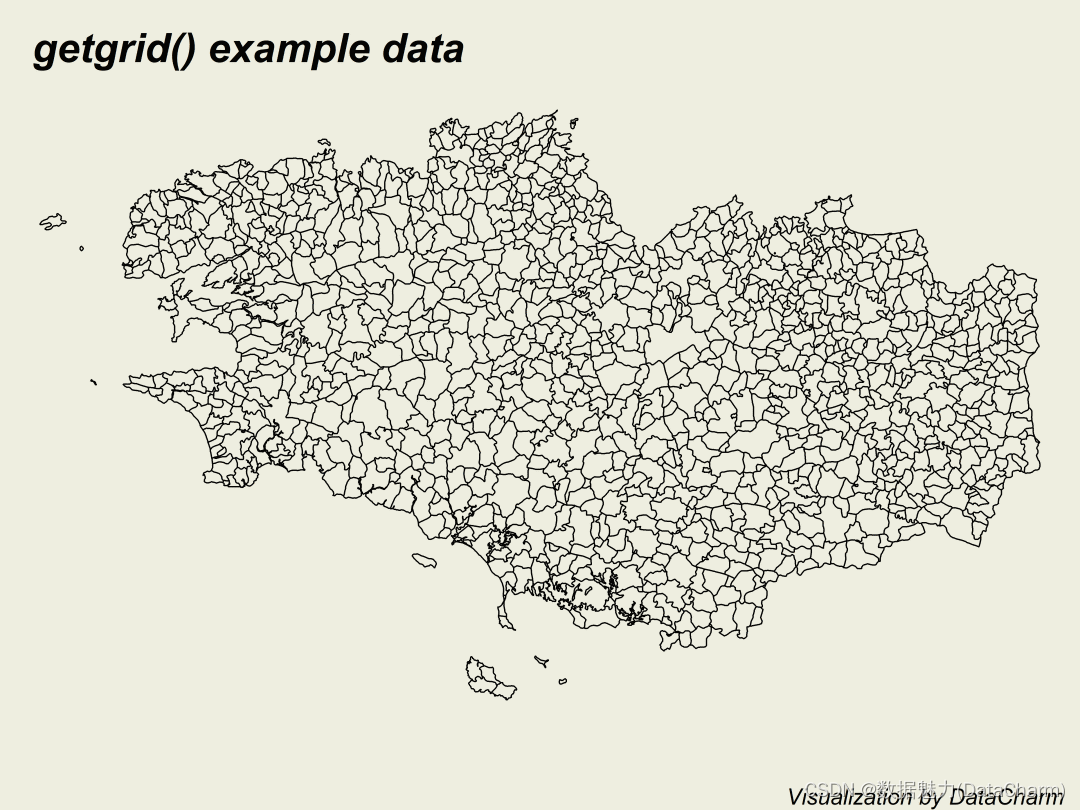
getgrid() data
接下来,我们使用 getgrid()从sf数据对象中获取需要的数据,这里获取“POPULATION”属性,bretagne地图数据 bret如下:

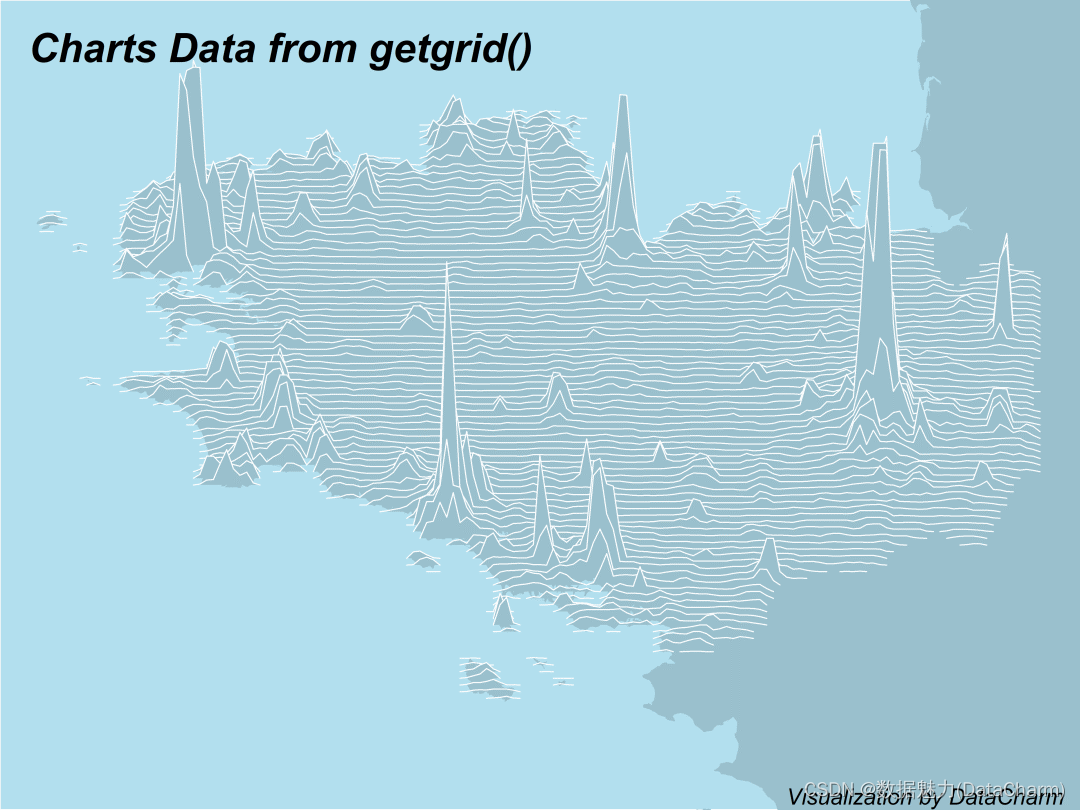
记过上述的转换后,绘制linemap的数据:地图数据(france)和线数据(bret),我们再使用linemap()绘制即可,代码如下:
opar <- par(mar = c(0,0,0,0))
plot(st_geometry(france), col="lightblue3", border = NA, bg = "lightblue2",
     xlim = c(min(bret$X), max(bret$X)), ylim= c(min(bret$Y), max(bret$Y)))
linemap(x = bret, var = "POPULATION", k = 5, threshold = 1,
        col = "lightblue3", border = "white", lwd = 0.8,
        add = TRUE)
#添加文字属性
mtext(text = "Charts Data from getgrid()", side = 3, line = -2.5,
      col = "black", font = 4, adj = 0.05, cex = 1.8)
mtext(text = "Visualization by DataCharm", side=1,
      line = - 1, col = "black", font = 3, adj = 0.98, cex = 1)
par(opar)
可视化结果如下:
linemap()函数属性介绍
我们使用help(linemap)就可以获取该函数的介绍及用法,如下:
help(linemap)

Arguments:(设置参数)
x :a data.frame, two first column must be longitudes and latitudes of gridded data.
(data.frame 数据类型,且前两列必须为经度和纬度)
var : name of the variable to plot.
     (要绘制的变量名称)

k : expension factor.
    (膨胀系数)
threshold : threshold of the data to plot.

col :color for the lines areas.
    (线区域的颜色)
border:color for the lines borders.
    (线边界的颜色)

lwd :thickness of the lines.
    (线的宽度)
add :if TRUE add the lines to the current plot.
    如果为TRUE,则将线添加到当前图层。
总结
本期我们介绍一个用于绘制线地图的R可视化包,需要注意的是,这里保存图片都是基础R的方法,没有使用我们熟悉额ggsave()保存,主要代码如下:
pdf("linemap_01.pdf")
# 保存高分辨率的png
png(filename = linemap_02.png,units="in",width = 8,height = 6,res = 600)
#这里注意下,units = "in",保存图片时即可达到和ggsave#()相同的效果。
opar <- par(mar=c(0,0,0,0), bg = "ivory2")
# 设置图片四周留白和背景颜色
# 开始绘图·····
par(opar)
dev.off()
在使用特定包绘制不同图表时,大家也可以尝试下使用R基本函数保存图片哦~~












![BUUCTF------[HCTF 2018]WarmUp](https://img-blog.csdnimg.cn/direct/91f9012498db4f7e977d01db2e669644.png)
