糖尿病数据线性回归预测
import numpy as np
import pandas as pd
import matplotlib.pyplot as plt
from sklearn.datasets import load_diabetes
diabetes=load_diabetes()
data=diabetes['data']
target=diabetes['target']
feature_names=diabetes['feature_names']
data.shape
df = pd.DataFrame(data, columns=feature_names)
df.head()
# 抽取训练数据和预测数据
from sklearn.model_selection import train_test_split
x_train,x_test,y_train,y_test=train_test_split(data,target,test_size=0.2)
x_train.shape,x_test.shape
# 创建模型
from sklearn.linear_model import LinearRegression
linear=LinearRegression()
linear.fit(x_train,y_train)
# 预测
y_pred=linear.predict(x_test)
y_pred
# 得分: 回归的得分很低
#linear.score(x_test,y_test)
### 线性回归评估指标
#- mean_squared_error 均方误差
from sklearn.metrics import mean_squared_error as mse
# 均方误差
mse(y_test,y_pred)
#### 求线性方程: y = WX + b 中的W系数和截距b
# w系数
linear.coef_
# 10个特征 就有10个系数
# b截距
linear.intercept_
#### 研究每个特征和标记结果之间的关系.来分析哪些特征对结果影响较大
plt.figure(figsize=(5*4, 2*4))

for i, col in enumerate(df.columns):

    # 每一列数据
    data2 = df[col].copy()

    # 画子图
    ax = plt.subplot(2, 5, i+1)
    ax.scatter(data2, target)

    # 线性回归:对每一个特征进行回归分析
    linear2 = LinearRegression()
    linear2.fit(df[[col]], target)

    # 每个特征的系数w和截距b
    # y = wx + b
    w = linear2.coef_[0]
    b = linear2.intercept_
    # print(w, b)

    # 画直线
    x = np.linspace(data2.min(), data2.max(), 2)
    y = w * x + b
    ax.plot(x, y, c='r')

    # 特征
    score = linear2.score(df[[col]], target)  # 模型得分
    ax.set_title(f'{col}: {round(score, 3)}', fontsize=16)
import numpy as np
import pandas as pd
import matplotlib.pyplot as plt
### 抛物线函数
# 抛物线函数
# f(x) = (x - 2)²  + 5

# Python函数
f=lambda x:(x-2)**2+5
# 画图
x=np.linspace(-2,6,100)
y=f(x)
plt.plot(x,y)
#### 使用梯度下降算法 求 当x为多少时,函数f(x)的值最小
# ①对目标函数求导;
# ②循环对参数更新;
# ①对目标函数求导;

# 抛物线函数
# f(x) = (x - 2)²  + 5

# 求导数
#  dx = 2x - 4
d = lambda x: 2 * x - 4
# ②循环对参数更新;
θ = 6
# 学习率 lr  : learning_rate
lr=0.03
# 最大迭代次数
max_iter=100
θ_list = [θ]
# 循环
for i in range(max_iter):
    θ = θ - lr * d(θ)
    θ_list.append(θ)
θ_array = np.array(θ_list)
# 画图
x=np.linspace(-2,6,100)
y=f(x)
plt.figure(figsize=(4,5))
plt.plot(x,y)
plt.plot(θ_array,f(θ_array), marker='*')
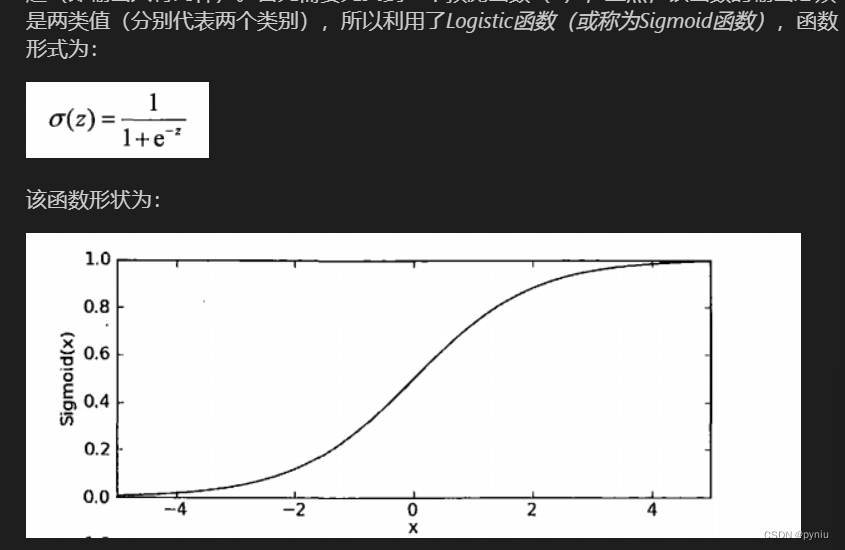
Logistic Regression虽然名字里带“回归”,但是它实际上是一种分类方法,用于两分类问题(即输出只有两种)。首先需要先找到一个预测函数(h),显然,该函数的输出必须是两类值(分别代表两个类别),所以利用了*Logistic函数(或称为Sigmoid函数)*
#1实战手写数字识别
import numpy as np
import pandas as pd
import matplotlib.pyplot as plt
# 逻辑回归: 分类
from sklearn.linear_model import LogisticRegression
# 使用KNN与Logistic回归两种方法
from sklearn.datasets import load_digits
digits=load_digits()
digits
data=digits['data']
target=digits['target']
feature_names=digits['feature_names']
target_names=digits['target_names']
imges=digits['images']
data.shape
imges.shape
pd.Series(target).unique()
feature_names
#划分数据集
from sklearn.model_selection import train_test_split
x_train, x_test, y_train, y_test = train_test_split(data, target, test_size=0.2)
#使用逻辑回归
#创建模型,训练和预测
# C=1.0 :  越大表示越严格,对训练数据拟合更好,可能导致过拟合
#          越小表示不严格,对训练数据拟合不好,可能导致欠拟合
#
# solver : 逻辑回归的损失函数的一种进行优化的算法
#      {'lbfgs', 'liblinear', 'newton-cg', 'newton-cholesky', 'sag', 'saga'},
#    solver='lbfgs' 默认值
#    liblinear:一般适用于小数据集
#    sag,saga: 一般使用于大数据集,速度更快
#    其他是中等数据集
#
#  max_iter=100: 最大迭代次数
#
#  n_jobs=-1  表示使用的CPU核数,多进程处理,一般设置为CPU核数,-1表示时使用所有处理器
lr=LogisticRegression(C=1.0,solver='lbfgs',max_iter=100,n_jobs=-1)
#训练
%timeit lr.fit(x_train,y_train)
# 预测
%timeit lr.predict(x_test)
# 得分
lr.score(x_train,y_train)
lr.score(x_test,y_test)
# 导包使用datasets.make_blobs创建一系列点
#from sklearn.datasets import make_blobs
import numpy as np
import pandas as pd
import matplotlib.pyplot as plt
from sklearn.linear_model import LogisticRegression
from sklearn.datasets import make_blobs
# n_samples=100,  样本数,行数
# n_features=2,   特征数,列数
# centers=None,  几堆点,默认是3
# cluster_std=1.0,  离散程度
data,target=make_blobs(n_samples=300,centers=4,cluster_std=1.0)
plt.scatter(data[:,0],data[:,1],c=target)
#设置三个中心点,随机创建100个点
#创建机器学习模型(逻辑斯蒂回归),训练数据
lr=LogisticRegression(max_iter=10000)
lr.fit(data,target)
lr.score(data,target)
#分类后,并绘制边界图
x=np.array([1,2,3,4])
y=np.array([5,6,7,8,9])
X, Y = np.meshgrid(x, y)
# 让X,Y相交
XY=np.c_[X.reshape(-1),Y.reshape(-1)]
#  分别对x轴和y轴的数据等分成1000份
#  分别对x轴和y轴的数据等分成1000份
x = np.linspace(data[:, 0].min(), data[:, 0].max(), 1000)
y = np.linspace(data[:, 1].min(), data[:, 1].max(), 1000)

X, Y = np.meshgrid(x, y)

# ravel(): 扁平化
XY = np.c_[X.ravel(), Y.ravel()]
XY.shape
# 提供测试数据: XY
y_pred=lr.predict(XY)
y_pred.shape
# 画边界图
plt.pcolormesh(X,Y,y_pred.reshape(1000,1000))
plt.scatter(data[:,0],data[:,1],c=target,cmap='rainbow')
