一、Ceph内置模块
Ceph manager 内部的模块中包含了 prometheus 的监控模块,并监听在每个 manager 节点的 9283 端口,该端口用于将采集到的信息通过 http 接口向 prometheus 提供数据。
二、监控搭建
1、启用 prometheus 监控模块
ceph mgr module enable prometheus
2、验证模块开启
ceph mgr module ls |less

{
    "always_on_modules": [
        "balancer",
        "crash",
        "devicehealth",
        "orchestrator",
        "pg_autoscaler",
        "progress",
        "rbd_support",
        "status",
        "telemetry",
        "volumes"
    ],
    "enabled_modules": [
        "dashboard",
        "iostat",
        "nfs",
        "prometheus",
        "restful"
    ],
    "disabled_modules": [
        {
            "name": "alerts",
            "can_run": true,
            "error_string": "",
            "module_options": {
                "interval": {
                    "name": "interval",
                    "type": "secs",
3、验证 mgr 节点端口监听
root@ceph-mgr1:~# ss -lntup | grep 9283
tcp   LISTEN  0       5                          *:9283                 *:*      users:(("ceph-mgr",pid=1247,fd=36))
4、查询prometheus指标节点信息
ceph mgr services
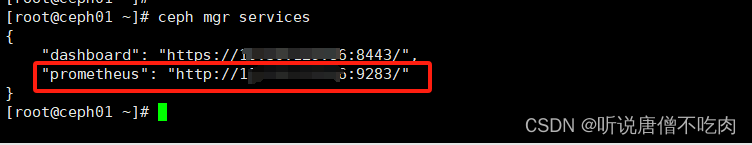
查询出prometheus对应的metrics地址信息
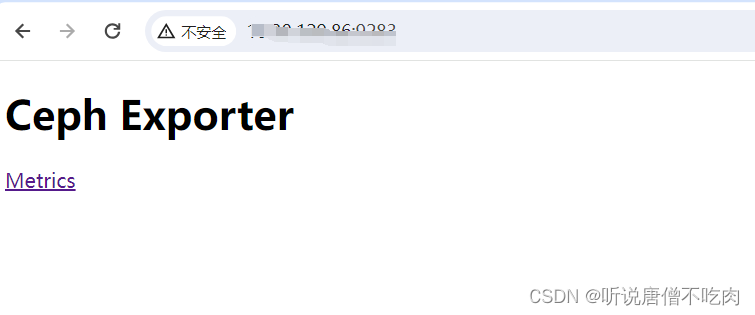
5、浏览器访问mgr指标
输入 http://IP:9283

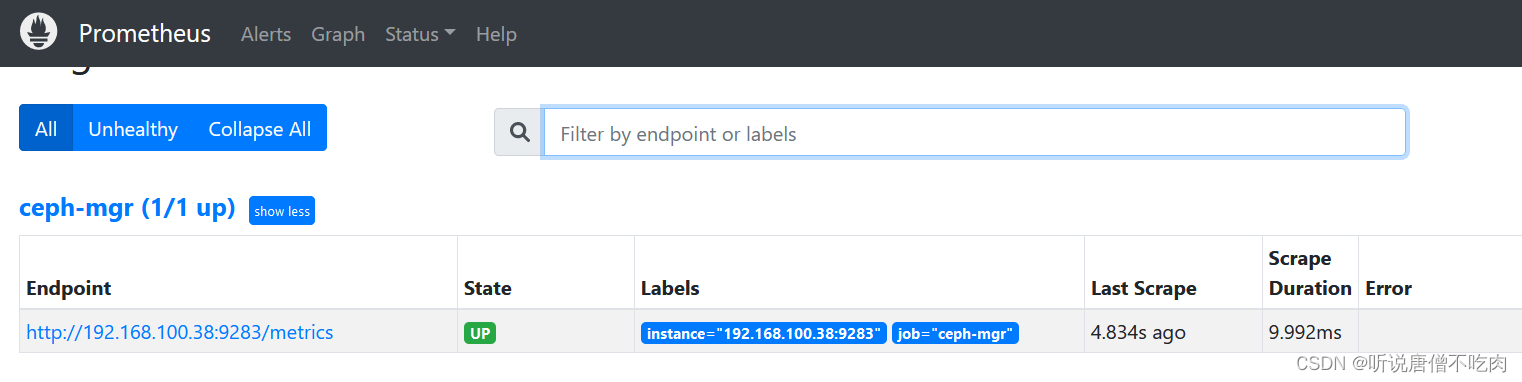
6、集成Prometheus
添加 mgr 节点 metrics 采集任务
vim prometheus.yml
- job_name: "ceph-mgr"
    static_configs:
      - targets: ["172.168.100.38:9283"]
重启prometheus
systemctl restart prometheus
prometheus server验证
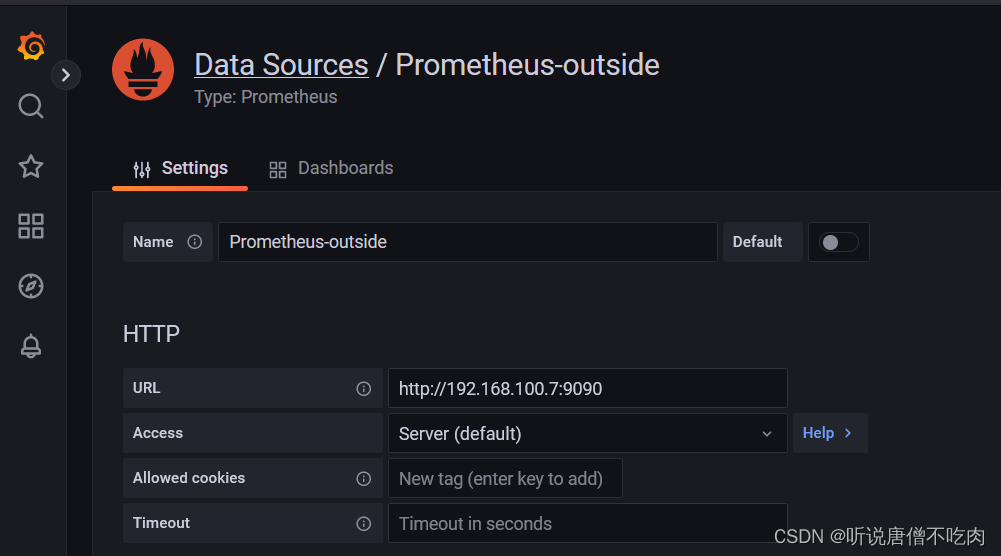
集成grafana数据大盘
在 grafana 添加 采集 ceph集群的 prometheus 数据源
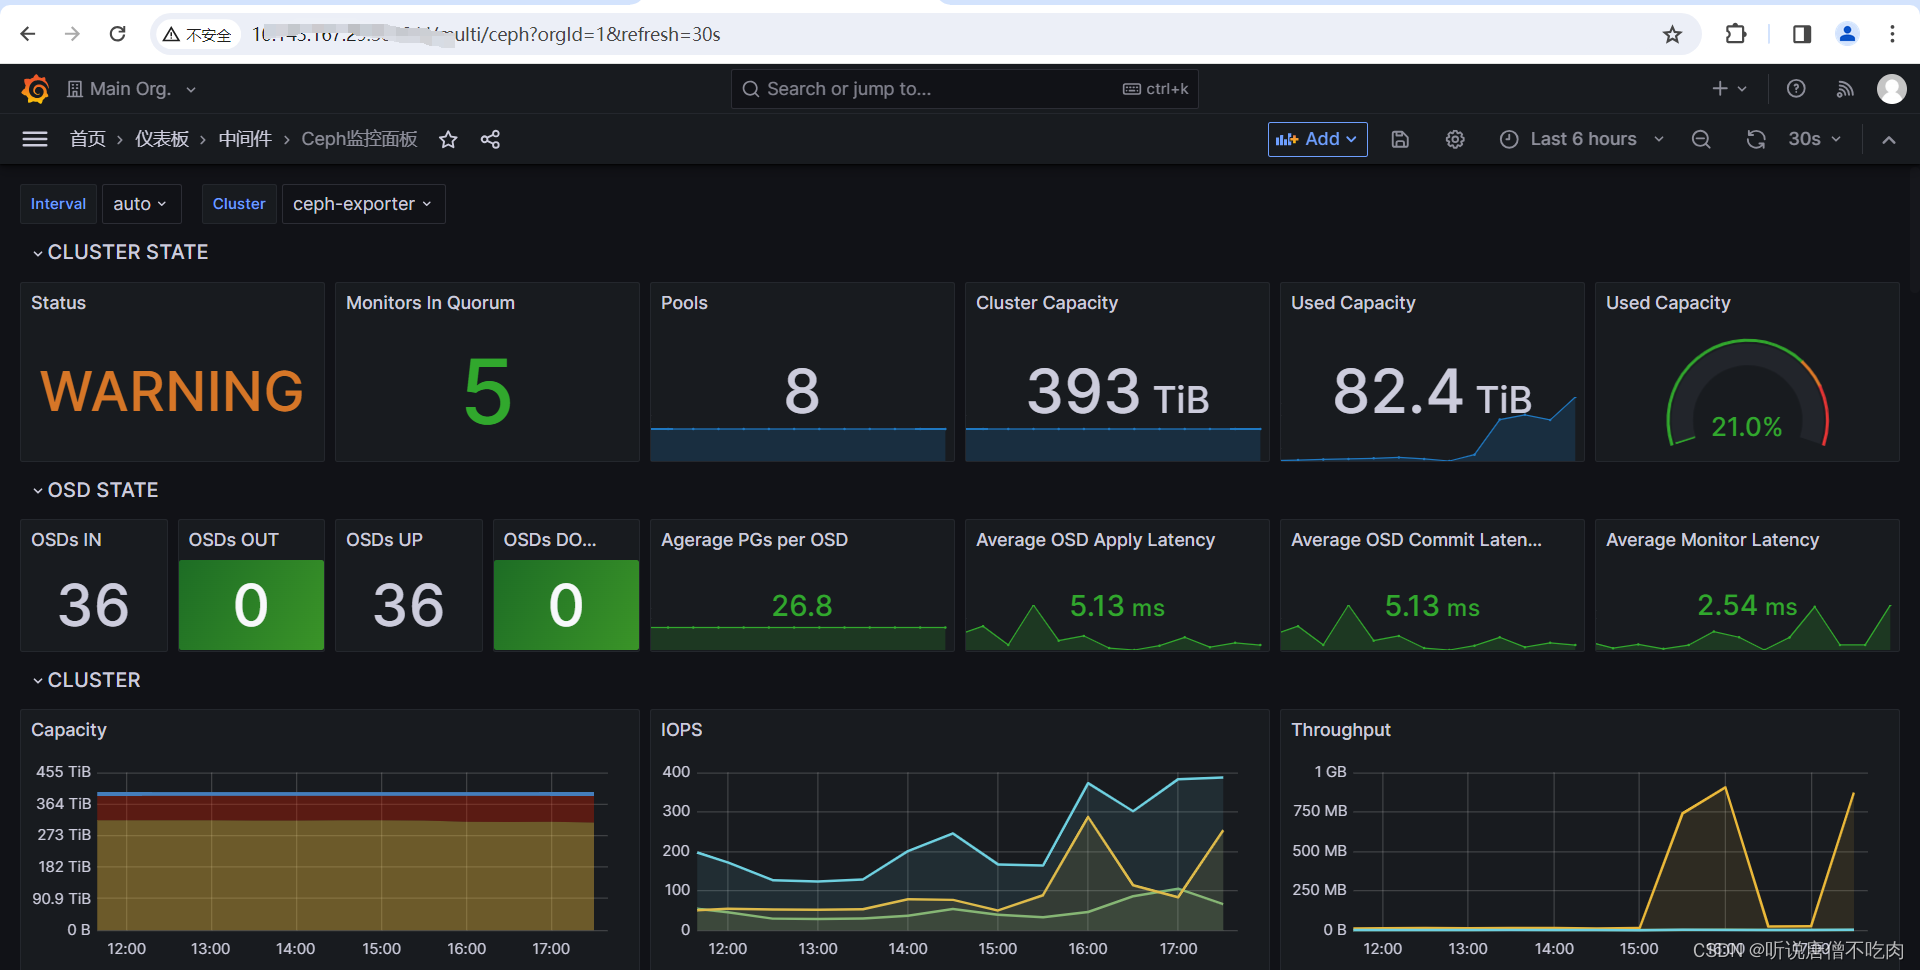
导入Ceph模板
https://grafana.com/grafana/dashboards/9966-ceph-multicluster/
OK