1 日志管理
1.1 日志管理方案
服务器数量较少时
直接登录到目标服务器捞日志查看 → 通过 rsyslog 或shell/python 等脚本实现日志搜集并集中保存到统一的日志服务器
服务器数量较多时
ELK 大型的日志系统,实现日志收集、日志存储、日志检索和分析
容器环境
EFK Loki+Granfana
1.2 使用ELK的原因
日志主要包括系统日志、应用程序日志和安全日志。系统运维和开发人员可以通过日志了解服务器软硬件信息、检查配置过程中的错误及错误发生的原因。经常分析日志可以了解服务器的负荷,性能安全性,从而及时采取措施纠正错误。 往往单台机器的日志我们使用grep、awk等工具就能基本实现简单分析,但是当日志被分散的储存不同的设备上。如果你管理数十上百台服务器,你还在使用依次登录每台机器的传统方法查阅日志。这样是不是感觉很繁琐和效率低下。当务之急我们使用集中化的日志管理,例如:开源的syslog,将所有服务器上的日志收集汇总。集中化管理日志后,日志的统计和检索又成为一件比较麻烦的事情,一般我们使用 grep、awk和wc等Linux命令能实现检索和统计,但是对于要求更高的查询、排序和统计等要求和庞大的机器数量依然使用这样的方法难免有点力不从心。 一般大型系统是一个分布式部署的架构,不同的服务模块部署在不同的服务器上,问题出现时,大部分情况需要根据问题暴露的关键信息,定位到具体的服务器和服务模块,构建一套集中式日志系统,可以提高定位问题的效率。
1.3 完整日志系统的基本特征
收集:能够采集多种来源的日志数据 传输:能够稳定的把日志数据解析过滤并传输到存储系统 存储:存储日志数据 分析:支持 UI 分析 警告:能够提供错误报告,监控机制
1.4 ELK概述
ELK平台是一套完整的日志集中处理解决方案,将 ElasticSearch、Logstash 和 Kiabana 三个开源工具配合使用, 完成更强大的用户对日志的查询、排序、统计需求。
●ElasticSearch
对日志数据进行分片、存储日志数据,并创建索引,方便全文检索
是基于Lucene(一个全文检索引擎的架构)开发的分布式存储检索引擎,用来存储各类日志。 Elasticsearch 是用 Java 开发的,可通过 RESTful Web 接口,让用户可以通过浏览器与 Elasticsearch 通信。 Elasticsearch是一个实时的、分布式的可扩展的搜索引擎,允许进行全文、结构化搜索,它通常用于索引和搜索大容量的日志数据,也可用于搜索许多不同类型的文档。
●Kiabana:Kibana
接入ElasticSearch的数据源,将日志数据进行图形化展示,方便用户通过浏览器查看统计分析日志
通常与 Elasticsearch 一起部署,Kibana 是 Elasticsearch 的一个功能强大的数据可视化 Dashboard,Kibana 提供图形化的 web 界面来浏览 Elasticsearch 日志数据,可以用来汇总、分析和搜索重要数据。
●Logstash
采集日志数据,通过插件模块对数据进行过滤、格式化处理,再输出
作为数据收集引擎。它支持动态的从各种数据源搜集数据,并对数据进行过滤、分析、丰富、统一格式等操作,然后存储到用户指定的位置,一般会发送给 Elasticsearch。 Logstash 由 Ruby 语言编写,运行在 Java 虚拟机(JVM)上,是一款强大的数据处理工具, 可以实现数据传输、格式处理、格式化输出。Logstash 具有强大的插件功能,常用于日志处理。
可以添加的其它组件:
●Filebeat
替代Logstash采集日志数据
轻量级的开源日志文件数据搜集器。通常在需要采集数据的客户端安装 Filebeat,并指定目录与日志格式,Filebeat 就能快速收集数据,并发送给 logstash 进行解析,或是直接发给 Elasticsearch 存储,性能上相比运行于 JVM 上的 logstash 优势明显,是对它的替代。常应用于 EFLK 架构当中。
#filebeat 结合 logstash 带来好处: 1)通过 Logstash 具有基于磁盘的自适应缓冲系统,该系统将吸收传入的吞吐量,从而减轻 Elasticsearch 持续写入数据的压力 2)从其他数据源(例如数据库,S3对象存储或消息传递队列)中提取 3)将数据发送到多个目的地,例如S3,HDFS(Hadoop分布式文件系统)或写入文件 4)使用条件数据流逻辑组成更复杂的处理管道
●缓存/消息队列(redis、kafka、RabbitMQ等)
作为MQ消息队列实现流量削峰、缓冲等功能
可以对高并发日志数据进行流量削峰和缓冲,这样的缓冲可以一定程度的保护数据不丢失,还可以对整个架构进行应用解耦。
●Fluentd
替代Logstash采集日志数据和过滤转换功能,常用语k8s容器环境
是一个流行的开源数据收集器。由于 logstash 太重量级的缺点,Logstash 性能低、资源消耗比较多等问题,随后就有 Fluentd 的出现。相比较 logstash,Fluentd 更易用、资源消耗更少、性能更高,在数据处理上更高效可靠,受到企业欢迎,成为 logstash 的一种替代方案,常应用于 EFK 架构当中。在 Kubernetes 集群中也常使用 EFK 作为日志数据收集的方案。 在 Kubernetes 集群中一般是通过 DaemonSet 来运行 Fluentd,以便它在每个 Kubernetes 工作节点上都可以运行一个 Pod。 它通过获取容器日志文件、过滤和转换日志数据,然后将数据传递到 Elasticsearch 集群,在该集群中对其进行索引和存储。
1.5 ELK的工作原理
(1)在所有需要收集日志的服务器上部署Logstash;或者先将日志进行集中化管理在日志服务器上,在日志服务器上部署 Logstash。 (2)Logstash 收集日志,将日志格式化并输出到 Elasticsearch 群集中。 (3)Elasticsearch 对格式化后的数据进行索引和存储。 (4)Kibana 从 ES 群集中查询数据生成图表,并进行前端数据的展示。
总结:logstash作为日志搜集器,从数据源采集数据,并对数据进行过滤,格式化处理,然后交由Elasticsearch存储,kibana对日志进行可视化处理。
2 ELK实际部署
ElasticSearch:
集群化部署,节点分为三种类型:
Master/data/client,设置相同的cluster.name并使用Zen D通过单播实现集群中节点的服务发现
创建索引
curl -X PUT 'IP地址:9200'/<索引名>/<类型>/<文档>?pretty&pretty -H 'content-Type: application/json' -d {"键名1":"键值","键名2":"键值}'
删除索引
curl -X DELETE IP地址:9200/<索引名>
查看索引配置
curl -X GET IP地址:9200/<索引名>/_settings
修改索引配置
curl -X GET IP地址:9200/<索引名>/_settings \
-H 'content-Type: application/json' -d '{"键名":"键值"}'
创建索引别名
curl -X POST IP地址:9200/ aliases \ -H 'content-Type:application/json' -d '{"actions":[{"add":{index":"索引名","akisa":"索引别名"}}]}'
删除索引别名
curl -X POST IP地址:9200/ aliases \ -H 'content-Type:application/json' -d '{"actions":[{"remove":{index":"索引名","akisa":"索引别名"}}]}'
vim /etc/sysconfig/selinux
2.1 ELK日志分析系统
实验部署环境准备,关闭防火墙和安全终端
| 虚拟机名 | IP | 需要安装的应用 |
|---|---|---|
| node01节点(2C/4G) | 192.168.88.10 | Elasticsearch |
| node02节点(2C/4G) | 192.168.88.205 | Elasticsearch |
| node03节点(2C/4G) | 192.168.88.202 | Elasticsearch |
| nginx节点 | 192.168.88.201 | Logstash Kibana nginx |
更改主机名以及检查 java环境;如果没有就 yum安装 java —— yum install -y java
#node01:192.168.88.10 [root@localhost ~]# hostnamectl set-hostname node01 [root@localhost ~]# su [root@node01 ~]# java -version openjdk version "1.8.0_131" OpenJDK Runtime Environment (build 1.8.0_131-b12) OpenJDK 64-Bit Server VM (build 25.131-b12, mixed mode) #node02:192.168.88.205 [root@localhost ~]# hostnamectl set-hostname node02 [root@localhost ~]# su [root@node02 ~]# java -version openjdk version "1.8.0_131" OpenJDK Runtime Environment (build 1.8.0_131-b12) OpenJDK 64-Bit Server VM (build 25.131-b12, mixed mode) #node03:192.168.88.202 [root@localhost ~]# hostnamectl set-hostname node03 [root@localhost ~]# su [root@node03 ~]# java -version openjdk version "1.8.0_131" OpenJDK Runtime Environment (build 1.8.0_131-b12) OpenJDK 64-Bit Server VM (build 25.131-b12, mixed mode) #nginx:192.168.88.201 [root@localhost ~]# hostnamectl set-hostname nginx [root@localhost ~]# su [root@nginx ~]# java -version openjdk version "1.8.0_131" OpenJDK Runtime Environment (build 1.8.0_131-b12) OpenJDK 64-Bit Server VM (build 25.131-b12, mixed mode)
在 node01、node02、node03上部署 Elasticsearch 软件,相同操作
#在 opt目录下传输 elasticsearch-6.7.2.rpm文件 [root@node01 ~]# cd /opt [root@node01 opt]# rz -E rz waiting to receive. [root@node01 opt]# ls elasticsearch-6.7.2.rpm rh #rpm安装 [root@node01 opt]# rpm -ivh elasticsearch-6.7.2.rpm 警告:elasticsearch-6.7.2.rpm: 头V4 RSA/SHA512 Signature, 密钥 ID d88e42b4: NOKEY 准备中... ################################# [100%] Creating elasticsearch group... OK Creating elasticsearch user... OK 正在升级/安装... 1:elasticsearch-0:6.7.2-1 ################################# [100%] ### NOT starting on installation, please execute the following statements to configure elasticsearch service to start automatically using systemd sudo systemctl daemon-reload sudo systemctl enable elasticsearch.service ### You can start elasticsearch service by executing sudo systemctl start elasticsearch.service Created elasticsearch keystore in /etc/elasticsearch #复制备份 [root@node01 opt]# cp /etc/elasticsearch/elasticsearch.yml /etc/elasticsearch/elasticsearch.yml.bak #进入配置文件,进行修改 [root@node01 opt]# vim /etc/elasticsearch/elasticsearch.yml


#过滤没 #符号的段落,检查修改的配置 [root@node01 opt]# grep -v "^#" /etc/elasticsearch/elasticsearch.yml cluster.name: mhy-elk-cluster node.name: node01 #另外两台为 node02,node03 node.master: true node.data: true path.data: /var/lib/elasticsearch path.logs: /var/log/elasticsearch bootstrap.memory_lock: true network.host: 0.0.0.0 http.port: 9200 transport.tcp.port: 9300 discovery.zen.ping.unicast.hosts: ["192.168.88.10:9300", "192.168.88.205:9300", "192.168.88.202:9300"] #进入配置文件进行添加配置 [root@node01 opt]# vim /etc/security/limits.conf * soft nofile 65536 * hard nofile 65536 * soft nproc 32000 * hard nproc 32000 * soft memlock unlimited * hard memlock unlimited

#进入配置文件,修改配置
[root@node01 opt]# vim /etc/systemd/system.conf

#进入配置文件,添加配置
[root@node01 opt]# vim /etc/sysctl.conf
vm.max_map_count=262144

#检查配置
[root@node01 opt]# sysctl -p
vm.max_map_count = 262144
[root@node01 opt]# sysctl -a | grep vm.max_map_count
sysctl: reading key "net.ipv6.conf.all.stable_secret"
sysctl: reading key "net.ipv6.conf.default.stable_secret"
sysctl: reading key "net.ipv6.conf.ens32.stable_secret"
sysctl: reading key "net.ipv6.conf.lo.stable_secret"
sysctl: reading key "net.ipv6.conf.virbr0.stable_secret"
sysctl: reading key "net.ipv6.conf.virbr0-nic.stable_secret"
vm.max_map_count = 262144
完成上述操作后重启 node01、node02、node03节点服务器,关闭防火墙和安全终端并开启服务
#重启 [root@node01 opt]# reboot #重启之后 [root@node01 ~]# systemctl stop firewalld.service [root@node01 ~]# setenforce 0 #开启服务 [root@node01 ~]# systemctl start elasticsearch.service #设置开机 [root@node01 ~]# systemctl enable elasticsearch.service Created symlink from /etc/systemd/system/multi-user.target.wants/elasticsearch.service to /usr/lib/systemd/system/elasticsearch.service. #查看服务 [root@node01 ~]# netstat -natp|grep 9200 tcp6 0 0 :::9200 :::* LISTEN 2665/java
浏览器访问测试
浏览器访问 http://IP:9200查看节点 node01、node02、node03 的信息 浏览器访问 http://IP:9200/_cluster/health?pretty 查看群集的健康情况,可以看到 status 值为 green(绿色), 表示节点健康运行 浏览器访问 http://IP:9200/_cluster/state?pretty 检查群集状态信息


挑选一台节点服务器进行后续操作,这里选择 node01节点服务器
在 node01上安装 node
#在 opt目录下传输文件 node-v8.2.1.tar.gz [root@node01 ~]# cd /opt [root@node01 opt]# rz -E rz waiting to receive. [root@node01 opt]# ls elasticsearch-6.7.2.rpm node-v8.2.1.tar.gz rh #yum安装编译环境 [root@node01 opt]# yum install gcc gcc-c++ make -y #解压压缩包 [root@node01 opt]# tar xf node-v8.2.1.tar.gz #cd到指定目录下,进行编译安装 [root@node01 opt]# cd node-v8.2.1/ [root@node01 node-v8.2.1]# ./configure [root@node01 node-v8.2.1]# make -j 4 && make install
在 node01上安装 phantomjs
#cd到 opt目录下传输文件 phantomjs-2.1.1-linux-x86_64.tar.bz2 [root@node01 node-v8.2.1]# cd /opt/ [root@node01 opt]# rz -E rz waiting to receive. [root@node01 opt]# ls elasticsearch-6.7.2.rpm phantomjs-2.1.1-linux-x86_64.tar.bz2 node-v8.2.1 rh node-v8.2.1.tar.gz #解压安装包 [root@node01 opt]# tar xf phantomjs-2.1.1-linux-x86_64.tar.bz2 #cd到指定目录下将 phantomjs文件复制到指定位置 [root@node01 opt]# cd phantomjs-2.1.1-linux-x86_64/bin/ [root@node01 bin]# ls phantomjs [root@node01 bin]# cp phantomjs /usr/local/bin/
在 node01上安装 Elasticsearch-head 数据可视化工具,并启动
#cd到 opt目录下传输 elasticsearch-head-master.zip [root@node01 bin]# cd /opt/ [root@node01 opt]# rz -E rz waiting to receive. [root@node01 opt]# ls elasticsearch-6.7.2.rpm elasticsearch-head-master.zip node-v8.2.1 node-v8.2.1.tar.gz phantomjs-2.1.1-linux-x86_64 phantomjs-2.1.1-linux-x86_64.tar.bz2 rh #解压压缩包 [root@node01 opt]# unzip elasticsearch-head-master.zip #cd到指定目录下,进行安装 [root@node01 opt]# cd elasticsearch-head-master/ [root@node01 elasticsearch-head-master]# npm install
最后是以下结果为成功,第一次大概率失败,再来一次大概率成功

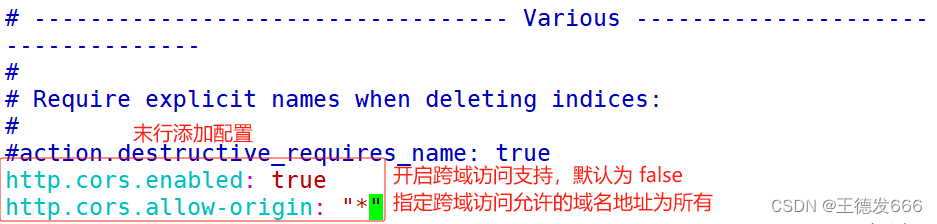
#进入配置文件,添加配置
[root@node01 elasticsearch-head-master]# vim /etc/elasticsearch/elasticsearch.yml
http.cors.enabled: true
http.cors.allow-origin: "*"
#重启服务 [root@node01 elasticsearch-head-master]# systemctl restart elasticsearch.service #后台启动服务,最后 Ctrl+c即可 [root@node01 elasticsearch-head-master]# npm run start & [1] 48865 [root@node01 elasticsearch-head-master]# > elasticsearch-head@0.0.0 start /opt/elasticsearch-head-master > grunt server Running "connect:server" (connect) task Waiting forever... Started connect web server on http://localhost:9100 ^C #查看服务端口 [root@node01 elasticsearch-head-master]# netstat -napt|grep 9100 tcp 0 0 0.0.0.0:9100 0.0.0.0:* LISTEN 48875/grunt
浏览器访问 http://192.168.88.10:9100验证

插入索引
#创建一个索引,user定义名字,mesg定义内容
[root@node01 elasticsearch-head-master]# curl -X PUT 'localhost:9200/index-demo/test/1?pretty&pretty' -H 'content-Type: application/json' -d '{"user":"superman","mesg":"welcome to yuanshen"}'
{
  "_index" : "index-demo",
  "_type" : "test",
  "_id" : "1",
  "_version" : 1,
  "result" : "created",
  "_shards" : {
    "total" : 2,
    "successful" : 1,
    "failed" : 0
  },
  "_seq_no" : 0,
  "_primary_term" : 1
}
浏览器访问 http://192.168.88.10:9100验证


在 nginx节点服务器进行部署 nginx操作
#进入 yum源目录下添加 nginx.repo [root@nginx ~]# cd /etc/yum.repos.d/ [root@nginx yum.repos.d]# rz -E rz waiting to receive. [root@nginx yum.repos.d]# ls CentOS-Base.repo CentOS-fasttrack.repo CentOS-Vault.repo CentOS-CR.repo CentOS-Media.repo nginx.repo CentOS-Debuginfo.repo CentOS-Sources.repo #设置 nginx服务开机自启 [root@nginx yum.repos.d]# systemctl enable --now nginx Created symlink from /etc/systemd/system/multi-user.target.wants/nginx.service to /usr/lib/systemd/system/nginx.service.
浏览器访问 http://192.168.88.201验证

检查 nginx服务的正确和错误的文件
#cd到指定目录下
[root@nginx yum.repos.d]# cd /var/log/nginx/
[root@nginx nginx]# ls
access.log  error.log
Logstash 命令常用选项
| 选项 | 作用 |
|---|---|
| -f | 通过这个选项可以指定 Logstash 的配置文件,根据配置文件配置 Logstash 的输入和输出流 |
| -e | 从命令行中获取,输入、输出后面跟着字符串,该字符串可以被当作 Logstash 的配置(如果是空,则默认使用 stdin 作为输入,stdout 作为输出) |
| -t | 测试配置文件是否正确,然后退出 |
| -w | 指定 filter线程数量,默认线程数是 5 |
| -l | 指定日志文件名称 |
在 nginx节点服务器上安装 logstash
#cd到 opt目录下传输 logstash-6.7.2.rpm安装包 [root@nginx nginx]# cd /opt/ [root@nginx opt]# rz -E rz waiting to receive. [root@nginx opt]# ls logstash-6.7.2.rpm rh #安装 [root@nginx opt]# rpm -ivh logstash-6.7.2.rpm 警告:logstash-6.7.2.rpm: 头V4 RSA/SHA512 Signature, 密钥 ID d88e42b4: NOKEY 准备中... ################################# [100%] 正在升级/安装... 1:logstash-1:6.7.2-1 ################################# [100%] Using provided startup.options file: /etc/logstash/startup.options /usr/share/logstash/vendor/bundle/jruby/2.5.0/gems/pleaserun-0.0.30/lib/pleaserun/platform/base.rb:112: warning: constant ::Fixnum is deprecated Successfully created system startup script for Logstash #检查 logstash文件 [root@nginx opt]# cd /usr/share/logstash/bin/ [root@nginx bin]# ls benchmark.sh logstash-keystore pqrepair cpdump logstash-keystore.bat ruby dependencies-report logstash.lib.sh setup.bat ingest-convert.sh logstash-plugin system-install logstash logstash-plugin.bat logstash.bat pqcheck #优化路径 [root@nginx bin]# ln -s /usr/share/logstash/bin/logstash /usr/local/bin/ #设置 [root@nginx bin]# systemctl enable logstash.service Created symlink from /etc/systemd/system/multi-user.target.wants/logstash.service to /etc/systemd/system/logstash.service.
定义输入和输出流,Ctrl+c退出
#输入采用标准输入,输出采用标准输出(类似管道),新版本默认使用 rubydebug 格式输出
[root@nginx bin]# logstash -e 'input { stdin{} } output { stdout{} }'
.......... #显示类似以下内容成功
[INFO ] 2024-01-20 18:39:38.757 [Ruby-0-Thread-1: /usr/share/logstash/lib/bootstrap/environment.rb:6] agent - Pipelines running {:count=>1, :running_pipelines=>[:main], :non_running_pipelines=>[]}
[INFO ] 2024-01-20 18:39:38.885 [Api Webserver] agent - Successfully started Logstash API endpoint {:port=>9600}
#直接自定义输入内容
mhy
/usr/share/logstash/vendor/bundle/jruby/2.5.0/gems/awesome_print-1.7.0/lib/awesome_print/formatters/base_formatter.rb:31: warning: constant ::Fixnum is deprecated
#显示以下内容成功
{
"message" => "mhy",
"@version" => "1",
"@timestamp" => 2024-01-20T10:40:15.112Z,
"host" => "nginx"
}
^C[WARN ] 2024-01-20 18:40:32.725 [SIGINT handler] runner - SIGINT received. Shutting down.
[INFO ] 2024-01-20 18:40:32.951 [[main]-pipeline-manager] pipeline - Pipeline has terminated {:pipeline_id=>"main", :thread=>"#<Thread:0x45300334 run>"}
[INFO ] 2024-01-20 18:40:32.969 [LogStash::Runner] runner - Logstash shut down.
#使用 rubydebug 输出详细格式显示,codec 为一种编解码器
[root@nginx bin]# logstash -e 'input { stdin{} } output { stdout{ codec=>rubydebug } }'
.......... #显示类似以下内容成功
[INFO ] 2024-01-20 18:42:32.798 [Ruby-0-Thread-1: /usr/share/logstash/lib/bootstrap/environment.rb:6] agent - Pipelines running {:count=>1, :running_pipelines=>[:main], :non_running_pipelines=>[]}
[INFO ] 2024-01-20 18:42:32.923 [Api Webserver] agent - Successfully started Logstash API endpoint {:port=>9600}
#直接自定义输入内容
banana
/usr/share/logstash/vendor/bundle/jruby/2.5.0/gems/awesome_print-1.7.0/lib/awesome_print/formatters/base_formatter.rb:31: warning: constant ::Fixnum is deprecated
#显示以下内容成功
{
"message" => "banana",
"@timestamp" => 2024-01-20T10:42:45.156Z,
"@version" => "1",
"host" => "nginx"
}
^C[WARN ] 2024-01-20 18:42:50.636 [SIGINT handler] runner - SIGINT received. Shutting down.
[INFO ] 2024-01-20 18:42:50.835 [[main]-pipeline-manager] pipeline - Pipeline has terminated {:pipeline_id=>"main", :thread=>"#<Thread:0x545c933b run>"}
[INFO ] 2024-01-20 18:42:50.855 [LogStash::Runner] runner - Logstash shut down.
#使用 Logstash 将信息写入 Elasticsearch 中
[root@nginx bin]# logstash -e 'input { stdin{} } output { elasticsearch { hosts=>["192.168.88.10:9200"] } }'
.......... #显示类似以下内容成功
[INFO ] 2024-01-20 18:46:42.523 [Converge PipelineAction::Create<main>] pipeline - Pipeline started successfully {:pipeline_id=>"main", :thread=>"#<Thread:0x3f11050f run>"}
The stdin plugin is now waiting for input:
[INFO ] 2024-01-20 18:46:42.565 [Ruby-0-Thread-1: /usr/share/logstash/lib/bootstrap/environment.rb:6] agent - Pipelines running {:count=>1, :running_pipelines=>[:main], :non_running_pipelines=>[]}
[INFO ] 2024-01-20 18:46:42.697 [Api Webserver] agent - Successfully started Logstash API endpoint {:port=>9600}
#直接自定义输入内容,并前往浏览器进行访问验证
hyh is shen xu
wx is da shuai be
^C[WARN ] 2024-01-20 18:47:23.055 [SIGINT handler] runner - SIGINT received. Shutting down.
[INFO ] 2024-01-20 18:47:23.622 [[main]-pipeline-manager] pipeline - Pipeline has terminated {:pipeline_id=>"main", :thread=>"#<Thread:0x3f11050f run>"}
[INFO ] 2024-01-20 18:47:23.624 [LogStash::Runner] runner - Logstash shut down.
浏览器访问 http://192.168.88.10:9100验证


定义 logstash配置文件
Logstash 配置文件基本由三部分组成:input、output 以及 filter(可选,根据需要选择使用)。
—— input:表示从数据源采集数据,常见的数据源如Kafka、日志文件等;file beats kafka redis stdin
—— filter:表示数据处理层,包括对数据进行格式化处理、数据类型转换、数据过滤等,支持正则表达式
-
grok 对若干个大文本字段进行再分割成一些小字段 (?<字段名>正则表达式) 字段名: 正则表达式匹配到的内容
-
date 对数据中的时间格式进行统一和格式化
-
mutate 对一些无用的字段进行剔除,或增加字段
-
mutiline 对多行数据进行统一编排,多行合并或拆分
—— output:表示将Logstash收集的数据经由过滤器处理之后输出到Elasticsearch;elasticsearch stdout
#cd到指定目录,赋予日志文件权限
[root@nginx bin]# cd /var/log/
[root@nginx log]# chmod a+r messages
[root@nginx log]# ll
..........
-rw-r--r--. 1 root root 1909 1月 20 18:50 messages
..........
#cd到指定目录
[root@nginx log]# cd /etc/logstash/
#创建 sincedb_path目录
[root@nginx logstash]# mkdir sincedb_path
[root@nginx logstash]# ls
conf.d log4j2.properties logstash.yml sincedb_path
jvm.options logstash-sample.conf pipelines.yml startup.options
#cd到 sincedb_path目录下创建一个 log_progress文件
[root@nginx logstash]# cd sincedb_path/
[root@nginx sincedb_path]# touch log_progress
#更改 log_progress的属组和属主;检查
[root@nginx sincedb_path]# chown logstash. log_progress
[root@nginx sincedb_path]# ll
总用量 0
-rw-r--r--. 1 logstash logstash 0 1月 20 19:00 log_progress
#进入 conf.d/目录下
[root@nginx sincedb_path]# cd ..
[root@nginx logstash]# cd conf.d/
[root@nginx conf.d]# pwd
/etc/logstash/conf.d
#创建一个 syslog.conf脚本文件
[root@nginx conf.d]# vim syslog.conf
input {
file {
path => "/var/log/messages"
type => "syslog"
start_position => "beginning"
sincedb_path => "/etc/logstash/sincedb_path/log_progress"
add_field => { "log_hostname" => "${HOSTNAME}" }
}
}
#filter {}
output {
elasticsearch {
hosts => ["192.168.88.202:9200", "192.168.88.205:9200" , "192.168.88.10:9200"]
index => "syslog-%{+yyyy.MM.dd}"
}
}

#检查配置,显示 ok为正确
[root@nginx conf.d]# logstash -t -f syslog.conf
WARNING: Could not find logstash.yml which is typically located in $LS_HOME/config or /etc/logstash. You can specify the path using --path.settings. Continuing using the defaults
Could not find log4j2 configuration at path /usr/share/logstash/config/log4j2.properties. Using default config which logs errors to the console
[WARN ] 2024-01-20 19:13:03.249 [LogStash::Runner] multilocal - Ignoring the 'pipelines.yml' file because modules or command line options are specified
Configuration OK #ok说明配置无误
[INFO ] 2024-01-20 19:13:06.277 [LogStash::Runner] runner - Using config.test_and_exit mode. Config Validation Result: OK. Exiting Logstash
#启动服务
[root@nginx conf.d]# logstash -f syslog.conf
.......... #显示类似以下内容成功
[INFO ] 2024-01-20 19:18:22.785 [Converge PipelineAction::Create<main>] pipeline - Pipeline started successfully {:pipeline_id=>"main", :thread=>"#<Thread:0x7fabeac3 sleep>"}
[INFO ] 2024-01-20 19:18:22.800 [[main]<file] observingtail - START, creating Discoverer, Watch with file and sincedb collections
[INFO ] 2024-01-20 19:18:22.820 [Ruby-0-Thread-1: /usr/share/logstash/lib/bootstrap/environment.rb:6] agent - Pipelines running {:count=>1, :running_pipelines=>[:main], :non_running_pipelines=>[]}
[INFO ] 2024-01-20 19:18:22.995 [Api Webserver] agent - Successfully started Logstash API endpoint {:port=>9600}
#直接自定义输入内容,并前往浏览器进行访问验证
jhc is fei wu
^C[WARN ] 2024-01-20 19:18:49.489 [SIGINT handler] runner - SIGINT received. Shutting down.
[INFO ] 2024-01-20 19:18:49.554 [Converge PipelineAction::Stop<main>] observingtail - QUIT - closing all files and shutting down.
[INFO ] 2024-01-20 19:18:50.668 [[main]-pipeline-manager] pipeline - Pipeline has terminated {:pipeline_id=>"main", :thread=>"#<Thread:0x7fabeac3 run>"}
[INFO ] 2024-01-20 19:18:50.670 [LogStash::Runner] runner - Logstash shut down.
浏览器访问 http://192.168.88.10:9100验证

在 node01上部署 kibanna
#cd到 opt下传输 kibana-6.7.2-x86_64.rpm [root@node01 elasticsearch-head-master]# cd /opt/ [root@node01 opt]# rz -E rz waiting to receive. [root@node01 opt]# ls elasticsearch-6.7.2.rpm elasticsearch-head-master elasticsearch-head-master.zip kibana-6.7.2-x86_64.rpm node-v8.2.1 node-v8.2.1.tar.gz phantomjs-2.1.1-linux-x86_64 phantomjs-2.1.1-linux-x86_64.tar.bz2 rh #rpm安装 [root@node01 opt]# rpm -ivh kibana-6.7.2-x86_64.rpm 警告:kibana-6.7.2-x86_64.rpm: 头V4 RSA/SHA512 Signature, 密钥 ID d88e42b4: NOKEY 准备中... ################################# [100%] 正在升级/安装... 1:kibana-6.7.2-1 ################################# [100%] #进入配置文件,末行添加配置 [root@node01 opt]# vim /etc/kibana/kibana.yml


#检查修改的配置文件 [root@node01 opt]# grep -v "^#" /etc/kibana/kibana.yml server.port: 5601 server.host: "0.0.0.0" elasticsearch.hosts: ["http://192.168.88.10:9200", "http://192.168.88.205:9200", "http://192.168.88.202:9200"] kibana.index: ".kibana" logging.dest: /var/log/kibana.log #在指定目录下创建 kibana.log文件 [root@node01 opt]# touch /var/log/kibana.log #更改 kibana.log其属主和属组 [root@node01 opt]# chown kibana. /var/log/kibana.log #开启 kibana.service服务 [root@node01 opt]# systemctl start kibana.service #设置开机自启 [root@node01 opt]# systemctl enable --now kibana.service Created symlink from /etc/systemd/system/multi-user.target.wants/kibana.service to /etc/systemd/system/kibana.service. #查看服务端口 [root@node01 opt]# netstat -natp|grep 5601 tcp 0 0 0.0.0.0:5601 0.0.0.0:* LISTEN 88066/node #进入配置文件,将语言改成中文 [root@node01 opt]# vim /etc/kibana/kibana.yml

#重启 kibana.service服务
[root@node01 opt]# systemctl restart kibana.service
浏览器访问 http://192.168.88.10:5601测试


浏览器访问 http://192.168.88.10:9100查看

在 nginx节点服务器上将 nginx服务器的日志(访问的、错误的)添加到 Elasticsearch 并通过 Kibana 显示
[root@nginx conf.d]# pwd
/etc/logstash/conf.d
[root@nginx conf.d]# vim nginx_log.conf
input {
    file{
        path => "/var/log/nginx/access.log"
        type => "access"
        start_position => "beginning"
    }
    file{
        path => "/var/log/nginx/error.log"
        type => "error"
        start_position => "beginning"
    }
}
output {
    if [type] == "access" {
        elasticsearch {
            hosts => ["192.168.88.10:9200","192.168.88.205:9200","192.168.88.202:9200"]
            index => "nginx_access-%{+YYYY.MM.dd}"
        }
    }
    if [type] == "error" {
        elasticsearch {
            hosts => ["192.168.88.10:9200","192.168.88.205:9200","192.168.88.202:9200"]
            index => "nginx_error-%{+YYYY.MM.dd}"
        }
    }
}

[root@nginx conf.d]# /usr/share/logstash/bin/logstash -f nginx_log.conf
.......... #显示类似以下内容成功
[INFO ] 2024-01-20 20:24:34.108 [[main]-pipeline-manager] file - No sincedb_path set, generating one based on the "path" setting {:sincedb_path=>"/usr/share/logstash/data/plugins/inputs/file/.sincedb_d883144359d3b4f516b37dba51fab2a2", :path=>["/var/log/nginx/access.log"]}
[INFO ] 2024-01-20 20:24:34.126 [[main]-pipeline-manager] file - No sincedb_path set, generating one based on the "path" setting {:sincedb_path=>"/usr/share/logstash/data/plugins/inputs/file/.sincedb_c1bc5cb2bf1f2e3ee39c0f9e9bfcaedc", :path=>["/var/log/nginx/error.log"]}
[INFO ] 2024-01-20 20:24:34.139 [Converge PipelineAction::Create<main>] pipeline - Pipeline started successfully {:pipeline_id=>"main", :thread=>"#<Thread:0x16d83b3 run>"}
[INFO ] 2024-01-20 20:24:34.173 [[main]<file] observingtail - START, creating Discoverer, Watch with file and sincedb collections
[INFO ] 2024-01-20 20:24:34.175 [[main]<file] observingtail - START, creating Discoverer, Watch with file and sincedb collections
[INFO ] 2024-01-20 20:24:34.197 [Ruby-0-Thread-1: /usr/share/logstash/lib/bootstrap/environment.rb:6] agent - Pipelines running {:count=>1, :running_pipelines=>[:main], :non_running_pipelines=>[]}
[INFO ] 2024-01-20 20:24:34.474 [Api Webserver] agent - Successfully started Logstash API endpoint {:port=>9600}
#Ctrl+c退出
^C[WARN ] 2024-01-20 20:26:30.552 [SIGINT handler] runner - SIGINT received. Shutting down.
[INFO ] 2024-01-20 20:26:30.621 [Converge PipelineAction::Stop<main>] observingtail - QUIT - closing all files and shutting down.
[INFO ] 2024-01-20 20:26:30.624 [Converge PipelineAction::Stop<main>] observingtail - QUIT - closing all files and shutting down.
[INFO ] 2024-01-20 20:26:32.551 [[main]-pipeline-manager] pipeline - Pipeline has terminated {:pipeline_id=>"main", :thread=>"#<Thread:0x16d83b3 run>"}
[INFO ] 2024-01-20 20:26:32.554 [LogStash::Runner] runner - Logstash shut down.
在 nginx节点服务器上将 nginx服务关闭,然后浏览器访问 http://192.168.88.201显示访问失败获得错误日志,再将 nginx服务器开启,然后再去浏览器上访问 http://192.168.88.201显示 nginx界面获得成功日志,最后再去浏览器访问 http://192.168.88.10:9100验证结果
[root@nginx conf.d]# systemctl stop nginx.service
浏览器访问 http://192.168.88.201

[root@nginx conf.d]# systemctl start nginx
浏览器访问 http://192.168.88.201

浏览器访问 http://192.168.88.10:9100验证结果

浏览器访问 http://192.168.88.10:5601


Filebeat+ELK 部署
安装 Filebeat 上传软件包 filebeat-6.7.2-linux-x86_64.tar.gz 到/opt目录 tar zxvf filebeat-6.7.2-linux-x86_64.tar.gz mv filebeat-6.7.2-linux-x86_64/ /usr/local/filebeat 设置 filebeat 的主配置文件 cd /usr/local/filebeat vim filebeat.yml filebeat.inputs: - type: log #指定 log 类型,从日志文件中读取消息 enabled: true paths: - /var/log/messages #指定监控的日志文件 - /var/log/*.log tags: ["sys"] #设置索引标签 fields: #可以使用 fields 配置选项设置一些参数字段添加到 output 中 service_name: filebeat log_type: syslog from: 192.168.80.13 --------------Elasticsearch output------------------- (全部注释掉) ----------------Logstash output--------------------- output.logstash: hosts: ["192.168.80.12:5044"] #指定 logstash 的 IP 和端口


启动 filebeat
nohup ./filebeat -e -c filebeat.yml > filebeat.out &
#-e:输出到标准输出,禁用syslog/文件输出
#-c:指定配置文件
#nohup:在系统后台不挂断地运行命令,退出终端不会影响程序的运行

在 Logstash 组件所在节点上新建一个 Logstash 配置文件
cd /etc/logstash/conf.d
vim filebeat.conf
input {
beats {
port => "5044"
}
}
#filebeat发送给logstash的日志内容会放到message字段里面,logstash使用grok插件正则匹配message字段内容进行字段分割
#Kibana自带grok的正则匹配的工具:http://<your kibana IP>:5601/app/kibana#/dev_tools/grokdebugger
# %{IPV6}|%{IPV4} 为 logstash 自带的 IP 常量
filter {
grok {
match => ["message", "(?<remote_addr>%{IPV6}|%{IPV4})[\s\-]+\[(?<logTime>.*)\]\s+\"(?<method>\S+)\s+(?<url_path>.+)\"\s+(?<rev_code>\d+) \d+ \"(?<req_addr>.+)\" \"(?<content>.*)\""]
}
}
output {
elasticsearch {
hosts => ["192.168.80.10:9200","192.168.80.11:9200"]
index => "%{[fields][service_name]}-%{+YYYY.MM.dd}"
}
stdout {
codec => rubydebug
}
}
#启动 logstash
logstash -f filebeat.conf

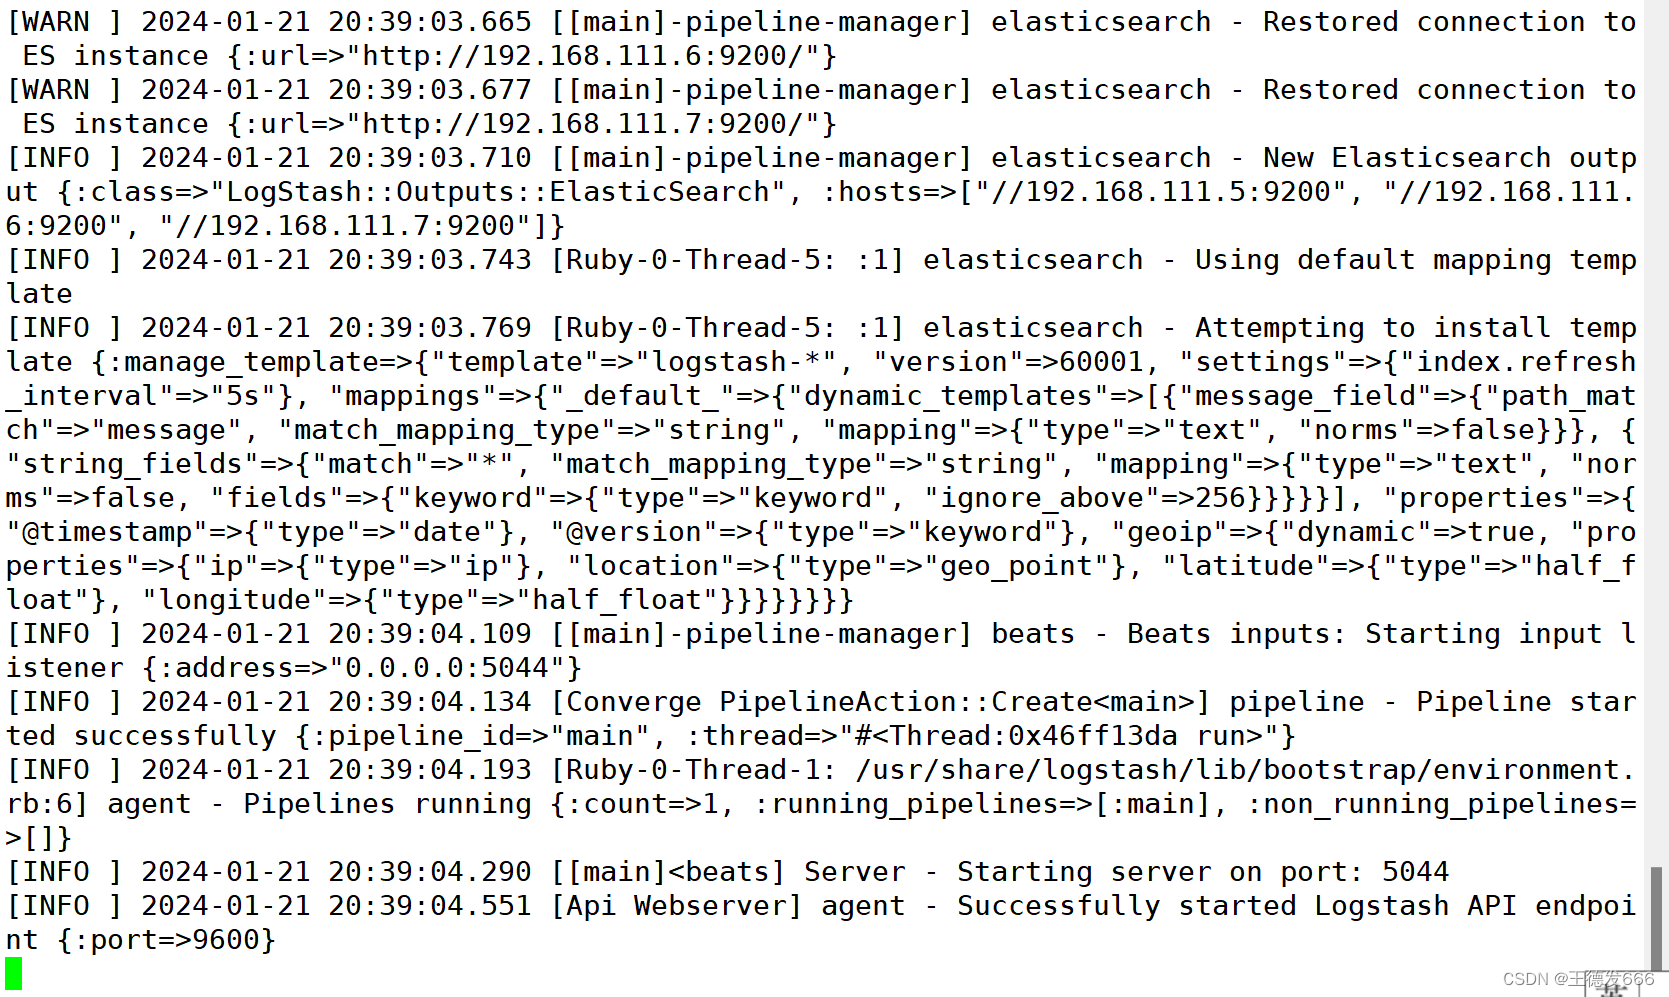
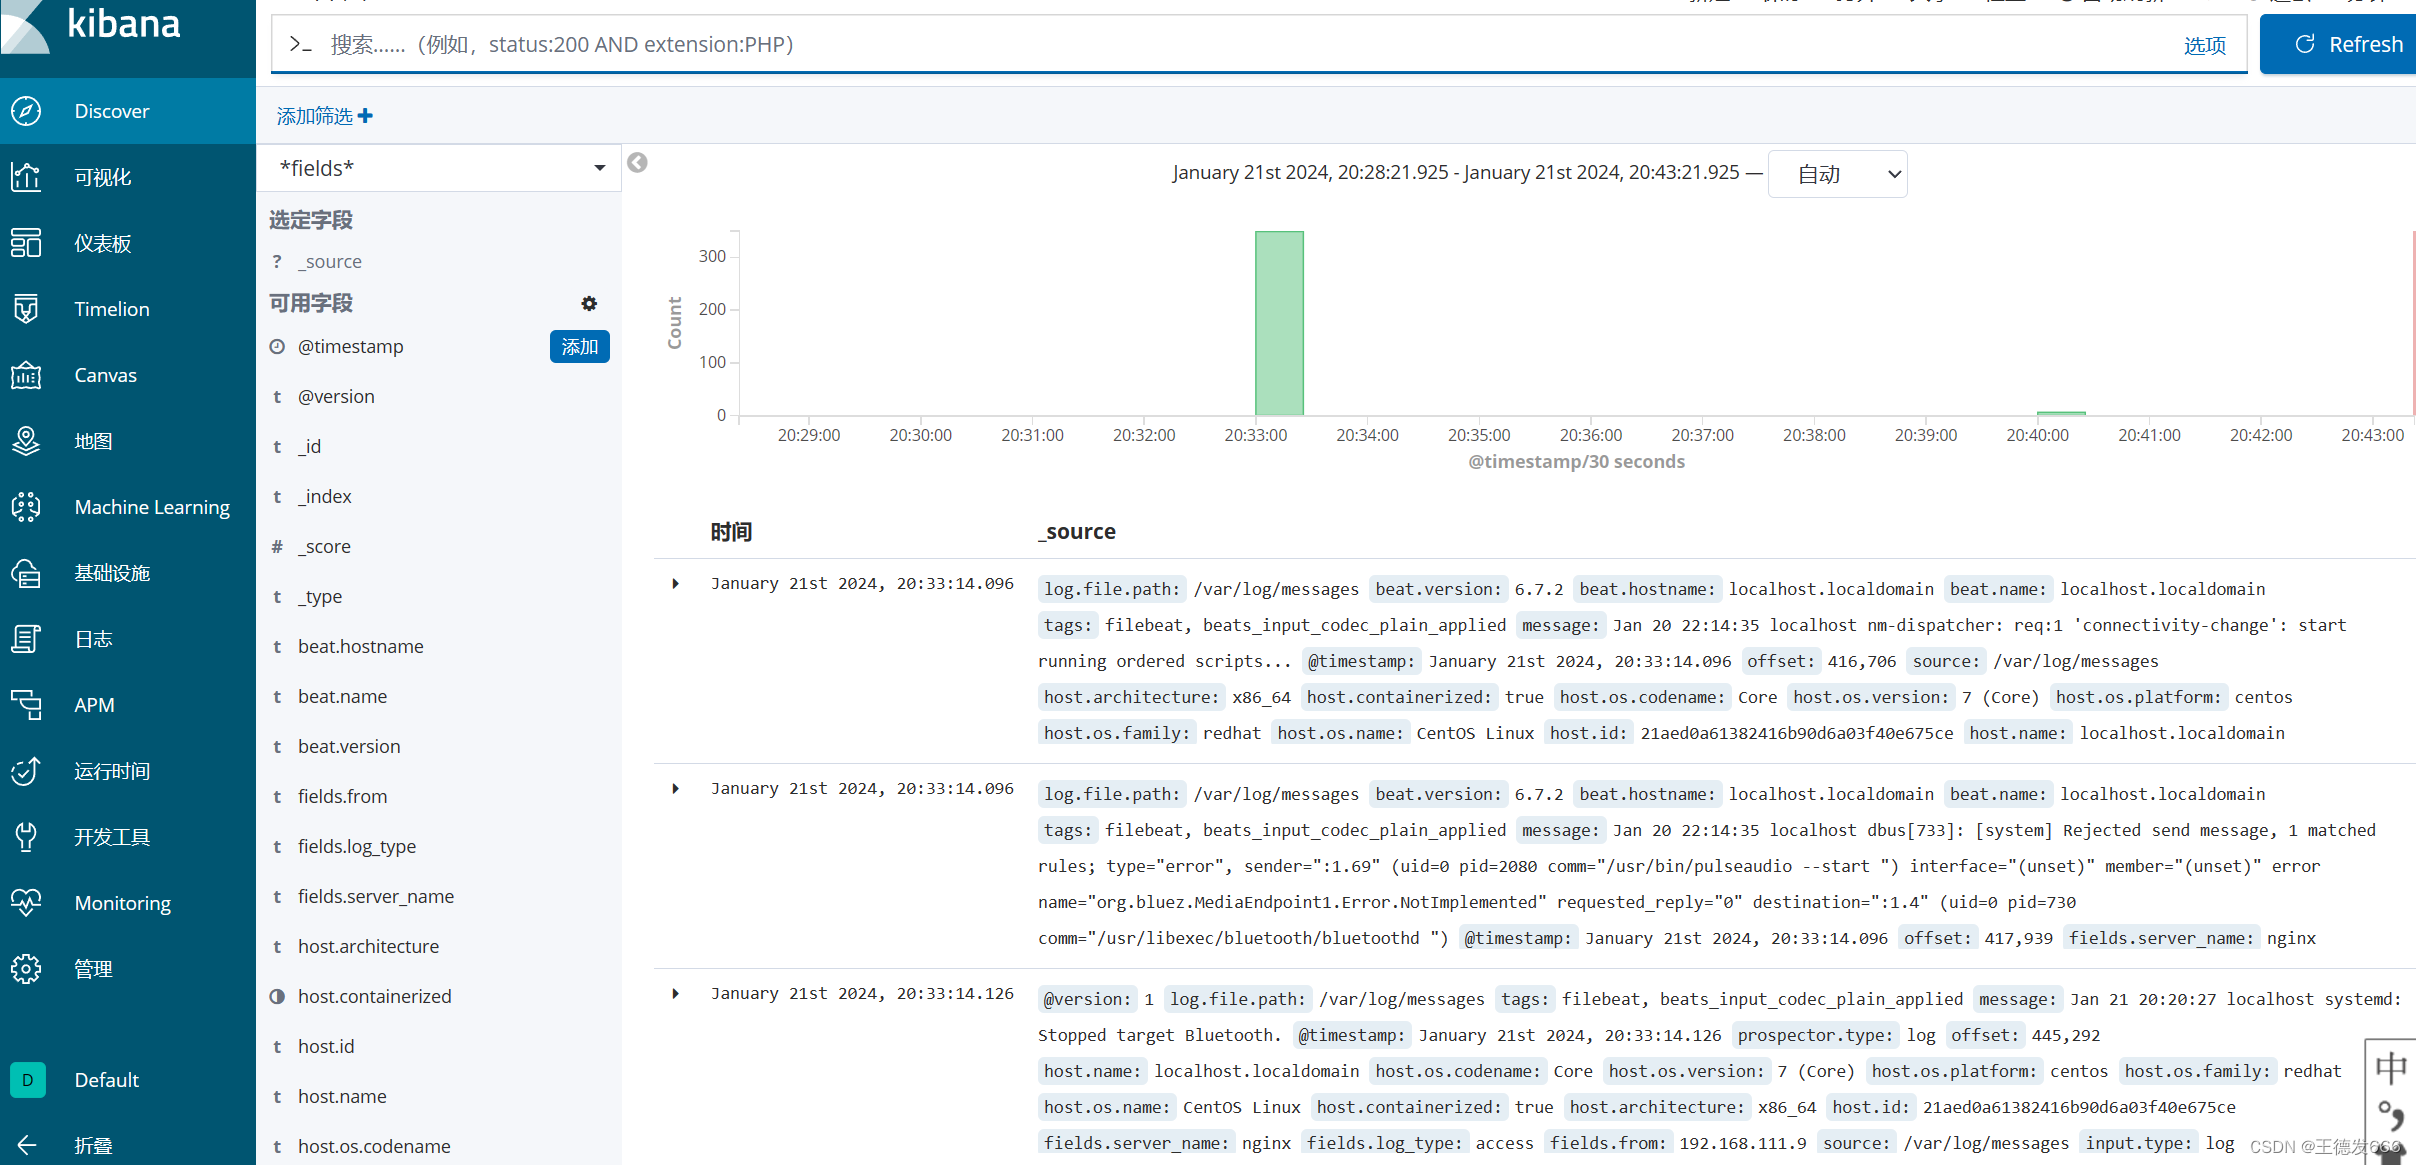
浏览器访问 http://192.168.80.10:5601 登录 Kibana,单击“Create Index Pattern”按钮添加索引“filebeat-*”,单击 “create” 按钮创建,单击 “Discover” 按钮可查看图表信息及日志信息。


![[设计模式Java实现附plantuml源码~创建型] 对象的克隆~原型模式](https://img-blog.csdnimg.cn/direct/2473c30ed78045959184631275c0a1bb.png)