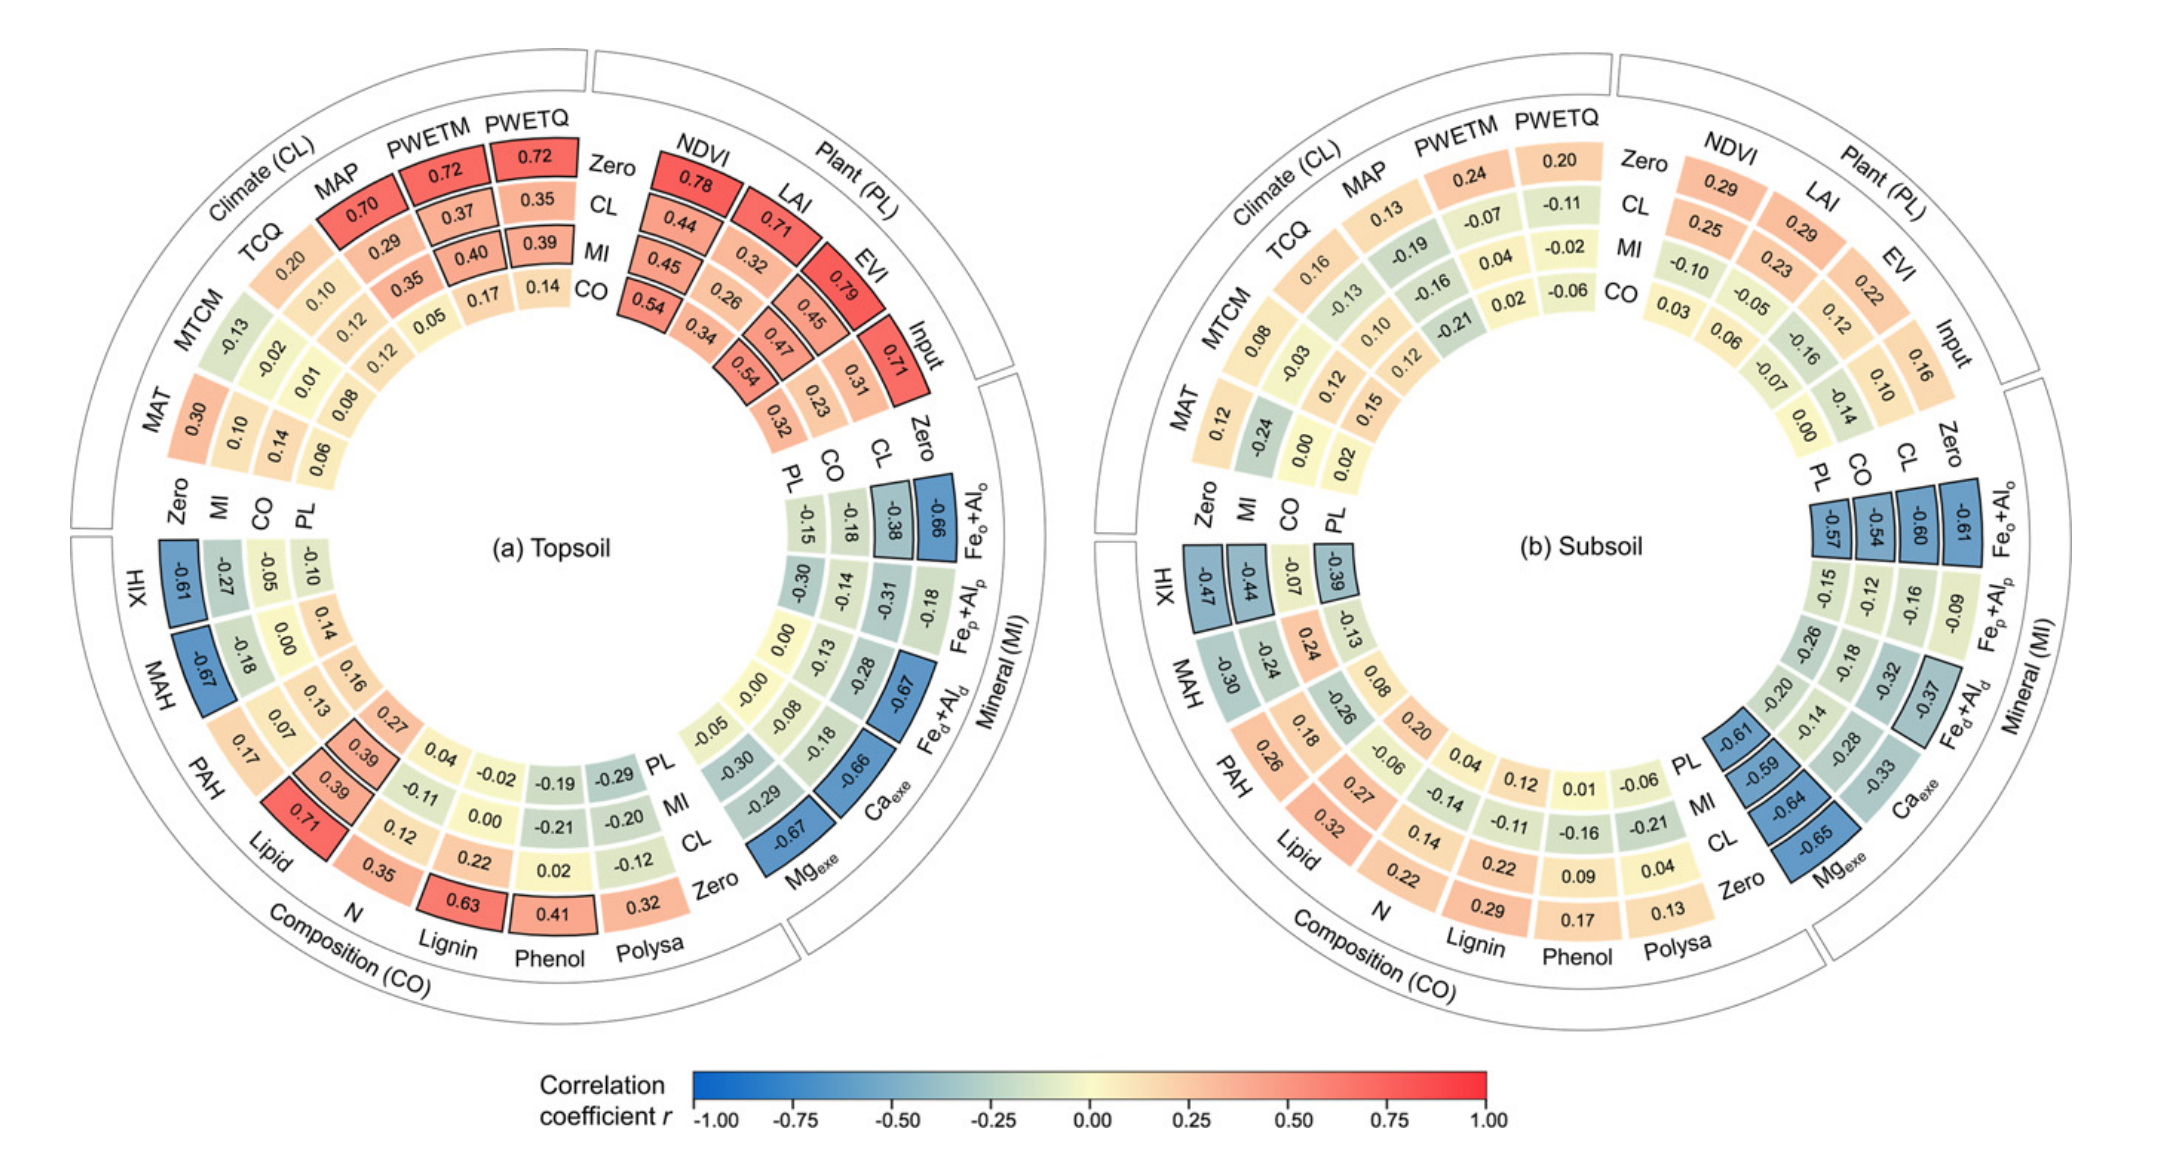
有粉丝问我Ecology Letters, (2021) 24: 1018–1028 Soil carbon persistence governed by plant input and mineral
protection at regional and global scales
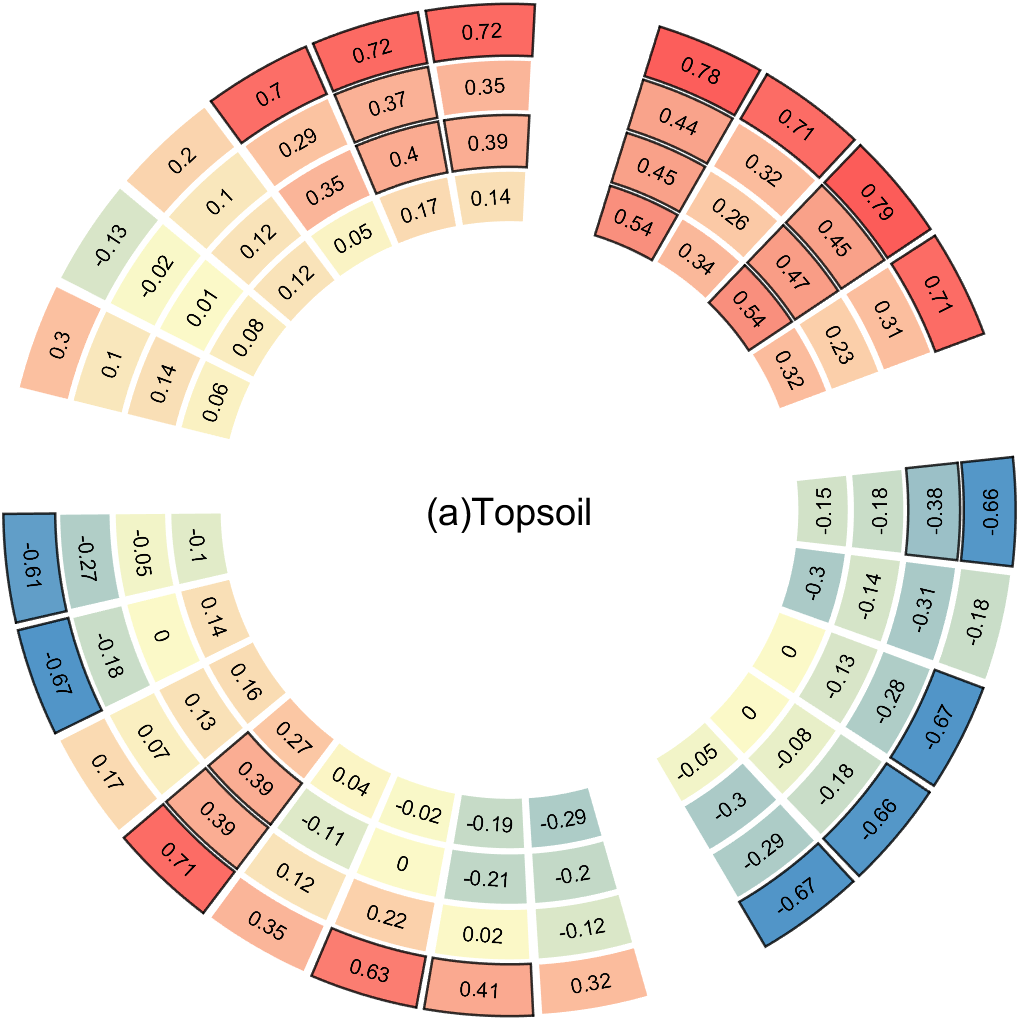
这篇文章中的Figure 2咋画,原图长这样:
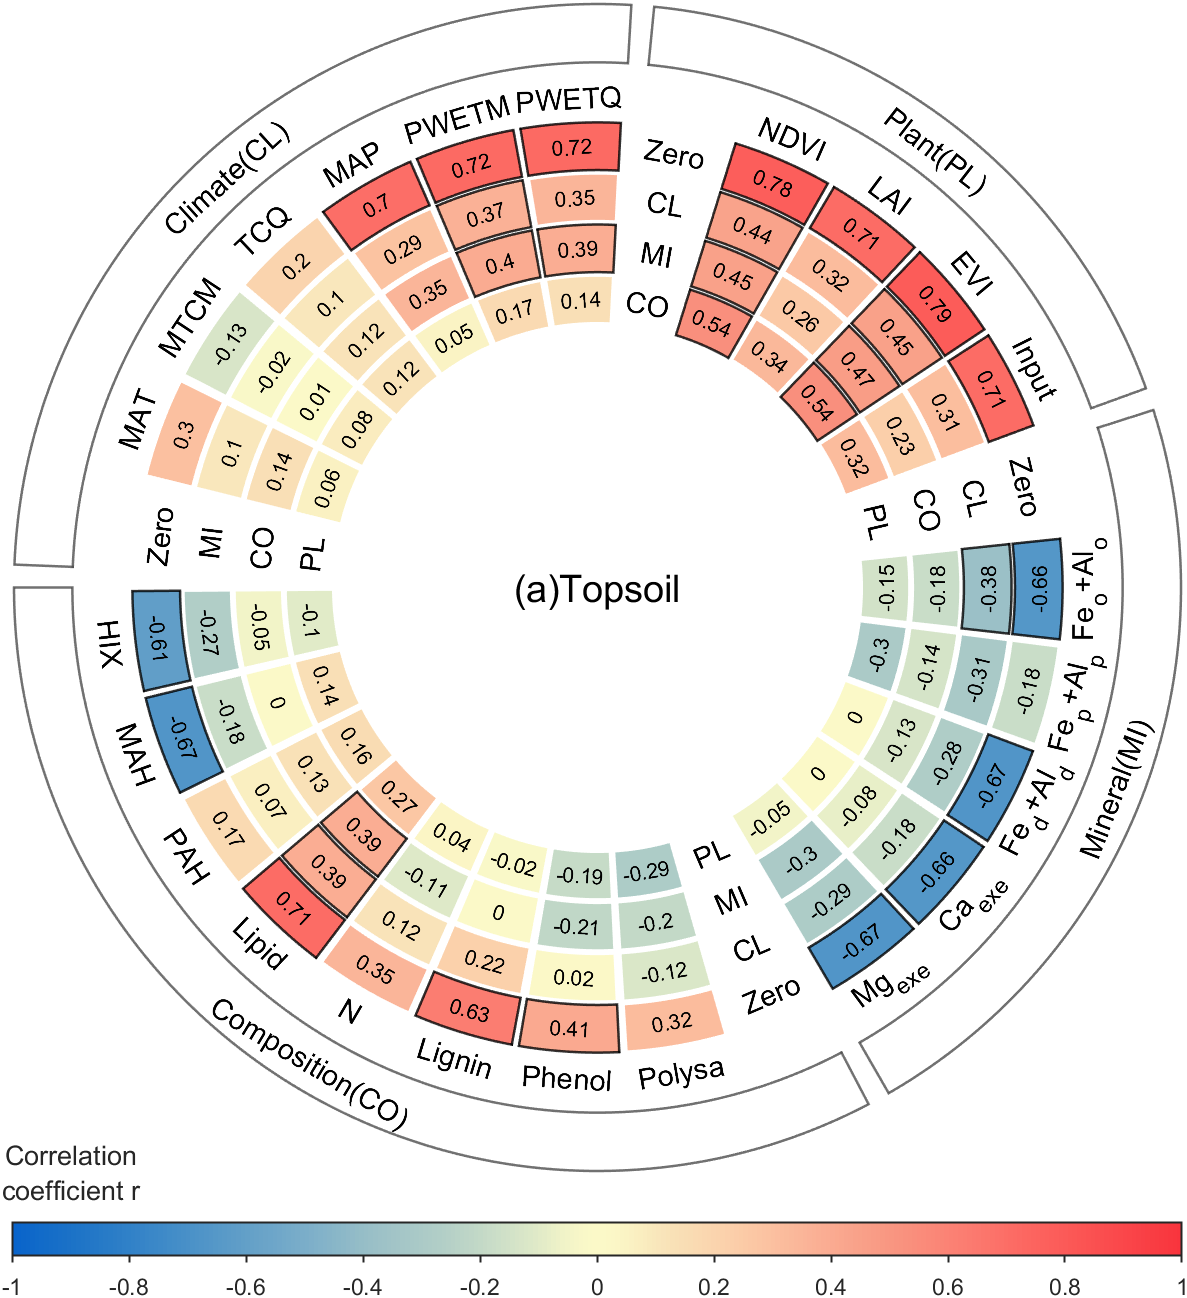
复刻效果:
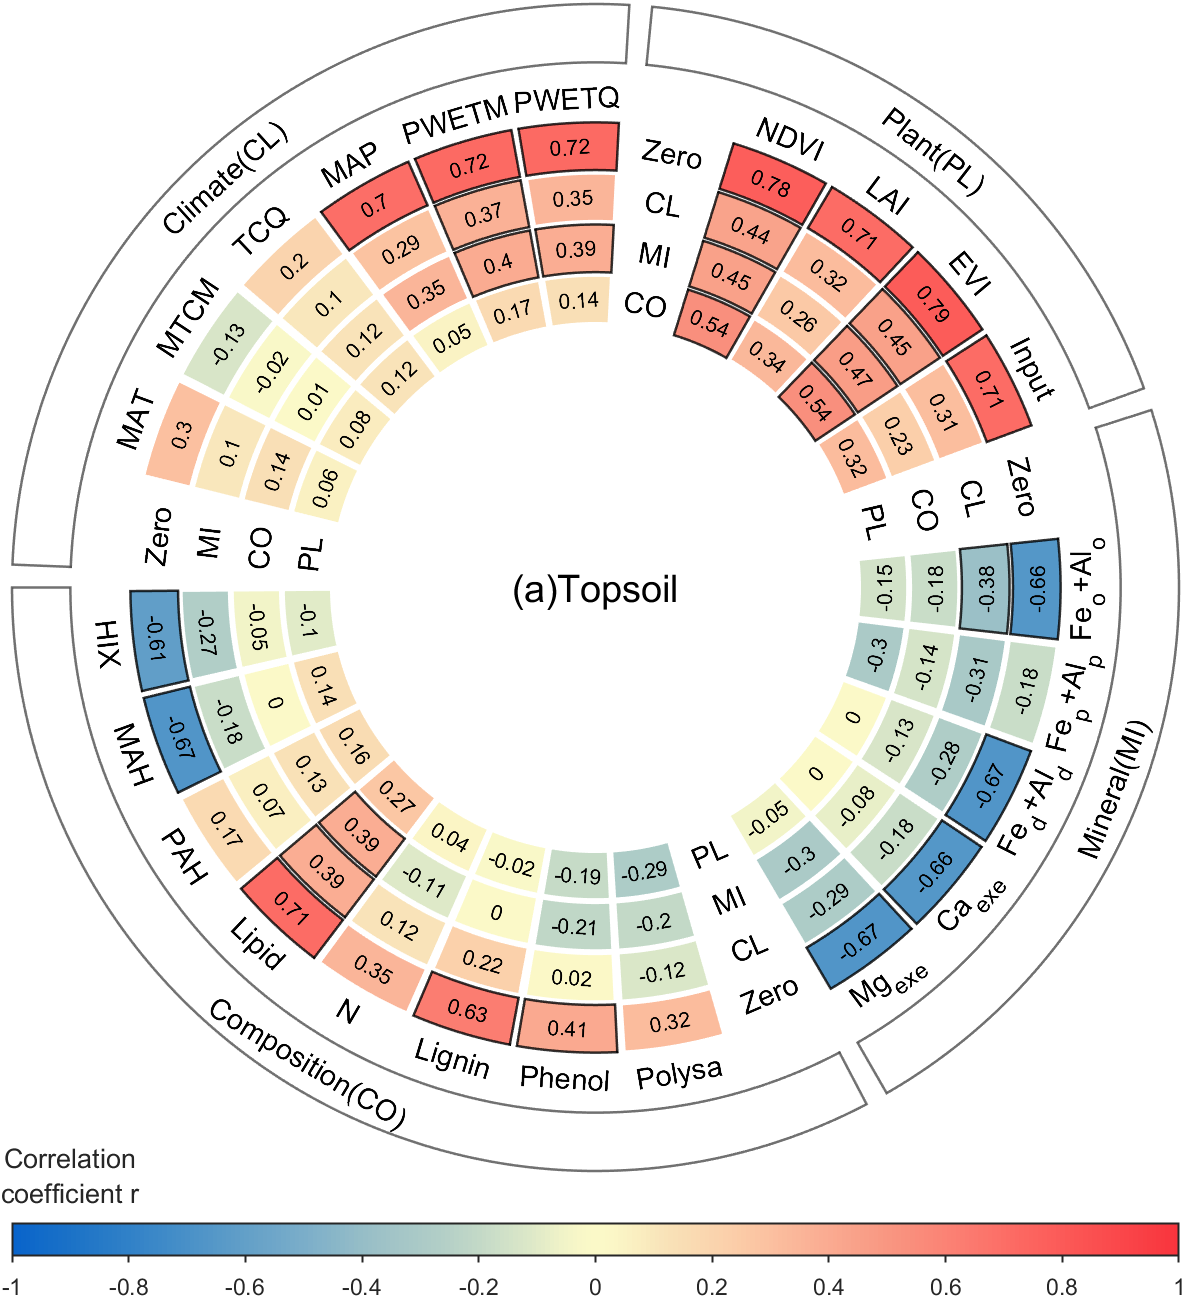
完整步骤
0 数据定义
按理说应该从xlsx中读取数据,但是为了大家不需要下载压缩包直接就能运行,这里直接把数据放在m文件:
clc;clear
Data{1}=[ 0.3    -0.13    0.2     0.7     0.72    0.72
          0.1    -0.02    0.1     0.29    0.37    0.35
          0.14    0.01    0.12    0.35    0.4     0.39
          0.06    0.08    0.12    0.05    0.17    0.14];
Data{2}=[ 0.78    0.71    0.79    0.71
          0.44    0.32    0.45    0.31
          0.45    0.26    0.47    0.23
          0.54    0.34    0.54    0.32];
Data{3}=[-0.66   -0.18   -0.67   -0.66   -0.67
         -0.38   -0.31   -0.28   -0.18   -0.29
         -0.18   -0.14   -0.13   -0.08   -0.3
         -0.15   -0.3     0       0      -0.05];
Data{4}=[ 0.32    0.41    0.63    0.35    0.71    0.17   -0.67   -0.61
         -0.12    0.02    0.22    0.12    0.39    0.07   -0.18   -0.27
         -0.2    -0.21    0      -0.11    0.39    0.13    0      -0.05
         -0.29   -0.19   -0.02    0.04    0.27    0.16    0.14   -0.1];
titleName='(a)Topsoil';
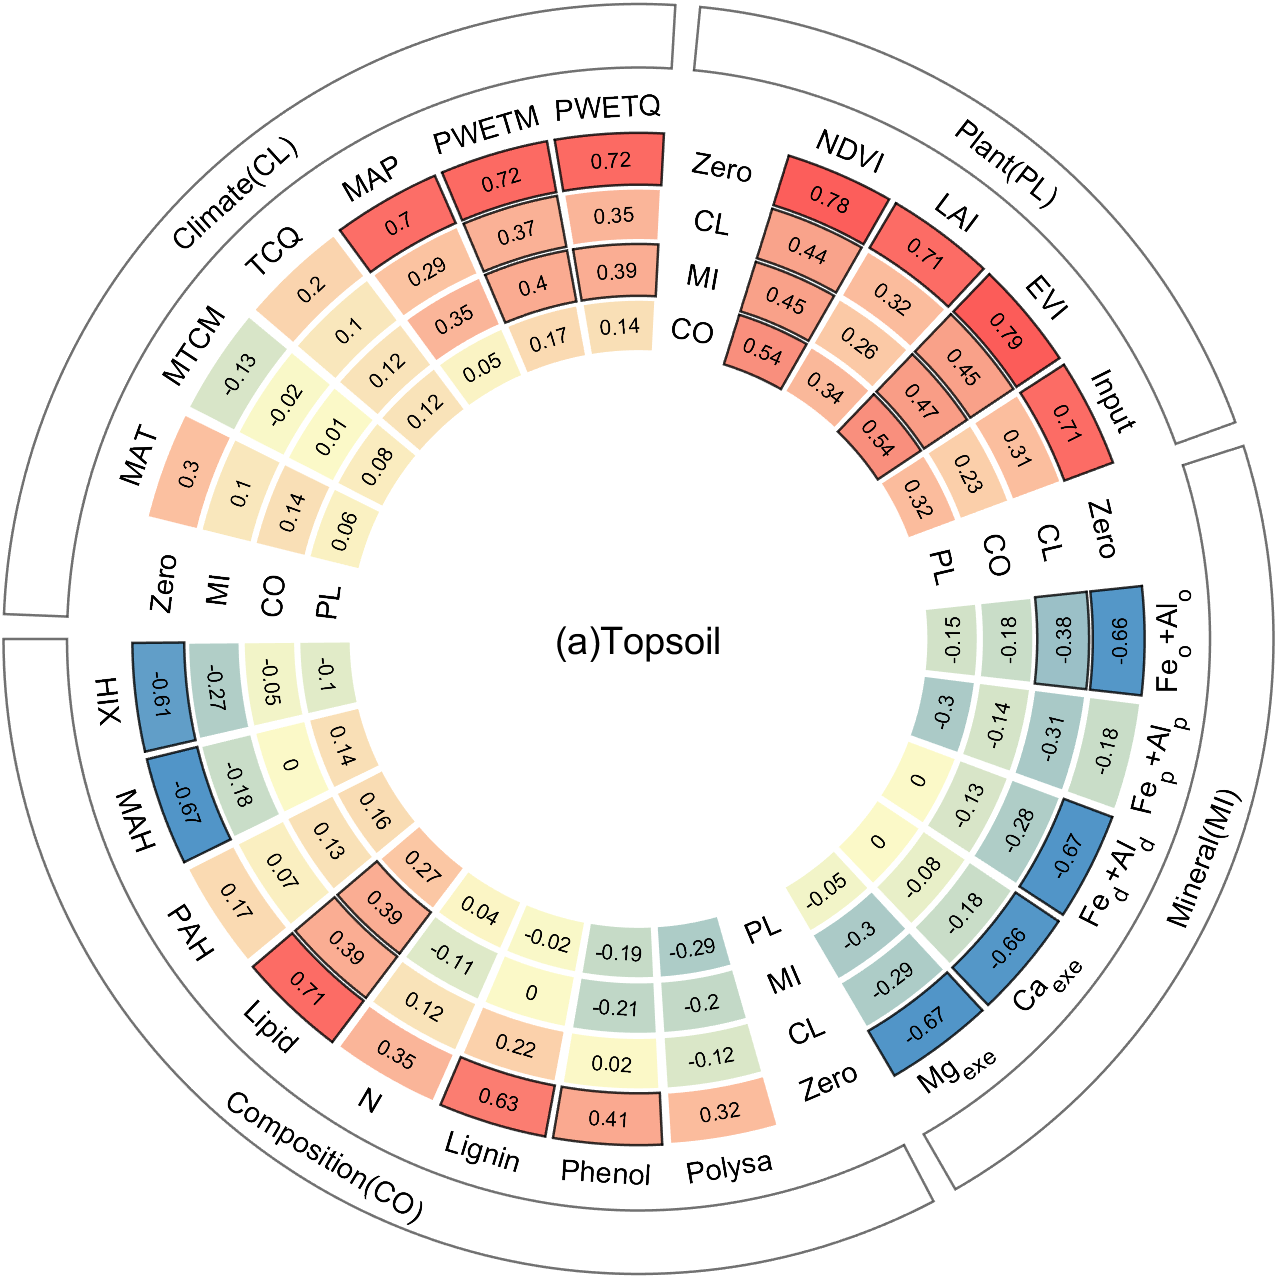
className={'Climate(CL)','Plant(PL)','Mineral(MI)','Composition(CO)'};

varNameRow{1}={'Zero','MI','CO','PL'};
varNameRow{2}={'Zero','CL','MI','CO'};
varNameRow{3}={'Zero','CL','CO','PL'};
varNameRow{4}={'Zero','CL','MI','PL'};

varNameCol{1}={'MAT','MTCM','TCQ','MAP','PWETM','PWETQ'};
varNameCol{2}={'NDVI','LAI','EVI','Input'};
varNameCol{3}={'Fe_{o}+Al_{o}','Fe_{p}+Al_{p}','Fe_{d}+Al_{d}','Ca_{exe}','Mg_{exe}'};
varNameCol{4}={'Polysa','Phenol','Lignin','N','Lipid','PAH','MAH','HIX'};
1 图窗、坐标区域、基础数据定义
颜色数据我直接从colorbar上提取了几个颜色,获取颜色rgb值方式很多,我写过一些文章中有提供颜色提取器,甚至qq,ppt也有颜色提取功能。
同时要求大于0.35和小于-0.35的颜色块用黑框框起来:
% 参数预定义 ===============================================================
% 文本所占比例
sepRatio=15/100;

% 定义配色和颜色范围
CMap=[9,100,203
33,118,199
61,137,200
93,156,200
123,174,201
156,193,199
182,209,199
217,230,200
251,249,200
249,226,184
251,203,167
250,176,149
249,151,130
251,126,114
252,100,95
250,76,78
249,52,61]./255;
% CMap=slanCM(141);
CLim=[-1,1];

% 角度范围
theta1=pi;
theta2=-pi;
% 半径范围
R1=4.5;
R2=8;
R3=9;
R4=10;

% 着重强调值大于0.35或小于-0.35着重强调
thresholdValue=[-.35,.35];

% 计算间隙
ringRatio=zeros(1,length(Data));
for i=1:length(Data)
    ringRatio(i)=size(Data{i},2);
end
txtRatio=sepRatio./length(Data);
ringRatio1=1./sum(ringRatio).*(1-sepRatio);
ringRatio2=ringRatio./sum(ringRatio).*(1-sepRatio);

% 图窗和坐标区域定义
fig=figure('Units','normalized','Position',[0,0,1,1]);
fig.Color=[1,1,1];
ax=axes(fig);hold on
ax.XLim=[-10,10];
ax.YLim=[-10,10];
ax.DataAspectRatio=[1,1,1];
ax.XColor='none';
ax.YColor='none';
2 环形热图绘制
% 绘图部分 =================================================================
% 绘制热图及热图上文字
x=linspace(CLim(1),CLim(2),size(CMap,1))';
y1=CMap(:,1);y2=CMap(:,2);y3=CMap(:,3);
colorFunc=@(X)[interp1(x,y1,X,'pchip'),interp1(x,y2,X,'pchip'),interp1(x,y3,X,'pchip')];
tS=linspace(0,1,50);
for k=1:length(Data)
    theta3=theta1+(theta2-theta1).*(k*txtRatio+sum(ringRatio2(1:(k-1))));
    tData=Data{k};
    for i=1:size(Data{k},1)
        for j=1:size(Data{k},2)
            tT=theta3+[j-1,j].*ringRatio1.*(theta2-theta1);
            tTd=tT(2)-tT(1);
            tT=[tT(1)+tTd/30,tT(2)-tTd/30];
            tR=R2+(R1-R2).*[i-1,i]./size(Data{k},1);
            tRd=tR(2)-tR(1);
            tR=[tR(1)+tRd/30,tR(2)-tRd/30];
            tT=[tT(1)+(tT(2)-tT(1)).*tS,tT(2)+(tT(1)-tT(2)).*tS];
            tR=[tR(1).*ones(1,50),tR(2).*ones(1,50)];
            if tData(i,j)>thresholdValue(2)||tData(i,j)<thresholdValue(1)
                fill(ax,tR.*cos(tT),tR.*sin(tT),colorFunc(tData(i,j)),'EdgeColor',[0,0,0],'LineWidth',1.2,'EdgeAlpha',.8)
            else
                fill(ax,tR.*cos(tT),tR.*sin(tT),colorFunc(tData(i,j)),'EdgeColor',[1,1,1],'LineWidth',1.2)
            end
        end
    end
    for i=1:size(Data{k},1)
        for j=1:size(Data{k},2)
            tT=theta3+[j-1,j].*ringRatio1.*(theta2-theta1);
            tR=R2+(R1-R2).*[i-1,i]./size(Data{k},1);
            tR=mean(tR);
            tT=mean(tT);
            if tT<0&&tT>-pi
                text(ax,tR.*cos(tT),tR.*sin(tT),num2str(tData(i,j)),'Rotation',tT./pi.*180+90,...
                    'Color',[0,0,0],'HorizontalAlignment','center')
            else
                text(ax,tR.*cos(tT),tR.*sin(tT),num2str(tData(i,j)),'Rotation',tT./pi.*180-90,...
                    'Color',[0,0,0],'HorizontalAlignment','center')
            end
        end
    end
end
text(ax,0,0,titleName,'HorizontalAlignment','center','FontSize',18)
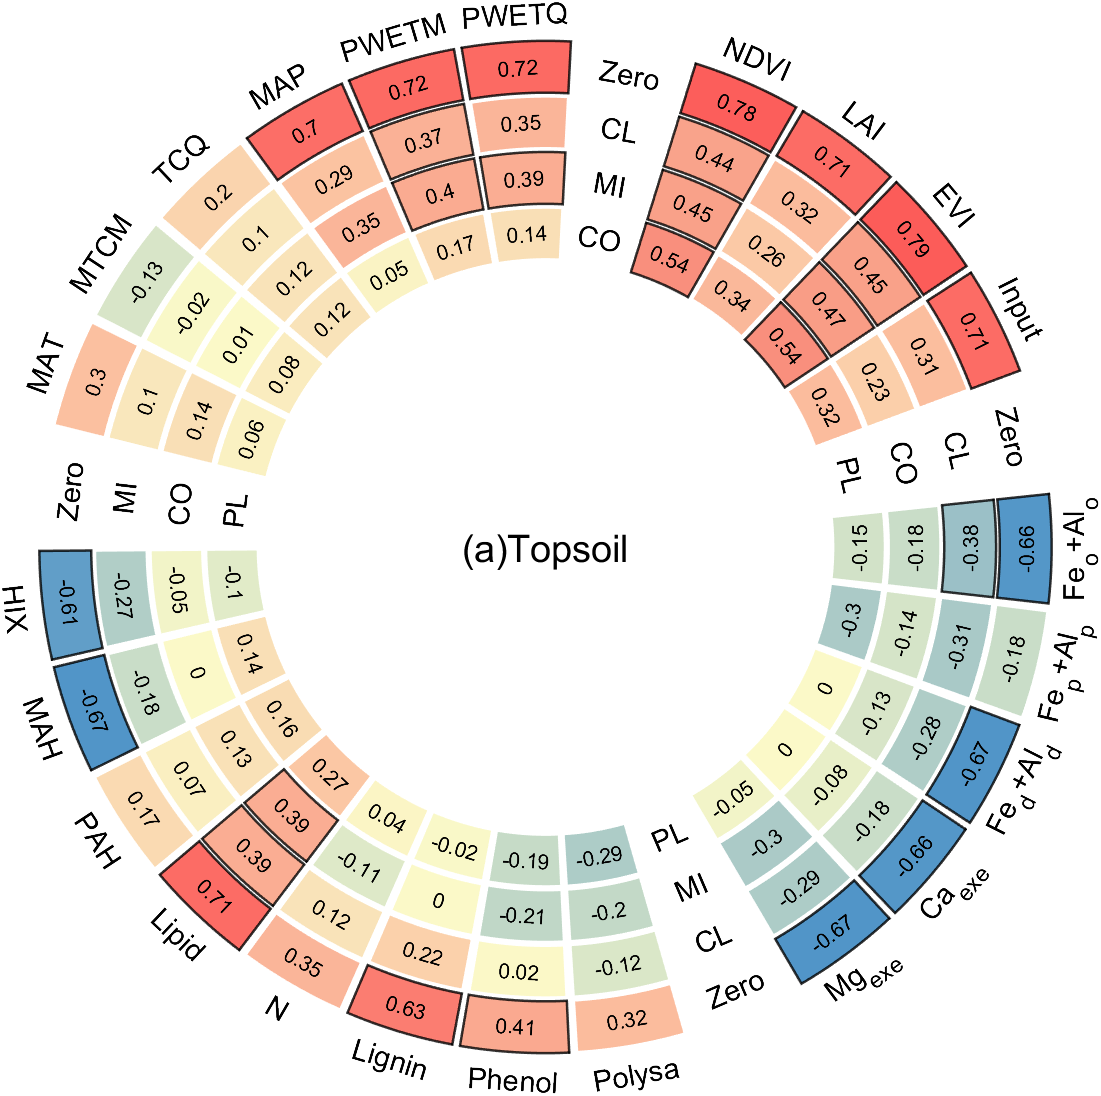
3 添加变量标签
% 绘制标签
% 添加文本1
for k=1:length(Data)
    tT=theta1+(theta2-theta1).*((k-.5)*txtRatio+sum(ringRatio2(1:(k-1))));
    for i=1:size(Data{k},1)
        tR=R2+(R1-R2).*[i-1,i]./size(Data{k},1);
        tR=mean(tR);
        tVarNameRow=varNameRow{k};
        if tT<0&&tT>-pi
            text(ax,tR.*cos(tT),tR.*sin(tT),tVarNameRow{i},'FontSize',14,...
                'Color',[0,0,0],'HorizontalAlignment','center','Rotation',tT./pi.*180+90)
        else
            text(ax,tR.*cos(tT),tR.*sin(tT),tVarNameRow{i},'FontSize',14,...
                'Color',[0,0,0],'HorizontalAlignment','center','Rotation',tT./pi.*180-90)
        end
    end
end
% 添加文本2
for k=1:length(Data)
    theta3=theta1+(theta2-theta1).*(k*txtRatio+sum(ringRatio2(1:(k-1))));
    tR=(R2*3+R3*2)/5;
    tVarNameCol=varNameCol{k};
    for j=1:size(Data{k},2)
        tT=theta3+[j-1,j].*ringRatio1.*(theta2-theta1);
        tT=mean(tT);
        if tT<0&&tT>-pi
            text(ax,tR.*cos(tT),tR.*sin(tT),tVarNameCol{j},'Rotation',tT./pi.*180+90,...
                'Color',[0,0,0],'HorizontalAlignment','center','FontSize',14)
        else
            text(ax,tR.*cos(tT),tR.*sin(tT),tVarNameCol{j},'Rotation',tT./pi.*180-90,...
                'Color',[0,0,0],'HorizontalAlignment','center','FontSize',14)
        end
    end
end
4 添加组标签
% 添加文本3
tS=linspace(0,1,100);
for k=1:length(Data)
    theta3=theta1+(theta2-theta1).*((k-1)*txtRatio+sum(ringRatio2(1:(k-1))));
    theta4=theta1+(theta2-theta1).*(k*txtRatio+sum(ringRatio2(1:k)));
    tT=[theta3,theta4];
    tT=[tT(1)-2*pi/40/length(Data),tT(2)];
    tR=[R3,R4];
    ttT=mean(tT);ttR=mean(tR);
    tT=[tT(1)+(tT(2)-tT(1)).*tS,tT(2)+(tT(1)-tT(2)).*tS];
    tR=[tR(1).*ones(1,100),tR(2).*ones(1,100)];
    fill(ax,tR.*cos(tT),tR.*sin(tT),[1,1,1],'EdgeColor',[.3,.3,.3],'LineWidth',1.2,'EdgeAlpha',.8)
    if ttT<0&&ttT>-pi
        text(ax,ttR.*cos(ttT),ttR.*sin(ttT),className{k},'Rotation',ttT./pi.*180+90,...
            'Color',[0,0,0],'HorizontalAlignment','center','FontSize',14)
    else
        text(ax,ttR.*cos(ttT),ttR.*sin(ttT),className{k},'Rotation',ttT./pi.*180-90,...
            'Color',[0,0,0],'HorizontalAlignment','center','FontSize',14)
    end
end
5 添加colorbar
% colorbar绘制并修饰
colormap(colorFunc(linspace(-1,1,256)'))
clim(CLim)
cb=colorbar();
cb.Location="southoutside";
cb.LineWidth=1;
cb.TickDirection='out';
cb.TickLength=.005;
cb.FontSize=11;
cb.Label.String={'Correlation';'coefficient r'};
cb.Label.Position=[-.9,3.5,0];
cb.Label.FontSize=13;
6 更换配色
大家可能觉得颜色不好看,大家可以尝试下载文末所提到的压缩包,或者下载以下文章中提到的配色包,使用其中的配色让图象变得更好看一点:
https://slandarer.blog.csdn.net/article/details/127719784
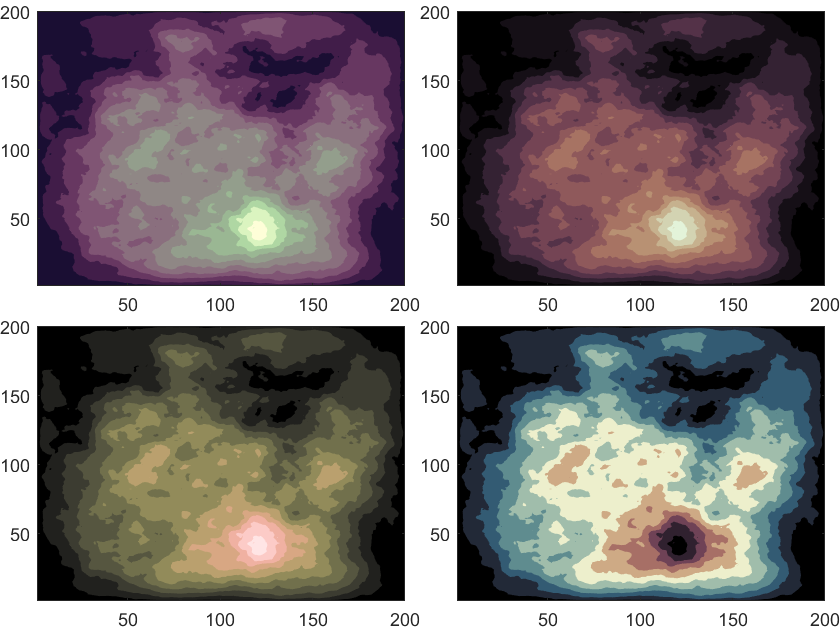
比如将第1部分,基础数据定义配色的代码改为:
% 定义配色和颜色范围
CMap=slanCM(141);
CLim=[-1,1];
141号配色
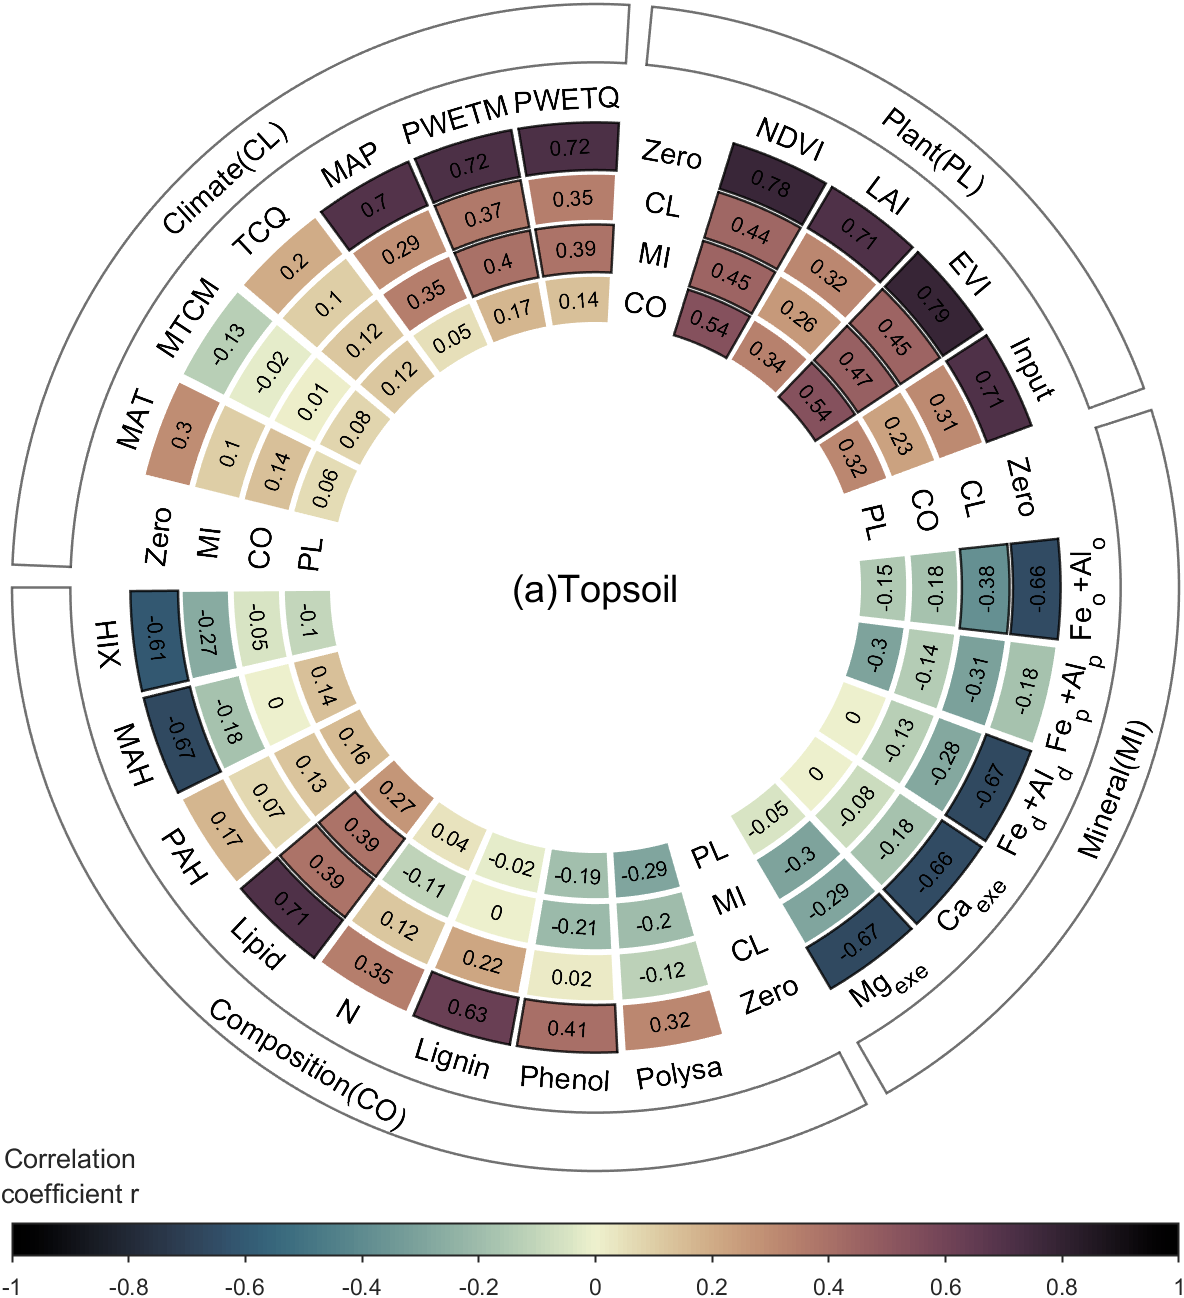
110号配色
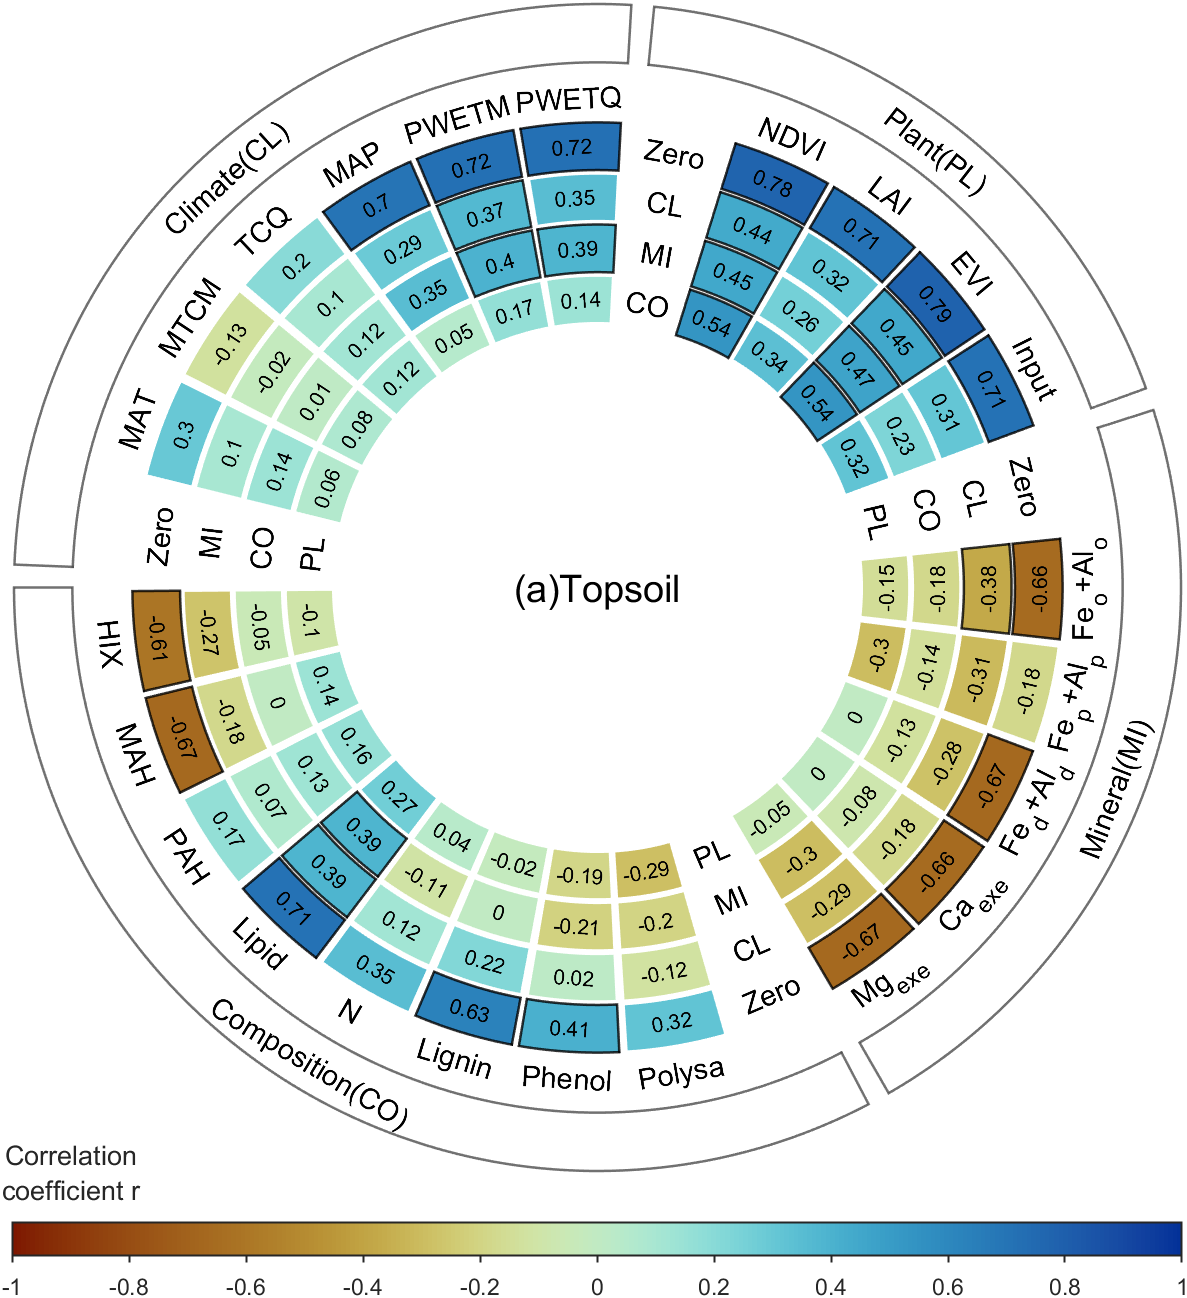
134号配色
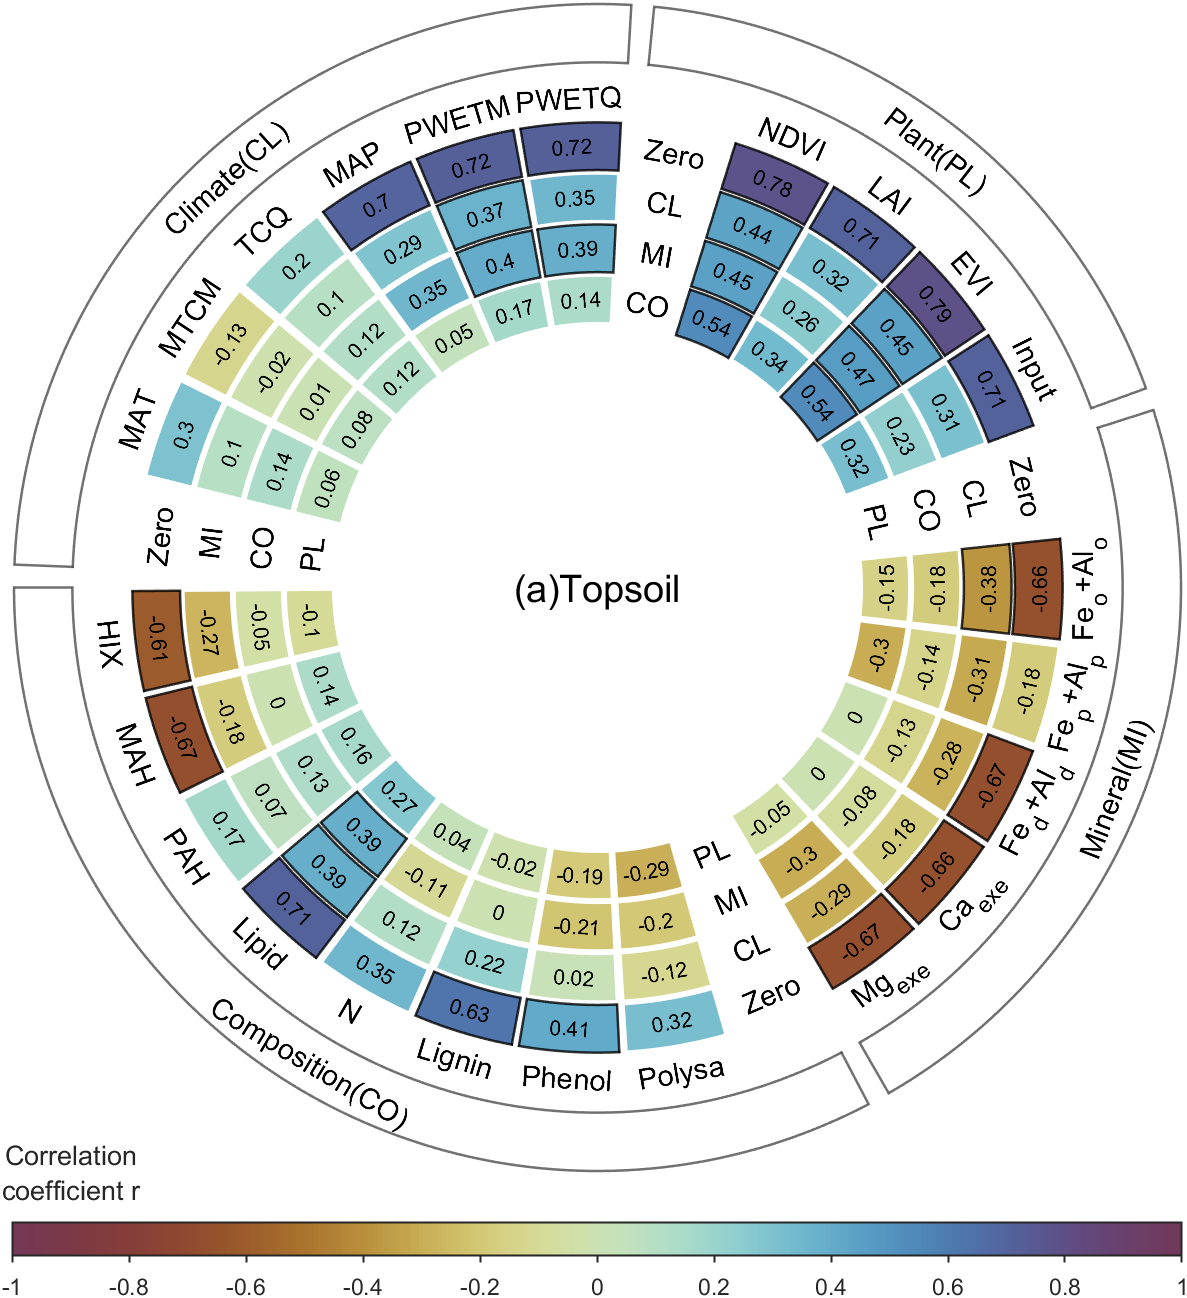
102号配色
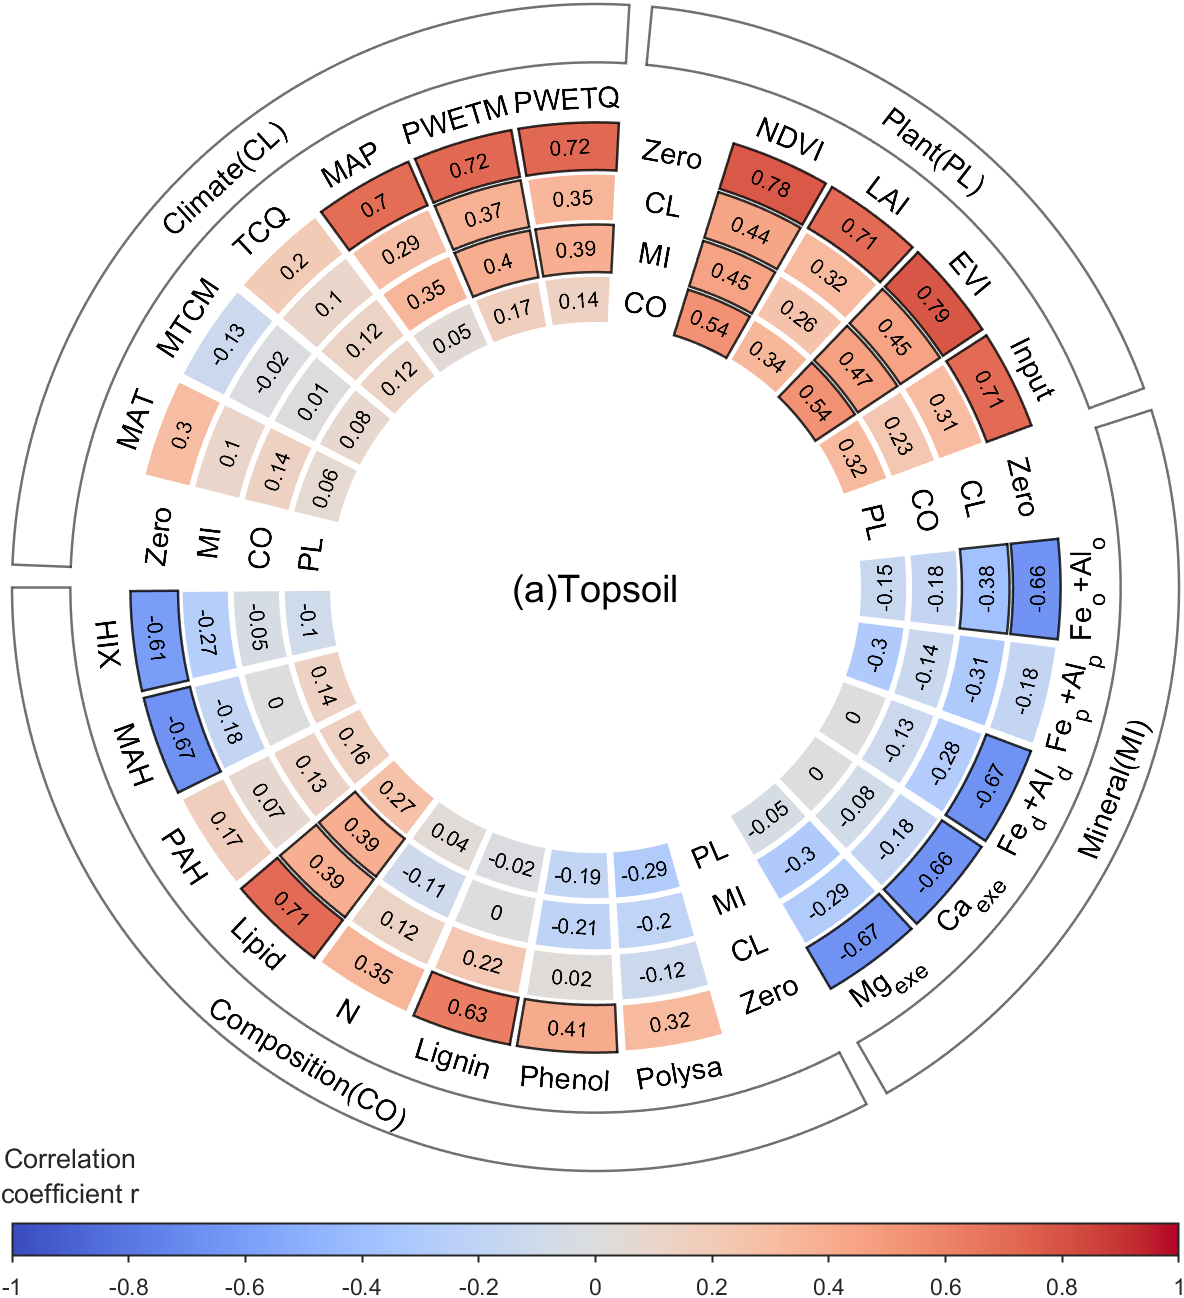
61号配色
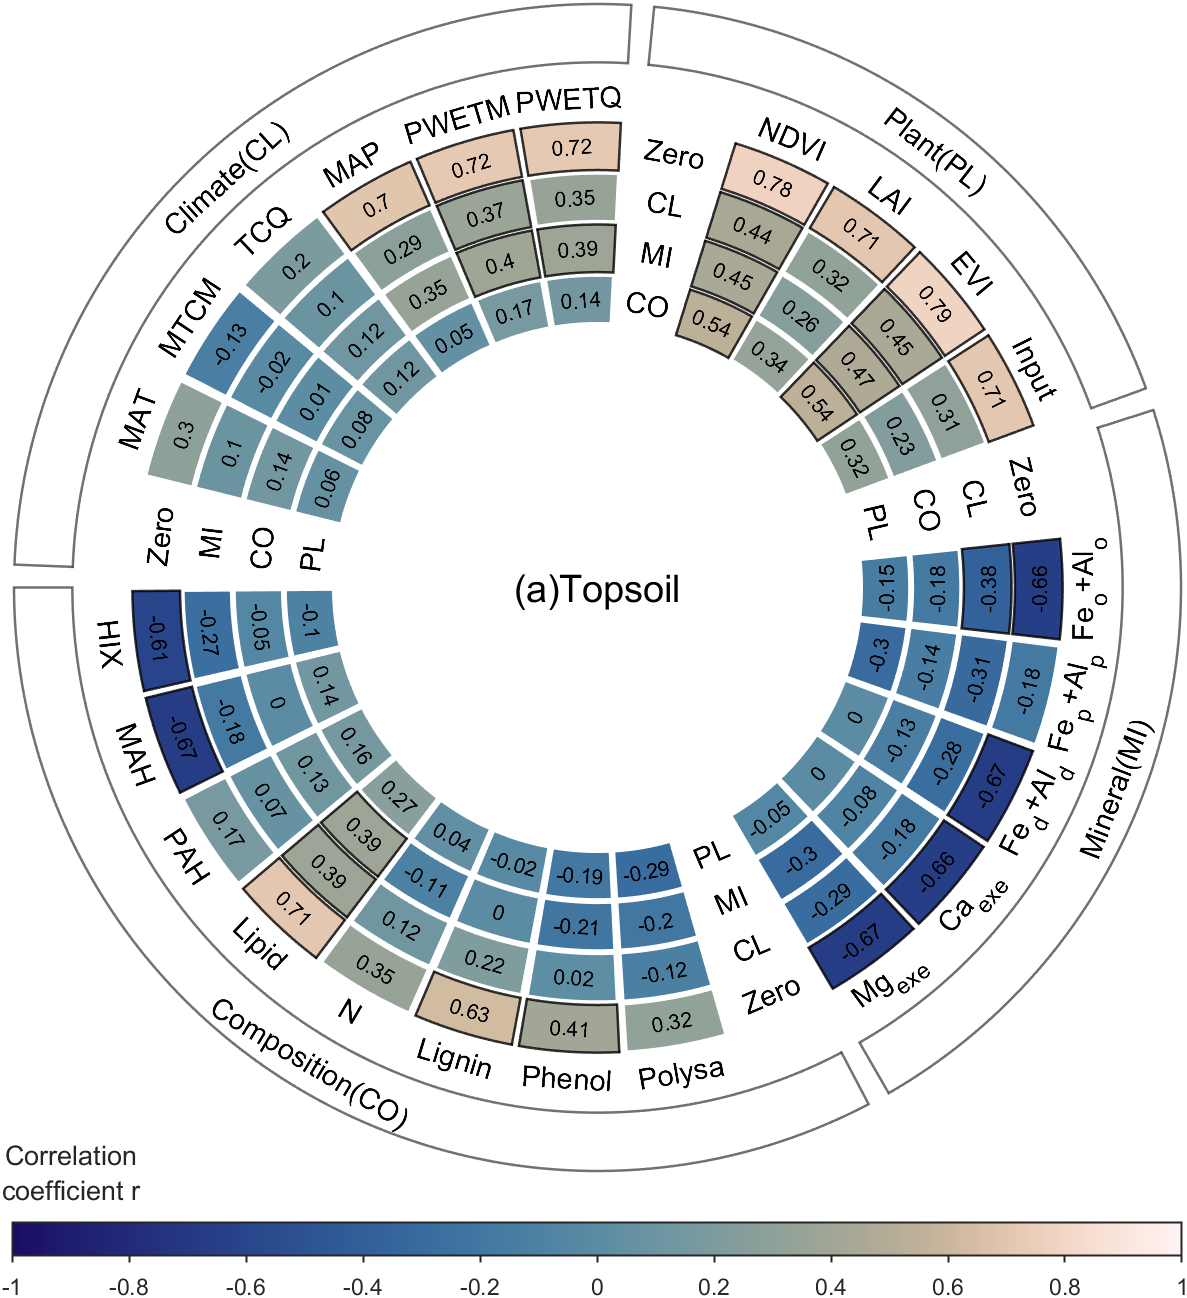
69号配色
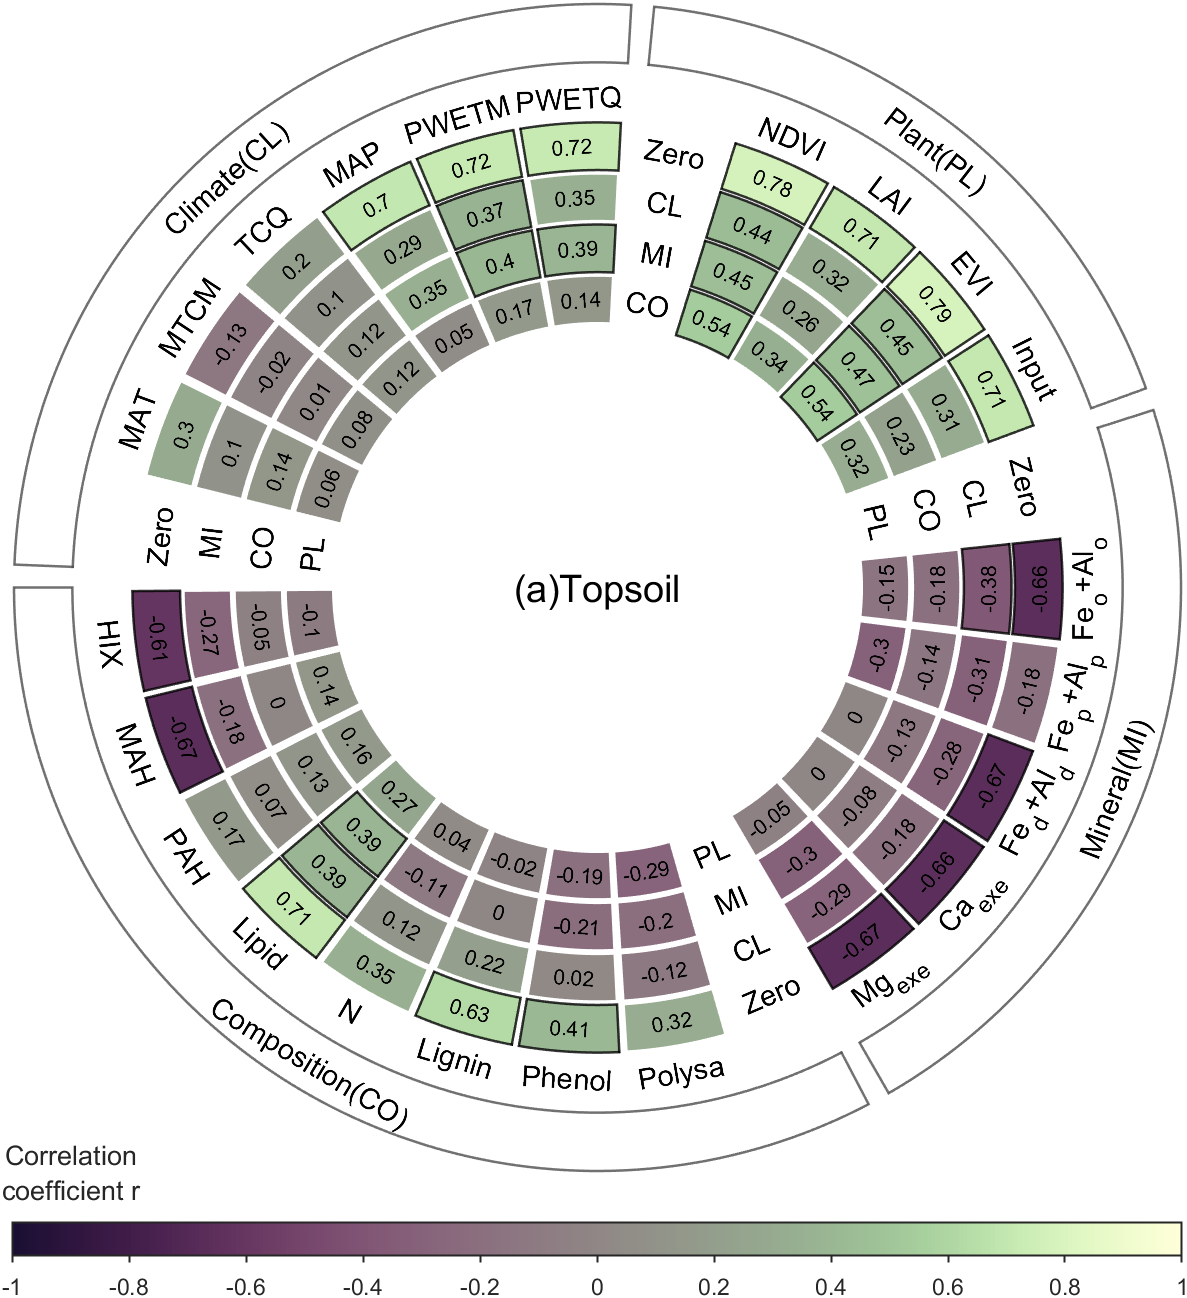
7 完整代码
% @author : slandarer
% gzh  : slandarer随笔

clc;clear
Data{1}=[ 0.3    -0.13    0.2     0.7     0.72    0.72
          0.1    -0.02    0.1     0.29    0.37    0.35
          0.14    0.01    0.12    0.35    0.4     0.39
          0.06    0.08    0.12    0.05    0.17    0.14];
Data{2}=[ 0.78    0.71    0.79    0.71
          0.44    0.32    0.45    0.31
          0.45    0.26    0.47    0.23
          0.54    0.34    0.54    0.32];
Data{3}=[-0.66   -0.18   -0.67   -0.66   -0.67
         -0.38   -0.31   -0.28   -0.18   -0.29
         -0.18   -0.14   -0.13   -0.08   -0.3
         -0.15   -0.3     0       0      -0.05];
Data{4}=[ 0.32    0.41    0.63    0.35    0.71    0.17   -0.67   -0.61
         -0.12    0.02    0.22    0.12    0.39    0.07   -0.18   -0.27
         -0.2    -0.21    0      -0.11    0.39    0.13    0      -0.05
         -0.29   -0.19   -0.02    0.04    0.27    0.16    0.14   -0.1];
titleName='(a)Topsoil';
className={'Climate(CL)','Plant(PL)','Mineral(MI)','Composition(CO)'};

varNameRow{1}={'Zero','MI','CO','PL'};
varNameRow{2}={'Zero','CL','MI','CO'};
varNameRow{3}={'Zero','CL','CO','PL'};
varNameRow{4}={'Zero','CL','MI','PL'};

varNameCol{1}={'MAT','MTCM','TCQ','MAP','PWETM','PWETQ'};
varNameCol{2}={'NDVI','LAI','EVI','Input'};
varNameCol{3}={'Fe_{o}+Al_{o}','Fe_{p}+Al_{p}','Fe_{d}+Al_{d}','Ca_{exe}','Mg_{exe}'};
varNameCol{4}={'Polysa','Phenol','Lignin','N','Lipid','PAH','MAH','HIX'};


% 参数预定义 ===============================================================
% 文本所占比例
sepRatio=15/100;

% 定义配色和颜色范围
CMap=[9,100,203
33,118,199
61,137,200
93,156,200
123,174,201
156,193,199
182,209,199
217,230,200
251,249,200
249,226,184
251,203,167
250,176,149
249,151,130
251,126,114
252,100,95
250,76,78
249,52,61]./255;
% CMap=slanCM(141);
CLim=[-1,1];

% 角度范围
theta1=pi;
theta2=-pi;
% 半径范围
R1=4.5;
R2=8;
R3=9;
R4=10;

% 着重强调值大于0.35或小于-0.35着重强调
thresholdValue=[-.35,.35];

% 计算间隙
ringRatio=zeros(1,length(Data));
for i=1:length(Data)
    ringRatio(i)=size(Data{i},2);
end
txtRatio=sepRatio./length(Data);
ringRatio1=1./sum(ringRatio).*(1-sepRatio);
ringRatio2=ringRatio./sum(ringRatio).*(1-sepRatio);

% 图窗和坐标区域定义
fig=figure('Units','normalized','Position',[0,0,1,1]);
fig.Color=[1,1,1];
ax=axes(fig);hold on
ax.XLim=[-10,10];
ax.YLim=[-10,10];
ax.DataAspectRatio=[1,1,1];
ax.XColor='none';
ax.YColor='none';


% 绘图部分 =================================================================
% 绘制热图及热图上文字
x=linspace(CLim(1),CLim(2),size(CMap,1))';
y1=CMap(:,1);y2=CMap(:,2);y3=CMap(:,3);
colorFunc=@(X)[interp1(x,y1,X,'pchip'),interp1(x,y2,X,'pchip'),interp1(x,y3,X,'pchip')];
tS=linspace(0,1,50);
for k=1:length(Data)
    theta3=theta1+(theta2-theta1).*(k*txtRatio+sum(ringRatio2(1:(k-1))));
    tData=Data{k};
    for i=1:size(Data{k},1)
        for j=1:size(Data{k},2)
            tT=theta3+[j-1,j].*ringRatio1.*(theta2-theta1);
            tTd=tT(2)-tT(1);
            tT=[tT(1)+tTd/30,tT(2)-tTd/30];
            tR=R2+(R1-R2).*[i-1,i]./size(Data{k},1);
            tRd=tR(2)-tR(1);
            tR=[tR(1)+tRd/30,tR(2)-tRd/30];
            tT=[tT(1)+(tT(2)-tT(1)).*tS,tT(2)+(tT(1)-tT(2)).*tS];
            tR=[tR(1).*ones(1,50),tR(2).*ones(1,50)];
            if tData(i,j)>thresholdValue(2)||tData(i,j)<thresholdValue(1)
                fill(ax,tR.*cos(tT),tR.*sin(tT),colorFunc(tData(i,j)),'EdgeColor',[0,0,0],'LineWidth',1.2,'EdgeAlpha',.8)
            else
                fill(ax,tR.*cos(tT),tR.*sin(tT),colorFunc(tData(i,j)),'EdgeColor',[1,1,1],'LineWidth',1.2)
            end
        end
    end
    for i=1:size(Data{k},1)
        for j=1:size(Data{k},2)
            tT=theta3+[j-1,j].*ringRatio1.*(theta2-theta1);
            tR=R2+(R1-R2).*[i-1,i]./size(Data{k},1);
            tR=mean(tR);
            tT=mean(tT);
            if tT<0&&tT>-pi
                text(ax,tR.*cos(tT),tR.*sin(tT),num2str(tData(i,j)),'Rotation',tT./pi.*180+90,...
                    'Color',[0,0,0],'HorizontalAlignment','center')
            else
                text(ax,tR.*cos(tT),tR.*sin(tT),num2str(tData(i,j)),'Rotation',tT./pi.*180-90,...
                    'Color',[0,0,0],'HorizontalAlignment','center')
            end
        end
    end
end
text(ax,0,0,titleName,'HorizontalAlignment','center','FontSize',18)
% -------------------------------------------------------------------------
% 绘制标签
% 添加文本1
for k=1:length(Data)
    tT=theta1+(theta2-theta1).*((k-.5)*txtRatio+sum(ringRatio2(1:(k-1))));
    for i=1:size(Data{k},1)
        tR=R2+(R1-R2).*[i-1,i]./size(Data{k},1);
        tR=mean(tR);
        tVarNameRow=varNameRow{k};
        if tT<0&&tT>-pi
            text(ax,tR.*cos(tT),tR.*sin(tT),tVarNameRow{i},'FontSize',14,...
                'Color',[0,0,0],'HorizontalAlignment','center','Rotation',tT./pi.*180+90)
        else
            text(ax,tR.*cos(tT),tR.*sin(tT),tVarNameRow{i},'FontSize',14,...
                'Color',[0,0,0],'HorizontalAlignment','center','Rotation',tT./pi.*180-90)
        end
    end
end
% 添加文本2
for k=1:length(Data)
    theta3=theta1+(theta2-theta1).*(k*txtRatio+sum(ringRatio2(1:(k-1))));
    tR=(R2*3+R3*2)/5;
    tVarNameCol=varNameCol{k};
    for j=1:size(Data{k},2)
        tT=theta3+[j-1,j].*ringRatio1.*(theta2-theta1);
        tT=mean(tT);
        if tT<0&&tT>-pi
            text(ax,tR.*cos(tT),tR.*sin(tT),tVarNameCol{j},'Rotation',tT./pi.*180+90,...
                'Color',[0,0,0],'HorizontalAlignment','center','FontSize',14)
        else
            text(ax,tR.*cos(tT),tR.*sin(tT),tVarNameCol{j},'Rotation',tT./pi.*180-90,...
                'Color',[0,0,0],'HorizontalAlignment','center','FontSize',14)
        end
    end
end
% 添加文本3
tS=linspace(0,1,100);
for k=1:length(Data)
    theta3=theta1+(theta2-theta1).*((k-1)*txtRatio+sum(ringRatio2(1:(k-1))));
    theta4=theta1+(theta2-theta1).*(k*txtRatio+sum(ringRatio2(1:k)));
    tT=[theta3,theta4];
    tT=[tT(1)-2*pi/40/length(Data),tT(2)];
    tR=[R3,R4];
    ttT=mean(tT);ttR=mean(tR);
    tT=[tT(1)+(tT(2)-tT(1)).*tS,tT(2)+(tT(1)-tT(2)).*tS];
    tR=[tR(1).*ones(1,100),tR(2).*ones(1,100)];
    fill(ax,tR.*cos(tT),tR.*sin(tT),[1,1,1],'EdgeColor',[.3,.3,.3],'LineWidth',1.2,'EdgeAlpha',.8)
    if ttT<0&&ttT>-pi
        text(ax,ttR.*cos(ttT),ttR.*sin(ttT),className{k},'Rotation',ttT./pi.*180+90,...
            'Color',[0,0,0],'HorizontalAlignment','center','FontSize',14)
    else
        text(ax,ttR.*cos(ttT),ttR.*sin(ttT),className{k},'Rotation',ttT./pi.*180-90,...
            'Color',[0,0,0],'HorizontalAlignment','center','FontSize',14)
    end
end
% -------------------------------------------------------------------------
% colorbar绘制并修饰
colormap(colorFunc(linspace(-1,1,256)'))
clim(CLim)
cb=colorbar();
cb.Location="southoutside";
cb.LineWidth=1;
cb.TickDirection='out';
cb.TickLength=.005;
cb.FontSize=11;
cb.Label.String={'Correlation';'coefficient r'};
cb.Label.Position=[-.9,3.5,0];
cb.Label.FontSize=13;
完
完整代码
链接:
https://pan.baidu.com/s/1mmr5bTA_jnMwJjiisjNQ3A?pwd=slan
提取码:slan


