目录
1 matplotlib的基本用法
1.1 需要用到的模块,需要实现安装,且导入
1.2 画布 figure
1.2.1 figure的官方解释
1.2.2 画布语法
1.2.3 必须先获取至少1个figure:
1.2.4 figure的生效范围与多个figure
1.2.5 可以设置多个画布
1.3 设置函数图形
1.4 画图
1.5 显示图像
2 用matplotlib 画函数图形
2.1 在一个画布里画多个图形
(1张画布,1个坐标轴系,多个图形叠在一起)
2.2 在多个画布里,分别画1个图形
(多张画布,多个坐标轴系,分别包含1个图形)
2.3 一个画布里作图多个子图,且按表格排列好
(多张画布,多个坐标轴系,分别包含1个图形,且按内部序号排列)
2.3.1 用plt.subplot()方式绘制多子图
3 关于坐标轴的各种设置
3.1 坐标轴的描述
3.2 坐标轴范围设置
3.3 坐标轴的刻度设置
4 其他图像设置
4.1 设置图形标题
4.2 图片的图例
4.3 显示网格
5 移动坐标轴
5.1 代码
5.2 一个警告,不是报错
5.3 图片的4边,都是spine
5.4 # 隐藏右边、上边的spine
5.5 # 移动两个spine到0,0,达到把坐标轴移动的目的
6 比如 散点图 sactter
1 matplotlib的基本用法
1.1 需要用到的模块,需要实现安装,且导入
1.1.1 导入 import matplotlib.pyplot
import numpy as np
import matplotlib.pyplot as plt
- 注意,虽然常用的画图模块是 matplotlib
- 但是实际上大家常用的 plt 是指 matplotlib.pyplot 这个子模块
- 错误写法 import matplotlib as plt 会造成报错 TypeError: 'module' object is not callable
1.1.2 matplotlib 词源
matplotlib 推测词源
- mat:matrix 矩阵,向量组,2维数组等,甚至于 张量tensor
- plot:绘制
- lib: library 库
1.2 figure 画图容器/ 画布
1.2.1 figure的官方解释
figure是一顶级的容器,包含了绘图所有的元素。我把这个理解为画布
- 1.the Figure, which contains all the plot elements.
- 2.The top level container for all the plot elements.
1.2.2 画布语法
画布语法:fig1=plt.figure(num,figsize)
- fig1=plt.figure(num=1,figsize=(3,3))
- fig2=plt.figure()
- num=1 编号,实测可省略
- figsize=(3,3) 画布大小,实测可省略,有默认值
1.2.3 必须先获取至少1个figure:
- 需要画图形和现实图形,首先必须需要获取figure才可以
- fig=plt.figure()
- 获取figure的方式是:fig = plt.figure()。
1.2.4 多个figure存在时,figure的生效范围
- 同一段代码可能会存在多个 figure
- 一个figure到下一个figure语句前之间的区域,属于该figure的作图管辖范围;
- 而如果没有下一个figure时,则到plt.show()之间的区域,属于该figure的作图管辖范围。
- 在一个figure的作图管辖范围的图像都会展示在同一个figure绘画弹框中。
1.2.5 因为可以一段代码里存在多个plt.figure(),因此可以设置多个画布
- 如果需要图像在多个不同的figure弹框中展示,则需要获取多个figure才可以
- 获取figure的方式是:fig = plt.figure()
- 设置多个画布的时候以创建 plt.figure() 为分界
1.3 设置函数图形
设置函数的关键:
函数就是形如 y=f(x)的样式,但是函数的作图需要具体的数据。
- 1 自变量:一组自变量的数,方便作图。如果只是纯粹的函数形式当然抽象的X就够了。
- 2 因变量:y=f(x) 函数的表达式即可,因为因变量可计算出来
- 自变量:x=np.linspace(-5,5, 10)
- 因变量:y=x*2+1
1.4 画图/绘图 plt.plot()
- plt.plot(x, y)
- plt.plot(x对应自变量:一般对应X轴, y对应因变量:一般对应y轴)
- # 绘图
- plt.plot(x, y, color="#ff0000",label="xxx")
1.5 显示图像
- # 显示图像
matplotlib作图,要显示图像,必须调用plt.show(), 否则不显示- plt.show()
2 用matplotlib 画函数图形
2.1 在一个画布里画多个图形
(1张画布,1个坐标轴系,多个图形叠在一起)
import numpy as np
import matplotlib.pyplot as plt

fig1=plt.figure(num=1)

x=np.linspace(-5,5, 10)
y=x*2+1
y2=x**2

# 绘图
plt.plot(x, y)
plt.plot(x, y2)

# 显示图像
plt.show()
2.2 在多个画布里,分别画1个图形
(多张画布,多个坐标轴系,分别包含1个图形)
import numpy as np
import matplotlib.pyplot as plt

x=np.linspace(-5,5, 10)

fig1=plt.figure(num=1,figsize=(3,3))
y=x*2+1
# 绘图
plt.plot(x, y)

#新开一个画布
fig2=plt.figure(num=2,figsize=(5, 5))
y2=x**2
# 绘图
plt.plot(x, y2)

# 显示图像
plt.show()
2.3 一个画布里作图多个子图,且按表格排列好
(多张画布,多个坐标轴系,分别包含1个图形,且按内部序号排列)
2.3.1 用plt.subplot()方式绘制多子图
plt.subplot()方式绘制多子图,只需要传入简单几个参数即可:plt.subplot(rows, columns, current_subplot_index)- 形如
plt.subplot(2, 2, 1),其中:
rows表示最终子图的行数;columns表示最终子图的列数;current_subplot_index表示当前子图的索引;- 这几个参数是可以连写在一起的,同样可以被识别
- 例如:上面的
plt.subplot(2, 2, 1),写成plt.subplot(221),两者是等价的。
import numpy as np
import matplotlib.pyplot as plt

# 子图1,散点图
plt.subplot(2, 2, 1)
plt.scatter(np.linspace(-2, 2, 5), np.random.randn(5))

# 子图2,折线图+网格
plt.subplot(2, 2, 2)
plt.plot(np.linspace(-2, 2, 5), np.random.randn(5))
plt.grid(True)

# 子图3,柱状图
plt.subplot(2, 2, 3)
x = np.linspace(0, 5, 5)
plt.bar(x, np.random.random(5))
plt.xticks(np.arange(0, 6))

# 子图4,饼图
plt.subplot(2, 2, 4)
plt.pie(np.random.random(5), labels=list("ABCDE"))

plt.show()
3 关于坐标轴的各种设置
- 坐标轴描述
- 坐标轴范围设置
- 坐标轴刻度
- 挪动坐标轴
3.1 坐标轴的描述
- plt.xlabel("X axis")
- plt.ylabel("Y axis")
3.2 坐标轴范围设置
- plt.xlim((-10,10))
- plt.ylim((-10,10))
3.3 坐标轴的刻度设置
- # 设置坐标轴刻度
- plt.xticks([-4, -2, 0, 2, 4])
- plt.yticks(np.linspace(-10, 10, 10))
- # 这样可以清除刻度
- plt.xticks()
- plt.yticks()
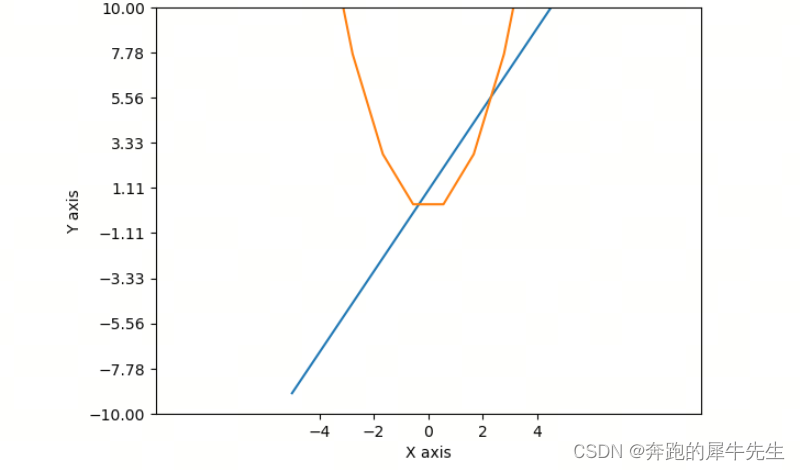
import numpy as np
import matplotlib.pyplot as plt

fig1=plt.figure(num=1)

x=np.linspace(-5,5, 10)
y=x*2+1
y2=x**2

# 设置坐标轴描述
plt.xlabel("X axis")
plt.ylabel("Y axis")

# 设置坐标轴范围
plt.xlim((-10,10))
plt.ylim((-10,10))

# 设置坐标轴刻度
plt.xticks([-4, -2, 0, 2, 4])
plt.yticks(np.linspace(-10, 10, 10))
# 这样可以清除刻度 plt.xticks()
# 这样可以清除刻度 plt.yticks()

# 绘图
plt.plot(x, y)
plt.plot(x, y2)

# 显示图像
plt.show()
4 其他图像设置
4.1 设置图形标题
plt.title("here is title")
4.2 图片的图例
- # 显示图例
- plt.legend()
- # 显示图例
- plt.legend(labels=[xx_label, x_label])
4.3 显示网格
# 显示网格
plt.grid(True)
5 移动坐标轴
5.1 代码
import numpy as np
import matplotlib.pyplot as plt

# 移动坐标轴

figure = plt.figure(num=100)

# x,y
x = np.linspace(-4, 4, 50)
y = x ** 2 - 4

# 获取到坐标轴
ax = plt.gca()

# 隐藏右边、上边的spine
ax.spines["right"].set_color("none")
ax.spines["top"].set_color("none")

# 移动两个spine到0,0,达到把坐标轴移动的目的
ax.spines["bottom"].set_position(("data", 0))
ax.spines["left"].set_position(("data", 0))

xx_label = r"y = x ^ 2 - 4"
x_label = r"y = x"
plt.title("here is title")

# 绘图
plt.plot(x, y, color="#ff0000",label="xxx")

# 显示图例
plt.legend()

plt.plot(x, x)

# 显示网格
plt.grid(True)

# 显示图例
plt.legend(labels=[xx_label, x_label])

plt.show()
5.2 一个警告,不是报错
No artists with labels found to put in legend. Note that artists whose label
- # 绘图
- plt.plot(x, y, color="#ff0000")
- plt.plot(x, y, color="#ff0000",label="xxx") #没有这个就会警告 label="xxx"
- # 显示图例
- plt.legend(labels=[xx_label, x_label])
#legend相关代码中缺乏label名称的说明,需要给予图例对应的名字
plt.legend(loc=4, bbox_to_anchor=(1.15, -0.07))#原代码报错并不显示图例
plt.legend(loc=4, bbox_to_anchor=(1.15, -0.07),labels=['频次']) # 调整后不报错并显示图例
# 添加图例
plt.legend()
# 添加图例
plt.legend(labels=['频次'])
5.3 图片的4边,都是spine
图片的4边,都是spine
可以分别操作这4个spine
5.4 # 隐藏右边、上边的spine
# 隐藏右边、上边的spine
ax.spines["right"].set_color("none")
ax.spines["top"].set_color("none")
5.5 # 移动两个spine到0,0,达到把坐标轴移动的目的
# 移动两个spine到0,0,达到把坐标轴移动的目的
ax.spines["bottom"].set_position(("data", 0))
ax.spines["left"].set_position(("data", 0))
6 比如 散点图 sactter
import numpy as np
import matplotlib.pyplot as plt

# 散点图
# x, y
x = np.random.normal(0, 1, 20)
y = np.random.normal(0, 1, 20)

# 绘制散点图
plt.scatter(x, y, s=25, alpha=0.75)

plt.xlabel("X")
plt.ylabel("Y")

# 显示图像
plt.show()
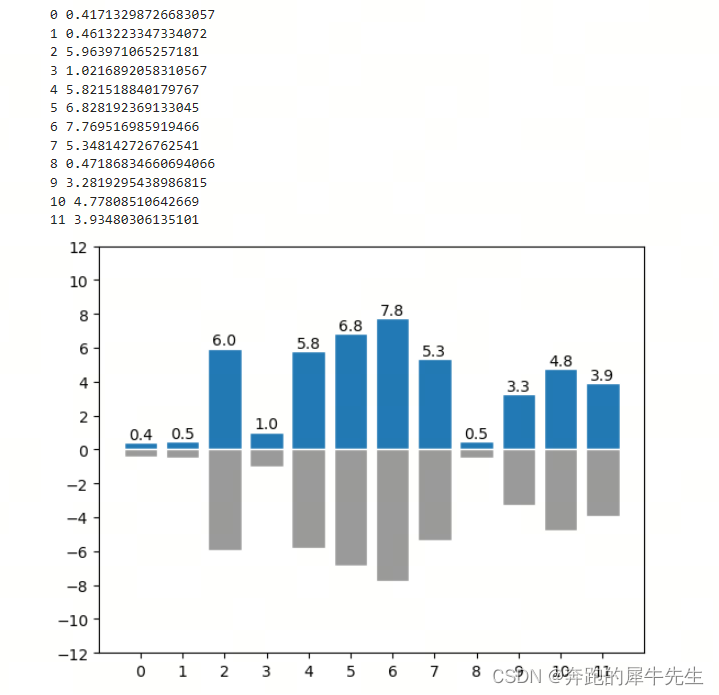
7 直方图
import numpy as np
import matplotlib.pyplot as plt


# 直方图

# x, y
size = 12
x = np.arange(size)
y = np.random.uniform(0, 1, size) * 10

# 直方图
plt.bar(x, y, edgecolor="white")
plt.bar(x, -y, facecolor="#999999", edgecolor="white")

# 设置坐标
plt.xticks(x)
plt.yticks(np.linspace(-12, 12, 13))

# 显示数值
for (X, Y) in zip(x, y):
    plt.text(x=X, y=Y+0.2, s="%.1f" % Y, ha="center")
    print(X, Y)

# 显示图像
plt.show()