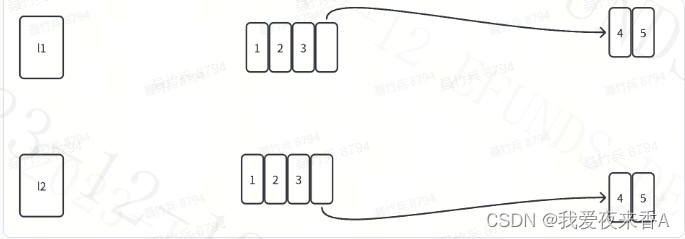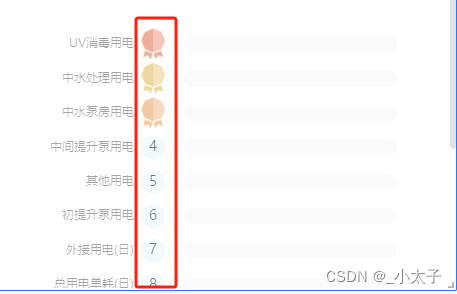
如图Y轴有文字和图片,1-3的图片不同,后面的是特定的css 样式;实现代码
yAxis: {
          type: 'category',
          inverse: true,
          boundaryGap: false,
          axisTick: { show: false }, // 是否展示标记点
          axisLine: { show: false },
          axisLabel: {
            // 坐标轴的标签
            // formatter: '{value}',
            show: true, // 是否显示
            inside: false, // 是否朝内
            rotate: 0, // 旋转角度
            margin: 18, // 刻度标签与轴线之间的距离
            color: 'rgba(0,0,0,0.65)', // 默认轴线的颜色
            rich: {
              a1: {
                backgroundColor: {
                  image: require('./1.png')
                },
                width: 24,
                height: 31
              },
              a2: {
                backgroundColor: {
                  image: require('./2.png')
                },
                width: 24,
                height: 31
              },
              a3: {
                backgroundColor: {
                  image: require('./3.png')
                },
                width: 24,
                height: 31
              },
              b: {
                color: '#fff',
                backgroundColor: 'rgba(231, 244, 252, 1)',
                width: 24,
                height: 24,
                align: 'center',
                borderRadius: 50,
                fontSize: 14,
                fontWeight: 500,
                color: 'rgba(10, 14, 19, 1)',
                padding: [0, 0, 0, 0]
              }
            },
            formatter: (params) => {
              const aIndex = _.findIndex(data2, (item) => {
                return item.name === params
              })
              if (aIndex === 0) {
                return [params + '  ' + '{a1' + '|}']
              } else if (aIndex === 1) {
                return [params + '  ' + '{a2' + '|}']
              } else if (aIndex === 2) {
                return [params + '  ' + '{a3' + '|}']
              } else {
                return [params + '  ' + '{b|' + (aIndex + 1) + '}']
              }
            }
          },
          data: yAxis
        },
