微博情感分析是一种用于提取微博文本中的情感倾向的方法。它可以帮助企业了解人们对于某个主题的看法和态度。
如果要进行微博情感分析,需要准备一些微博数据。可以使用爬虫程序爬取相关微博数据,这里使用的 Scrapy 框架进行的数据爬虫。可以使用文本分类模型对微博数据进行情感分类。在这里准备了一些情感标签(例如“正面”、“负面”、“中立”),并为每条微博打上标签。
此外,可以使用自然语言处理技术来提取微博中的关键词和主题,以便更好地了解人们关注的焦点。总的来说微博情感分析是一种有用的工具,可以帮助您更好地了解人们对于某个主题的看法和态度。
接下来让我们看看如何实现的吧,以及这两年CSDN的外部综合评价是否和你想的一样。
文章目录
- Scrapy 网络爬虫
- Scrapy 核心代码
- Scrapy 启动
- Python 数据分析
- 构建情感分类信息
- 基础数据清洗整理
- 词云可视化
- 年度用户发帖量对比
- 用户发帖渠道对比
- 用户发帖时间
- 每月用户情感倾向
- PyEcharts 动态情感分析
- 情感得分汇总对比
Scrapy 网络爬虫
这里使用的 Scrapy 框架是 2.6.x 框架,由于整个过程中没有被微博服务器反爬,因此就没有浪费代理池的资源,不过在框架代码中我按照习惯还是设置了。
Scrapy 核心代码
settings.py,这里主要配置了爬虫的客户端以及抓取微博数据需要设置的 Cookie 信息,在每次启动爬虫任务的时候需要自己手动更新 Cookie 进行替换。
打码的地方自己完全复制过来就好了。

BOT_NAME = 'spider'

SPIDER_MODULES = ['spiders']
NEWSPIDER_MODULE = 'spiders'

ROBOTSTXT_OBEY = False

with open('cookie.txt', 'rt', encoding='utf-8') as f:
    cookie = f.read().strip()
DEFAULT_REQUEST_HEADERS = {
    'User-Agent': 'Mozilla/5.0 (Macintosh; Intel Mac OS X 10.13; rv:61.0) Gecko/20100101 Firefox/61.0',
    'Cookie': cookie
}

CONCURRENT_REQUESTS = 16

DOWNLOAD_DELAY = 1

DOWNLOADER_MIDDLEWARES = {
    'scrapy.downloadermiddlewares.cookies.CookiesMiddleware': None,
    'scrapy.downloadermiddlewares.redirect.RedirectMiddleware': None,
    'middlewares.IPProxyMiddleware': 100,
    'scrapy.downloadermiddlewares.httpproxy.HttpProxyMiddleware': 101,
}

ITEM_PIPELINES = {
    'pipelines.JsonWriterPipeline': 300,
}
pipelines.py,这里设置的将数据写入项目目录下 output 文件夹并将每一条抓取的数据依次写入 json 文件中。
    def __init__(self):
        self.file = None
        if not os.path.exists('../output'):
            os.mkdir('../output')

    def process_item(self, item, spider):
        """
        处理item
        """
        if not self.file:
            now = datetime.datetime.now()
            file_name = spider.name + "_" + now.strftime("%Y%m%d%H%M%S") + '.json'
            self.file = open(f'../output/{file_name}', 'wt', encoding='utf-8')
        item['crawl_time'] = int(time.time())
        line = json.dumps(dict(item), ensure_ascii=False) + "\n"
        self.file.write(line)
        self.file.flush()
        return item
middlewares.py,中间件这里我用的自己的代理一直没更换过 IP ,之前也说了没有被反爬,所以用不用的无所谓了。
    def process_request(self, request, spider):
        """
        将代理IP添加到request请求中
        """
        proxy_data = self.fetch_proxy()
        if proxy_data:
            current_proxy = f'http://127.0.0.1:19180'
            spider.logger.debug(f"current proxy:{current_proxy}")
            request.meta['proxy'] = current_proxy
search.spider.py ,核心的抓取数据代码。这里搜索的关键词是 『CSDN』,然后以日为单位遍历从2021年1月1号,到2022年12月28日的数据进行抓取,如果有多页就自动翻页进行获取,将结果保存到 json 文件中。
class SearchSpider(Spider):
"""
关键词搜索采集
"""
name = "search_spider"
base_url = "https://s.weibo.com/"
def start_requests(self):
"""
爬虫入口
"""
keywords = ['CSDN']
time_list = [
["2021-01-01-0", "2021-01-01-23"],
["2021-01-02-0", "2021-01-02-23"],
.......
["2022-12-27-0", "2022-12-27-23"],
["2022-12-28-0", "2022-12-28-23"],
]
is_search_with_specific_time_scope = True
is_sort_by_hot = False
for i in time_list:
for keyword in keywords:
if is_search_with_specific_time_scope:
url = f"https://s.weibo.com/weibo?q={keyword}×cope=custom%3A{i[0]}%3A{i[1]}&page=1"
else:
url = f"https://s.weibo.com/weibo?q={keyword}&page=1"
if is_sort_by_hot:
url += "&xsort=hot"
yield Request(url, callback=self.parse, meta={'keyword': keyword})
def parse(self, response, **kwargs):
"""
网页解析
"""
html = response.text
tweet_ids = re.findall(r'\d+/(.*?)\?refer_flag=1001030103_" ', html)
for tweet_id in tweet_ids:
url = f"https://weibo.com/ajax/statuses/show?id={tweet_id}"
yield Request(url, callback=self.parse_tweet, meta=response.meta)
next_page = re.search('<a href="(.*?)" class="next">下一页</a>', html)
if next_page:
url = "https://s.weibo.com" + next_page.group(1)
yield Request(url, callback=self.parse, meta=response.meta)
@staticmethod
def parse_tweet(response):
"""
解析推文
"""
data = json.loads(response.text)
item = parse_tweet_info(data)
item['keyword'] = response.meta['keyword']
if item['isLongText']:
url = "https://weibo.com/ajax/statuses/longtext?id=" + item['mblogid']
yield Request(url, callback=parse_long_tweet, meta={'item': item})
else:
yield item
Scrapy 启动
启动脚本开始挂机,整个过程大概持续了不到 2个钟头。

抓取数据后这里将2021年和2022年的数据分开进行保存。

这里的数据基本都是页面上能看到的数据信息,但是不包括点击加载的每条微博的评论数据,只有最基础的发帖数据信息。

Python 数据分析
首先加载必要的三方库,功能不知道干嘛用的自行百度或者看下面的代码。
import pandas as pd
import json
import time
import re
from pandas.io.json import json_normalize

from wordcloud import WordCloud
import matplotlib.pyplot as plt

plt.rcParams['font.sans-serif']=['SimHei']
plt.rcParams['axes.unicode_minus']=False

from pyecharts import options as opts
from pyecharts.charts import Pie, Timeline
构建情感分类信息
这里使用的百度API的接口,然后根据置信度和倾向程度又进行了细分操作,将原有的『正面』、『负面』、『中性』进行细分成『非常正面』、『正面』、『非常负面』、『负面』、『中性』这5类。
不过在分类之前我们要获取能进行该操作的基础数据。
读取 json 数据构建 DataFrame。
with open("search_CSDN_2021.json",encoding='utf8') as f:
    data = f.readlines()

data = [json.loads(i.replace("\n","")) for i in data]

df = pd.DataFrame(data)
df.head(2)

使用『百度API』情感分类功能进行建模应用,具体接口操作不会的自行百度API文档。
def getToken():
    host = 'https://aip.baidubce.com/oauth/2.0/token?grant_type=client_credentials&client_id=' + API_Key + '&client_secret=' + Secret_Key
    response = requests.get(host)

    if response.status_code == 200:
        info = json.loads(response.text)
        access_token = info['access_token']
        return access_token
    return ''

accessToken = getToken()

def getEmotion(inputText):
    time.sleep(1)
    url = 'https://aip.baidubce.com/rpc/2.0/nlp/v1/sentiment_classify?access_token=' + accessToken
    header = {'Content-Type ': 'application/json'}
    body = {'text': inputText}
    requests.packages.urllib3.disable_warnings()
    res = requests.post(url=url, data=json.dumps(body), headers=header, verify=False)
    if res.status_code == 200:
        info = json.loads(res.text)
    return str(info)
使用 apply 函数构建的方式将结果保存到 sentiment 字段并进行保存 excel 表单。
df["sentiment"] = df.content.apply(getEmotion)
df.to_excel("data.xlsx")
其中获取到情感分类的数据信息大致是这样的。
{'text': '望着CSDN的会员价格,在思考这和花1K买个毕设的区别在哪', 'items': [{'confidence': 0.0389296, 'negative_prob': 0.567518, 'positive_prob': 0.432482, 'sentiment': 0}], 'log_id': 1608337687190572820}
这里所有数据都保存到表单进行后期的加工。

基础数据清洗整理
将正面概率、负面概率、置信度、类别提取到新的字段中。
def confidence_(text):
    try:
        test=re.sub('\'','\"',text)
        data = json.loads(test)
        return data["items"][0]["confidence"]
    except:
        return "-"

def negative_prob_(text):
    try:
        test=re.sub('\'','\"',text)
        data = json.loads(test)
        return data["items"][0]["negative_prob"]
    except:
        return "-"

def positive_prob_(text):
    try:
        test=re.sub('\'','\"',text)
        data = json.loads(test)
        return data["items"][0]["positive_prob"]
    except:
        return "-"

def sentiment_(text):
    try:
        test=re.sub('\'','\"',text)
        data = json.loads(test)
        return data["items"][0]["sentiment"]
    except:
        return "-"


df["confidence_"] = df.sentiment.apply(confidence_)
df["negative_prob_"] = df.sentiment.apply(negative_prob_)
df["positive_prob_"] = df.sentiment.apply(positive_prob_)
df["sentiment_"] = df.sentiment.apply(sentiment_)
拆解日期数据,只要每天的数据信息字段,例如『2022-01-01』这样。
def split_date(text):
    return text.split(" ")[0]

df["created_at_date"] = df.created_at.apply(split_date)
词云可视化
这里对全部的发帖信息汇总到一起按照2021年和2022年这样对比来看。
这里根据不同的情感『正面』、『负面』、『中性』以及全部的内容进行词云可视化方便小伙伴对比。
友情提示:图片上图为2021年、下图为2022年。
全部词云可视化
text = " ".join(review for review in df["content"])
wordcloud = WordCloud(font_path="simsun.ttc").generate(text)
plt.imshow(wordcloud, interpolation='bilinear')
plt.axis("off")
plt.show()


正面词云可视化
data = df[df["sentiment_"]==2]["content"]
data.reset_index(drop=True,inplace=True)

text = " ".join(review for review in data)
wordcloud = WordCloud(font_path="simsun.ttc").generate(text)
plt.imshow(wordcloud, interpolation='bilinear')
plt.axis("off")
plt.show()


负面词云可视化
data = df[df["sentiment_"]==0]["content"]
data.reset_index(drop=True,inplace=True)

text = " ".join(review for review in data)
wordcloud = WordCloud(font_path="simsun.ttc").generate(text)
plt.imshow(wordcloud, interpolation='bilinear')
plt.axis("off")
plt.show()


中性词云可视化
data = df[df["sentiment_"]==1]["content"]
data.reset_index(drop=True,inplace=True)

text = " ".join(review for review in data)
wordcloud = WordCloud(font_path="simsun.ttc").generate(text)
plt.imshow(wordcloud, interpolation='bilinear')
plt.axis("off")
plt.show()


年度用户发帖量对比
这里除了CSDN官方和邹老板以外一个都不认识 - -~。
def nick_name(text):
    text = re.sub('\'','\"',text)
    text = re.sub('False','"-"',text)
    text = re.sub('True','"-"',text)
    data = json.loads(text)
    return data["nick_name"]

df["nick_name"] = df.user.apply(nick_name)

nick_name_counts = df.groupby('nick_name')['nick_name'].count()
sorted_nick_name_counts = nick_name_counts.sort_values(ascending=False)
sorted_nick_name_counts.head(20)

用户发帖渠道对比
先说结论,在微博上看 CSDN 的都是有钱人。
source_counts = df.groupby('source')['source'].count()
sorted_source_counts = source_counts.sort_values(ascending=False)
sorted_source_counts.head(20)

用户发帖时间
这里按照每小时切分进行对比,符合程序员日常活动时间范围。
df = pd.read_excel("data.xlsx")
def hour_(text):
    return text.split(" ")[1].split(":")[0]

df["hour_"] = df.created_at.apply(hour_)

hour_counts = df.groupby(['hour_'])['hour_'].count()
hour_counts.plot.bar()
plt.show()


每月用户情感倾向
这里把情感细分成『非常正面』、『正面』、『非常负面』、『负面』、『中性』5中,
def month_(text):
    return text.split("-")[1]

df["month_"] = df.created_at_date.apply(month_)

data = df[df["sentiment_"] != "-"]

def sentiment_type(text):
    test=re.sub('\'','\"',text)
    data = json.loads(test)
    type_data_num = data["items"][0]
#     print(type_data_num)

    if type_data_num['sentiment'] ==1:
        return '中性'
    elif type_data_num['sentiment']==2 and type_data_num['positive_prob'] >= 0.75:
        return '非常正面'
    elif type_data_num['sentiment']==2:
        return '正面'
    elif type_data_num['sentiment']==0 and type_data_num['negative_prob'] >= 0.75:
        return '负面'
    elif type_data_num['sentiment']==0:
        return '非常负面'

data["sentiment_type"] = data.sentiment.apply(sentiment_type)
折线图对比
sentiment_counts = data.groupby(['month_','sentiment_type'])['sentiment_type'].count()
unstacked_df = sentiment_counts.unstack(level=-1)
unstacked_df.plot()
plt.legend(['非常负面','负面', '中性', '正面', '非常正面'], loc='upper right')
plt.ylabel('数量')
plt.xlabel('月份')


柱状堆积图对比


PyEcharts 动态情感分析
unstacked_df["中性"] = unstacked_df["中性"].astype(int)
unstacked_df["正面"] = unstacked_df["正面"].astype(int)
unstacked_df["负面"] = unstacked_df["负面"].astype(int)
unstacked_df["非常正面"] = unstacked_df["非常正面"].astype(int)
unstacked_df["非常负面"] = unstacked_df["非常负面"].astype(int)

list_data = []
for i in range(len(unstacked_df)):
    list_data.append((
        ["中性",unstacked_df["中性"][i]],
        ["正面",unstacked_df["正面"][i]],
        ["负面",unstacked_df["负面"][i]],
        ["非常正面",unstacked_df["非常正面"][i]],
        ["非常负面",unstacked_df["非常负面"][i]],
 ))


tl = Timeline()
for i in range(12):
    pie = (
        Pie()
        .add(
            "data",
            list(list_data[i]),
            rosetype="radius",
            radius=["30%", "55%"],
        )
        .set_global_opts(title_opts=opts.TitleOpts("2021年CSDN微博舆{}月分析".format(i+1)))
    )
    tl.add(pie, "{}月".format(i+1))
    pie.render_notebook()

tl.render("timeline_pie2021.html")
tl.render_notebook()


情感得分汇总对比
根据之前的结果统计出来每个月5种情况的数量,然后按照不同的标签进行得分的划分,例如
score_dict = {
    '中性': 0,
    '正面': 1,
    '负面': -1,
    '非常正面': 3,
    '非常负面': -3
}
将下列已经获取的数据进行转换最后进行计算。
list_data2021 = [
    [['中性', 3], ['正面', 10], ['负面', 98], ['非常正面', 156], ['非常负面', 17]],
    [['中性', 4], ['正面', 6], ['负面', 45], ['非常正面', 75], ['非常负面', 9]],
    [['中性', 16], ['正面', 23], ['负面', 108], ['非常正面', 184], ['非常负面', 7]],
    [['中性', 10], ['正面', 20], ['负面', 89], ['非常正面', 172], ['非常负面', 16]],
    [['中性', 7], ['正面', 17], ['负面', 116], ['非常正面', 114], ['非常负面', 9]],
    [['中性', 11], ['正面', 26], ['负面', 84], ['非常正面', 155], ['非常负面', 14]],
    [['中性', 6], ['正面', 16], ['负面', 94], ['非常正面', 146], ['非常负面', 18]],
    [['中性', 9], ['正面', 14], ['负面', 68], ['非常正面', 135], ['非常负面', 8]],
    [['中性', 8], ['正面', 16], ['负面', 115], ['非常正面', 215], ['非常负面', 15]],
    [['中性', 4], ['正面', 21], ['负面', 119], ['非常正面', 180], ['非常负面', 16]],
    [['中性', 12], ['正面', 21], ['负面', 137], ['非常正面', 208], ['非常负面', 22]],
    [['中性', 12], ['正面', 21], ['负面', 121], ['非常正面', 231], ['非常负面', 23]]
]

list_data2022 = [
    [['中性', 11], ['正面', 15], ['负面', 102], ['非常正面', 153], ['非常负面', 11]],
    [['中性', 5], ['正面', 22], ['负面', 92], ['非常正面', 145], ['非常负面', 11]],
    [['中性', 13], ['正面', 16], ['负面', 170], ['非常正面', 214], ['非常负面', 26]],
    [['中性', 14], ['正面', 23], ['负面', 144], ['非常正面', 231], ['非常负面', 20]],
    [['中性', 6], ['正面', 26], ['负面', 128], ['非常正面', 265], ['非常负面', 23]],
    [['中性', 13], ['正面', 12], ['负面', 111], ['非常正面', 185], ['非常负面', 13]],
    [['中性', 8], ['正面', 22], ['负面', 119], ['非常正面', 142], ['非常负面', 20]],
    [['中性', 11], ['正面', 18], ['负面', 102], ['非常正面', 163], ['非常负面', 9]],
    [['中性', 8], ['正面', 18], ['负面', 125], ['非常正面', 176], ['非常负面', 21]],
    [['中性', 13], ['正面', 27], ['负面', 124], ['非常正面', 204], ['非常负面', 28]],
    [['中性', 14], ['正面', 33], ['负面', 178], ['非常正面', 191], ['非常负面', 17]],
    [['中性', 9], ['正面', 17], ['负面', 123], ['非常正面', 191], ['非常负面', 24]]
]
转换后的数据。
list_data2021 = [
    [[0, 3], [1, 10], [-1, 98], [3, 156], [-3, 17]],
    [[0, 4], [1, 6], [-1, 45], [3, 75], [-3, 9]],
    [[0, 16], [1, 23], [-1, 108], [3, 184], [-3, 7]],
    [[0, 10], [1, 20], [-1, 89], [3, 172], [-3, 16]],
    [[0, 7], [1, 17], [-1, 116], [3, 114], [-3, 9]],
    [[0, 11], [1, 26], [-1, 84], [3, 155], [-3, 14]],
    [[0, 6], [1, 16], [-1, 94], [3, 146], [-3, 18]],
    [[0, 9], [1, 14], [-1, 68], [3, 135], [-3, 8]],
    [[0, 8], [1, 16], [-1, 115], [3, 215], [-3, 15]],
    [[0, 4], [1, 21], [-1, 119], [3, 180], [-3, 16]],
    [[0, 12], [1, 21], [-1, 137], [3, 208], [-3, 22]],
    [[0, 12], [1, 21], [-1, 121], [3, 231], [-3, 23]]
]

list_data2022 = [
    [[0, 11], [1, 15], [-1, 102], [3, 153], [-3, 11]],
    [[0, 5], [1, 22], [-1, 92], [3, 145], [-3, 11]],
    [[0, 13], [1, 16], [-1, 170], [3, 214], [-3, 26]],
    [[0, 14], [1, 23], [-1, 144], [3, 231], [-3, 20]],
    [[0, 6], [1, 26], [-1, 128], [3, 265], [-3, 23]],
    [[0, 13], [1, 12], [-1, 111], [3, 185], [-3, 13]],
    [[0, 8], [1, 22], [-1, 119], [3, 142], [-3, 20]],
    [[0, 11], [1, 18], [-1, 102], [3, 163], [-3, 9]],
    [[0, 8], [1, 18], [-1, 125], [3, 176], [-3, 21]],
    [[0, 13], [1, 27], [-1, 124], [3, 204], [-3, 28]],
    [[0, 14], [1, 33], [-1, 178], [3, 191], [-3, 17]],
    [[0, 9], [1, 17], [-1, 123], [3, 191], [-3, 24]]
]
对数据进行求和汇总以及对比数据可视化。
l_2021 = []
for i in list_data2021:
    l_ = []
    for j in i:
        l_.append(j[0]*j[1])
    l_2021.append(sum(l_))

l_2022 = []
for i in list_data2022:
    l_ = []
    for j in i:
        l_.append(j[0]*j[1])
    l_2022.append(sum(l_))

each = pd.DataFrame()
each["月"] = [str(i)+"月" for i in range(1,13)]
each["2021年"] = l_2021
each["2022年"] = l_2022

each.plot()
plt.title("CSDN 2021和2022年情感汇总得分月折线图")
plt.ylabel('数量')
plt.xlabel('月份')
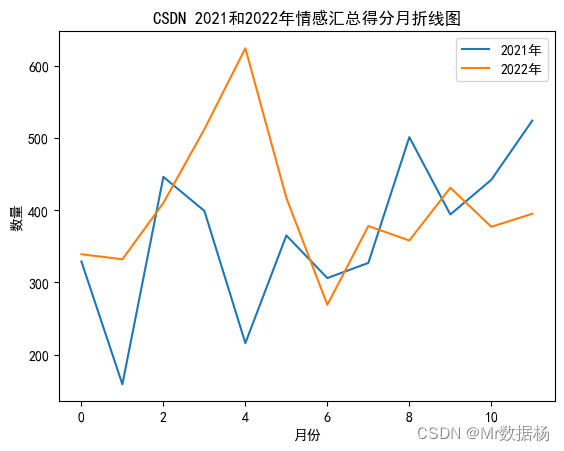
总体来说正面情感的内容还是比较理想的。

