python 使用reportlab打造29页图文并茂pdf(全网reportlab最强pdf自动化生成代码)
这次项目所使用的代码如果同志们可以灵活使用,基本上可以解决百分之九十以上的pdf模板自动化生成。
最近博主,做了一个项目,使用reportlab制作pdf,博主打算把代码分享出来,先看一下博主生成的pdf:
以上就是,这次项目生成的pdf,使用的数据,我就不分享了,下面是代码。
注:代码需要有一点编程灵性才能看懂,另外,数据集博主就不分享了,设计一些商业机密,感兴趣的同学可以好好学习一下。
#encoding=gbk
import cv2
from reportlab.pdfgen import canvas
from PIL import Image
#encoding=gbk
from reportlab.pdfbase import pdfmetrics # 注册字体
from reportlab.pdfbase.ttfonts import TTFont # 字体类
from reportlab.platypus import Table, SimpleDocTemplate, Paragraph, Image # 报告内容相关类
from reportlab.lib.pagesizes import letter # 页面的标志尺寸(8.5*inch, 11*inch)
from reportlab.lib.styles import getSampleStyleSheet # 文本样式
from reportlab.lib import colors # 颜色模块
from reportlab.graphics.charts.barcharts import VerticalBarChart # 图表类
from reportlab.graphics.charts.legends import Legend # 图例类
from reportlab.graphics.shapes import Drawing # 绘图工具
from reportlab.lib.units import cm # 单位:cm
from reportlab.platypus import BaseDocTemplate, Paragraph, Table, Spacer, PageBreak, Image, PageTemplate, \
Frame, NextPageTemplate, FrameBreak
from reportlab.lib.units import inch
import json
with open("./res_summary.json", "r", encoding="utf-8") as f:
contentz = json.load(f)
# for key in contentz.keys():
# print(key,contentz[key])
# 注册字体(提前准备好字体文件, 如果同一个文件需要多种字体可以注册多个)
pdfmetrics.registerFont(TTFont('SimSun', 'simsun.ttc'))
pdfmetrics.registerFont(TTFont('SimSunb', 'ssb.ttf'))
#C:\Users\Administrator\source\repos\latex\latex\simsun.ttc
class Graphs:
# 绘制标题
@staticmethod
def draw_title(title: str):
# 获取所有样式表
style = getSampleStyleSheet()
# 拿到标题样式
ct = style['Heading1']
# 单独设置样式相关属性
ct.fontName = 'SimSunb' # 字体名
ct.fontSize = 23 # 字体大小
ct.leading = 40 # 行间距
ct.textColor = colors.black # 字体颜色
ct.alignment = 1 # 居中
ct.bold = 10
ct.leftMargin = 120#改左边距
ct.rightMargin = 120
# 创建标题对应的段落,并且返回
return Paragraph(title, ct)
# 绘制小标题
@staticmethod
def draw_little_title(title: str):
# 获取所有样式表
style = getSampleStyleSheet()
# 拿到标题样式
ct = style['Normal']
# 单独设置样式相关属性
ct.fontName = 'SimSun' # 字体名
ct.fontSize = 15 # 字体大小
ct.leading = 30 # 行间距
ct.textColor = colors.red # 字体颜色
# 创建标题对应的段落,并且返回
return Paragraph(title, ct)
# 绘制普通段落内容
@staticmethod
def draw_text(text: str):
# 获取所有样式表
style = getSampleStyleSheet()
# 获取普通样式
ct = style['Normal']
ct.fontName = 'SimSun'
ct.fontSize = 12
ct.wordWrap = 'CJK' # 设置自动换行
ct.alignment = 0 # 左对齐
ct.firstLineIndent = 32 # 第一行开头空格
ct.leading = 30
return Paragraph(str(text), ct)
def draw_text_2(text: str):
# 获取所有样式表
style = getSampleStyleSheet()
# 获取普通样式
ct = style['Normal']
ct.fontName = 'SimSunb'
ct.fontSize = 12
ct.wordWrap = 'CJK' # 设置自动换行
ct.alignment = 0 # 左对齐
ct.firstLineIndent = 32 # 第一行开头空格
ct.leading = 25
return Paragraph(str(text), ct)
def draw_text_23(text: str):
# 获取所有样式表
style = getSampleStyleSheet()
# 获取普通样式
ct = style['Normal']
ct.fontName = 'SimSunb'
ct.fontSize = 12
ct.wordWrap = 'CJK' # 设置自动换行
ct.alignment = 1 # 左对齐
ct.firstLineIndent = 32 # 第一行开头空格
ct.leading = 25
return Paragraph(str(text), ct)
def draw_text_5(text: str):
# 获取所有样式表
style = getSampleStyleSheet()
# 获取普通样式
ct = style['Normal']
ct.fontName = 'SimSunb'
ct.fontSize = 12
ct.wordWrap = 'CJK' # 设置自动换行
ct.alignment = 0 # 左对齐
ct.firstLineIndent = 0 # 第一行开头空格
ct.leading = 30
return Paragraph(str(text), ct)
def draw_text_4(text: str):
# 获取所有样式表
style = getSampleStyleSheet()
# 获取普通样式
ct = style['Normal']
ct.fontName = 'SimSun'
ct.fontSize = 12
ct.wordWrap = 'CJK' # 设置自动换行
ct.alignment = 0 # 左对齐
ct.firstLineIndent = 0 # 第一行开头空格
ct.leading = 30
return Paragraph(str(text), ct)
# 绘制表格
def draw_text_3(text: str):
# 获取所有样式表
style = getSampleStyleSheet()
# 获取普通样式
ct = style['Normal']
ct.fontName = 'SimSun'
ct.fontSize = 12
ct.wordWrap = 'CJK' # 设置自动换行
ct.alignment = 0 # 左对齐
ct.firstLineIndent = 32 # 第一行开头空格
ct.leading = 30
return Paragraph(str(text), ct)
# 绘制表格
@staticmethod
def draw_table(*args):
# 列宽度
col_width = 120
style = [
('FONTNAME', (0, 0), (-1, -1), 'SimSunb'), # 字体
('FONTSIZE', (0, 0), (-1, 0), 12), # 第一行的字体大小
('FONTSIZE', (0, 1), (-1, -1), 10), # 第二行到最后一行的字体大小
#('BACKGROUND', (0, 0), (-1, 0), '#d5dae6'), # 设置第一行背景颜色
('ALIGN', (0, 0), (-1, -1), 'CENTER'), # 第一行水平居中
('ALIGN', (0, 1), (-1, -1), 'CENTER'), # 第二行到最后一行左右左对齐
('VALIGN', (0, 0), (-1, -1), 'MIDDLE'), # 所有表格上下居中对齐
('TEXTCOLOR', (0, 0), (-1, -1), colors.black), # 设置表格内文字颜色
('GRID', (0, 0), (-1, -1), 0.01, colors.black), # 设置表格框线为grey色,线宽为0.5
# ('SPAN', (0, 1), (0, 2)), # 合并第一列二三行
# ('SPAN', (0, 3), (0, 4)), # 合并第一列三四行
# ('SPAN', (0, 5), (0, 6)), # 合并第一列五六行
# ('SPAN', (0, 7), (0, 8)), # 合并第一列五六行
]
table = Table(args, rowHeights=48,colWidths=70 ,style=style)
return table
@staticmethod
def draw_table_z(*args):
# 列宽度
col_width = 120
style = [
('FONTNAME', (0, 0), (-1, -1), 'SimSunb'), # 字体
('FONTSIZE', (0, 0), (-1, 0), 15), # 第一行的字体大小
('FONTSIZE', (0, 1), (-1, -1), 15), # 第二行到最后一行的字体大小
#'BACKGROUND', (0, 0), (-1, 0), 'blue'), # 设置第一行背景颜色
('ALIGN', (0, 0), (0, -1), 'CENTER'), # 第水平居中
('ALIGN', (1, 0), (-1, -1), 'LEFT'), # 第二行到最后一行左右左对齐
# ('BACKGROUND', (0, 0), (-1, 0), 'blue'), # 设置第一行背景颜色
('VALIGN', (0, 0), (-1, -1), 'MIDDLE'), # 所有表格上下居中对齐
('TEXTCOLOR', (0, 0), (-1, -1), colors.darkslategray), # 设置表格内文字颜色
('GRID', (0, 0), (-1, -1), 0.5, colors.grey), # 设置表格框线为grey色,线宽为0.5
# ('SPAN', (0, 1), (0, 2)), # 合并第一列二三行
# ('SPAN', (0, 3), (0, 4)), # 合并第一列三四行
# ('SPAN', (0, 5), (0, 6)), # 合并第一列五六行
# ('SPAN', (0, 7), (0, 8)), # 合并第一列五六行
('SPAN', (1, 0), (3, 0)), # 合并第一列二三行
('SPAN', (1, 1), (3, 1)), # 合并第一列三四行
('SPAN', (1, 2), (3, 2)), # 合并第一列五六行
]
table = Table(args, rowHeights=30,colWidths=110 ,style=style)
return table
@staticmethod
def draw_table_2(*args):
# 列宽度
col_width = 120
style = [
('FONTNAME', (0, 0), (-1, -1), 'SimSunb'), # 字体
('FONTSIZE', (0, 0), (-1, 0), 12), # 第一行的字体大小
('FONTSIZE', (0, 1), (-1, -1), 10), # 第二行到最后一行的字体大小
#('BACKGROUND', (0, 0), (-1, 0), '#d5dae6'), # 设置第一行背景颜色
('ALIGN', (0, 0), (-1, -1), 'CENTER'), # 第一行水平居中
('ALIGN', (0, 1), (-1, -1), 'CENTER'), # 第二行到最后一行左右左对齐
('VALIGN', (0, 0), (-1, -1), 'MIDDLE'), # 所有表格上下居中对齐
('TEXTCOLOR', (0, 0), (-1, -1), colors.black), # 设置表格内文字颜色
('GRID', (0, 0), (-1, -1), 0.01, colors.black), # 设置表格框线为grey色,线宽为0.5
# ('SPAN', (0, 1), (0, 2)), # 合并第一列二三行
# ('SPAN', (0, 3), (0, 4)), # 合并第一列三四行
# ('SPAN', (0, 5), (0, 6)), # 合并第一列五六行
# ('SPAN', (0, 7), (0, 8)), # 合并第一列五六行
]
table = Table(args, rowHeights=48,colWidths=60 ,style=style)
return table
@staticmethod
def draw_table_3(*args):
# 列宽度
col_width = 120
style = [
('FONTNAME', (0, 0), (-1, -1), 'SimSunb'), # 字体
('FONTSIZE', (0, 0), (-1, 0), 12), # 第一行的字体大小
('FONTSIZE', (0, 1), (-1, -1), 10), # 第二行到最后一行的字体大小
#('BACKGROUND', (0, 0), (-1, 0), '#d5dae6'), # 设置第一行背景颜色
('ALIGN', (0, 0), (-1, -1), 'CENTER'), # 第一行水平居中
('ALIGN', (0, 1), (-1, -1), 'CENTER'), # 第二行到最后一行左右左对齐
('VALIGN', (0, 0), (-1, -1), 'MIDDLE'), # 所有表格上下居中对齐
('TEXTCOLOR', (0, 0), (-1, -1), colors.darkslategray), # 设置表格内文字颜色
('GRID', (0, 0), (-1, -1), 0.1, colors.black), # 设置表格框线为grey色,线宽为0.5
# ('SPAN', (0, 1), (0, 2)), # 合并第一列二三行
# ('SPAN', (0, 3), (0, 4)), # 合并第一列三四行
# ('SPAN', (0, 5), (0, 6)), # 合并第一列五六行
# ('SPAN', (0, 7), (0, 8)), # 合并第一列五六行
]
table = Table(args, rowHeights=48,colWidths=60 ,style=style)
return table
@staticmethod
def draw_table_first(*args):
# 列宽度
col_width = 100
style = [
('FONTNAME', (0, 0), (-1, -1), 'SimSunb'), # 字体
('FONTSIZE', (0, 0), (-1, 0), 15), # 第一行的字体大小
('FONTSIZE', (0, 1), (-1, -1), 15), # 第二行到最后一行的字体大小
#'BACKGROUND', (0, 0), (-1, 0), 'blue'), # 设置第一行背景颜色
('ALIGN', (0, 0), (0, -1), 'CENTER'), # 第水平居中
('ALIGN', (1, 0), (-1, -1), 'LEFT'), # 第二行到最后一行左右左对齐
('BACKGROUND', (0, 0), (-1, 0), 'blue'), # 设置第一行背景颜色
('VALIGN', (0, 0), (-1, -1), 'MIDDLE'), # 所有表格上下居中对齐
('TEXTCOLOR', (0, 0), (-1, -1), colors.darkslategray), # 设置表格内文字颜色
('GRID', (0, 0), (-1, -1), 0.5, colors.grey), # 设置表格框线为grey色,线宽为0.5
('SPAN', (1, 0), (3, 0)), # 合并第一列二三行
('SPAN', (1, 1), (3, 1)), # 合并第一列三四行
('SPAN', (1, 2), (3, 2)), # 合并第一列五六行
('SPAN', (1, 3), (3, 3)), # 合并第一列五六行
('SPAN', (1, 4), (3, 4)), # 合并第一列五六行
('SPAN', (1, 5), (3, 5)), # 合并第一列五六行
('SPAN', (1, 6), (3, 6)), # 合并第一列五六行
]
table = Table(args, rowHeights=43,colWidths=110, style=style)
return table
# 创建图表
# 绘制图片
@staticmethod
def draw_img_first(path):
image = cv2.imread(path) # 逐个读取
img = Image(path) # 读取指定路径下的图片
img.drawWidth = 10*cm # 设置图片的宽度
img.drawHeight = 10*cm # 设置图片的高度
return img
@staticmethod
def draw_img_first(path):
image = cv2.imread(path) # 逐个读取
if(image.shape[0]*image.shape[1]>30000000):
print("dd",image.shape)
image=cv2.resize(image,(int(image.shape[0]*0.6),int(image.shape[1]*0.6)))
cv2.imwrite("E:\\work\\10-23\\input\\results\\secs\\z.png",image)
img = Image("E:\\work\\10-23\\input\\results\\secs\\z.png") # 读取指定路径下的图片
# img.drawWidth = 5*cm # 设置图片的宽度
# img.drawHeight = 8*cm # 设置图片的高度
return img
img = Image(path) # 读取指定路径下的图片
img.drawWidth = 3*cm # 设置图片的宽度
img.drawHeight = 3*cm # 设置图片的高度
return img
import csv
def read_csv(path):
listz=[]
p=0
with open(path, 'r', encoding='utf-8') as csv_f:
reader = csv.reader(csv_f)
for row in reader:
# print(row)
if p!=0:
print(row[0])
st=''
for s in row[0][0:]:
if '0'<=s and s<='9':
st=st+s
if s in [',',' ']:
break
row[0]=int(st)
p=p+1
listz.append(row)
return listz
import datetime
from reportlab.lib.units import inch, cm
from reportlab.pdfbase import pdfmetrics, ttfonts
from reportlab.lib.styles import getSampleStyleSheet
from reportlab.platypus import SimpleDocTemplate, Paragraph, PageBreak, Spacer
def myFirstPage(canvas, doc):
"""
第一页页眉页脚配置
:param canvas: 绘画对象,用来写入页眉页脚
:param doc: 文档对象,可以以此得知文档的页边距信息
:return:
"""
# 文档宽度高度(width、height),左右页边距(leftMargin、rightMargin)、上下页边距(topMargin、bottomMargin)
totalPageHeight = doc.bottomMargin + doc.height + doc.topMargin # 页面总高度
totalPageWidth = doc.leftMargin + doc.width + doc.rightMargin # 页面总宽度
# 保存之前的画笔格式等状态,并设置新的状态
canvas.saveState()
# 设置字体及大小
canvas.setFont('SimSun', 12)
# 添置靠左页眉
print(doc.leftMargin, totalPageHeight - doc.topMargin)
canvas.drawImage(
r"MD_logo.png", 0, 785, 5.2* cm, 2 * cm
)
canvas.restoreState()
def myLaterPages(canvas, doc):
"""
除第一页外其它页的页眉页脚配置
:param self:
:param canvas:
:param doc:
:return:
"""
totalPageWidth = doc.leftMargin + doc.width + doc.rightMargin
canvas.saveState()
canvas.setFont('SimSun', 9)
# 添置居中页脚
canvas.drawString(
totalPageWidth / 2.0, doc.bottomMargin, "{}".format(doc.page)
)
canvas.restoreState()
# # print("fdsfdsa",res_summary['project_bird_view_path'])
# content.append(Graphs.draw_text(res_summary['project_name']))#003
# content.append(Graphs.draw_text(res_summary['project_unit']))#004
# content.append(Graphs.draw_text(res_summary['manage_unit']))#005
# content.append(Graphs.draw_text(res_summary['construction_unit']))#006
# content.append(Graphs.draw_text(res_summary['inspection_unit']))##007
# content.append(Graphs.draw_text(res_summary['inspector']))#008
# content.append(Graphs.draw_text(res_summary['inspection_time']))#009
##
# content.append(Graphs.draw_text(res_summary['wall_loc']))#010
# content.append(Graphs.draw_text(res_summary['wall_stage']))#011
# content.append(Graphs.draw_text(res_summary['scoring_dist_thresh_flatness']))#012
# content.append(Graphs.draw_text(res_summary['scoring_dist_thresh_perpendicularity']))#012
# content.append(Graphs.draw_img(res_summary['wall_camera_view_path']))#013
# content.append(Graphs.draw_img(res_summary['pcd_camera_view_path']))#014
# content.append(Graphs.draw_img(res_summary['sec_heat_info']['heat_map_path']))#015
# #print(res_summary['flatness_secs_info']['statistics_measure'])
#
# # print(list_data)
#for key in res_summary['flatness_secs_info']['defect_map_infos']:
# content.append(Graphs.draw_text(key['floors_num']))#023
# content.append(Graphs.draw_img(key['img_path']))#023
#
# #print(res_summary['sec_heat_info']['statistics_pts']['secs_res_path'])
# list_data=read_csv(res_summary['sec_heat_info']['statistics_pts']['secs_res_path'])
# content.append(Graphs.draw_table(*list_data))#017
# content.append(Graphs.draw_text(res_summary['sec_heat_info']['statistics_pts']['valid_avg']))#018
# content.append(Graphs.draw_text(res_summary['sec_heat_info']['statistics_pts']['score_avg']))#019
# #content.append(Graphs.draw_text(res_summary['scoring_dist_thresh_perpendicularity']))#012
# lsiz= res_summary['perpendicularity_secs_info']['worst_se_map_infos']
# for key in res_summary['flatness_secs_info']['worst_se_map_infos']:
# # print(key['floors_num'])
# content.append(Graphs.draw_text(key['floors_num']))#020
# content.append(Graphs.draw_img(key['img_path']))#021
# for k in lsiz:
# # print(k)
# if(k['floors_num']==key['floors_num']) :
# content.append(Graphs.draw_img(k['img_path']))#022
# # print(k['img_path'])
# for key in res_summary['flatness_secs_info']['defect_map_infos']:
# content.append(Graphs.draw_text(key['floors_num']))#023
# content.append(Graphs.draw_img(key['img_path']))#023
# content.append(Graphs.draw_img(res_summary['sec_heat_info']['heat_map_path']))#024
from reportlab.lib.pagesizes import A4
from reportlab.platypus import SimpleDocTemplate, Paragraph, Table, TableStyle, Image
if __name__ == '__main__':
# 创建内容对应的空列表
content = list()
res_summary=contentz
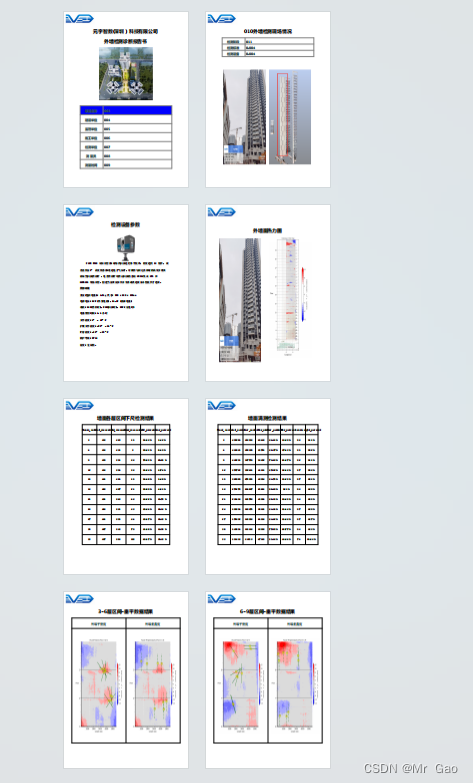
content.append(Graphs.draw_title('元宇智数(深圳)科技有限公司'))
content.append(Graphs.draw_title('外墙检测诊断报告书'))
b=[['项目名称',res_summary['project_name'],'',''],['建设单位',res_summary['project_unit'],'',''],['监理单位',res_summary['manage_unit'],'',''],
['施工单位',res_summary['construction_unit'],'',''],['检测单位',res_summary['inspection_unit'],'',''],
['测量员',res_summary['inspector'],'',''],['测量时间',res_summary['inspection_time'],'','']]
# 添加图片
# # print("fdsfdsa",res_summary['project_bird_view_path'])
p1 = Image(res_summary['project_bird_view_path'],250,250)
content.append(p1)
content.append(Graphs.draw_text_3('<i> </i><br/>'))
content.append(Graphs.draw_table_first(*b))
content.append(Graphs.draw_title(res_summary['wall_loc']+"外墙检测现场情况"))
# content.append(Graphs.draw_text_3('<i> </i><br/>'))
a="检测阶段:"+res_summary['wall_stage']
b="检测标准:"+str(res_summary['scoring_dist_thresh_flatness'])
c="检测设备:"+str(res_summary['scoring_dist_thresh_flatness'])
s=a+'<br/>'+b+"<br/>"+c
lb=[['检测阶段',res_summary['wall_stage'],'',''],['检测标准',str(res_summary['scoring_dist_thresh_flatness']),'',''],['检测设备',str(res_summary['scoring_dist_thresh_flatness']),'','']]
#draw_table_z
content.append(Graphs.draw_table_z(*lb))
# content.append(Graphs.draw_text_2(b))
# content.append(Graphs.draw_text_2(c))
# canvas.drawImage(res_summary['wall_camera_view_path'], inch*.25, inch*.25, 100-(.5*inch), (.316*inch))
#canvas.drawImage(res_summary['wall_camera_view_path'], inch*.25, inch*.25, 100-(.5*inch), (.316*inch))
p13 = Image(res_summary['wall_camera_view_path'],200,455)
p14=Image(res_summary['pcd_camera_view_path'],200,455)
data= [[p13,p14 ]]
t=Table(data,style=[
('GRID',(0,0),(-1,-1),2,colors.white),
('VALIGN', (0, 0), (-1, -1), 'MIDDLE'), # 所有表格上下居中对齐
], rowHeights=460,colWidths=220)
content.append(Graphs.draw_text('<br/><br/>'))
content.append(t)
content.append(Graphs.draw_title("检测设备参数"))
s="FARO P350 双轴补偿器:对每次扫描进行水平校准,精度达到 19 角秒,\
误差范围±2° 高度传感器:通过电子气压计,可测得与固定点相对的高度并将其<br/>添加至扫描指南针 :电子指南针可指示扫描的方向 GNSS:集成 GPS 和<br/>GLONASS 现场补偿:创建当前质量报告并为自动改进设备补偿提供了选项。<br/>"
s3="外部环境<br/>"
s2="重量(包括电池): 4.2kg 尺寸: 230 x 183 x 103mm<br/>电源电压: 19V (外置电源),14.4V (内部电池)<br/>功耗: 15W(待机时),25W(扫描时),80W(充电时)<br/>\
电池使用时间: 4.5 小时<br/>\
工作温度: 5° - 40°C<br/>\
扩展工作温度: -20° - 55°C<br/>\
贮存温度: -10° - 60°C<br/>\
防护等级: IP54<br/>\
湿度: 无凝结。<br/><br/><br/>"
p4 = Image('p2.png',100,150)
content.append(p4)
content.append(Graphs.draw_text_3(s))
content.append(Graphs.draw_text_5(s3))
content.append(Graphs.draw_text_4(s2))
content.append(Graphs.draw_text_3('<i> </i><br/>'))
# content.append(Graphs.draw_text(''))
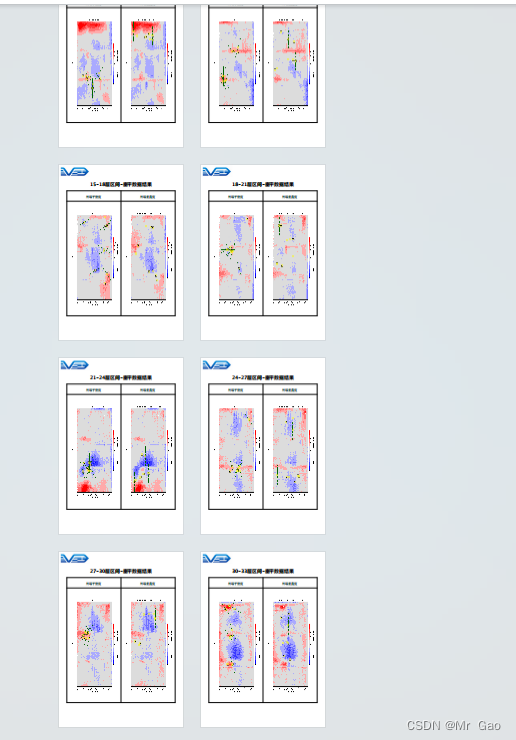
content.append(Graphs.draw_title("外墙面热力图"))
# content.append(Graphs.draw_text_3("<i> </i><br/>"))
p13 = Image(res_summary['wall_camera_view_path'],200,590)
patz="D:\work\latex\data\\z.png"
def p_z(path):
image = cv2.imread(path) # 逐个读取
if(image.shape[0]*image.shape[1]>1000000):
print("dd",image.shape)
image=cv2.resize(image,(int(image.shape[0]*0.5),int(image.shape[1]*0.5)))
cv2.imwrite(patz,image)
# img = Image("E:\\work\\10-23\\input\\results\\secs\\z.png")
else:
cv2.imwrite(patz,image)
p_z(res_summary['sec_heat_info']['heat_map_path'])
p15=Image(patz,7*cm,21*cm)
data= [[p13,p15 ]]
t=Table(data,style=[
('GRID',(0,0),(-1,-1),2,colors.white)], rowHeights=600,colWidths=240)
content.append(t)
content.append(Graphs.draw_title("墙面各层区间下尺检测结果"))
list_data=read_csv(res_summary['flatness_secs_info']['statistics_measure'])
content.append(Graphs.draw_table(*list_data))#016
content.append(Graphs.draw_text_3('<i> </i><br/>'))
content.append(Graphs.draw_title("墙面满测检测结果"))
list_data=read_csv(res_summary['sec_heat_info']['statistics_pts']['secs_res_path'])
content.append(Graphs.draw_table_2(*list_data))#017
content.append(Graphs.draw_text_3('<i> </i><br/>'))
lsiz= res_summary['perpendicularity_secs_info']['worst_se_map_infos']
# data= [[p13,p14 ]]
sty=[ ('SPAN', (0, 0), (3, 0)),
('SPAN', (4, 0), (7, 0)) ,
('SPAN', (0, 1), (3, 11)) ,
('SPAN', (4, 1), (7, 11)) ,
('FONTNAME', (0, 0), (-1, -1), 'SimSun'), # 字体
('FONTSIZE', (0, 0), (-1, 0), 15), # 第一行的字体大小
('FONTSIZE', (0, 1), (-1, -1), 15), # 第二行到最后一行的字体大小
#('BACKGROUND', (0, 0), (-1, 0), '#d5dae6'), # 设置第一行背景颜色
('ALIGN', (0, 0), (-1, -1), 'CENTER'), # 第一行水平居中
('ALIGN', (0, 1), (-1, -1), 'CENTER'), # 第二行到最后一行左右左对齐
('VALIGN', (0, 0), (-1, -1), 'MIDDLE'), # 所有表格上下居中对齐
('TEXTCOLOR', (0, 0), (-1, -1), colors.darkslategray), # 设置表格内文字颜色
('GRID', (0, 0), (-1, -1), 0.1, colors.black), # 设置表格框线为grey色,线宽为0.5
] # 合并第一列二三行,]#('GRID',(0,0),(-1,-1),2,colors.white)
####**********
z=list_data
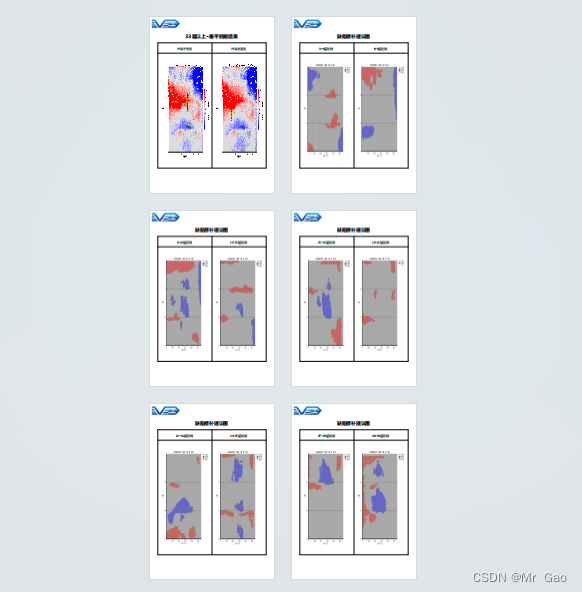
for key in res_summary['flatness_secs_info']['worst_se_map_infos']:
# print(key['floors_num'])
# content.append(Graphs.draw_text(key['floors_num']))#020
if key['floors_num'][0]!=33:
content.append(Graphs.draw_title(str(key['floors_num'][0])+"-"+str(key['floors_num'][1])+"层区间-垂平数据结果"))
else:
content.append(Graphs.draw_title(str(key['floors_num'][0])+"层以上-垂平数据结果"))
p16=Image(key['img_path'],8*cm,16*cm)
list_data=z
list_data[0][0]='外墙平整度'
list_data[0][4]='外墙垂直度'
list_data[1][0]=p16
# content.append(p16)#021
for k in lsiz:
# print(k)
if(k['floors_num']==key['floors_num']) :
# content.append(Graphs.draw_img(k['img_path']))#022
p16=Image(k['img_path'],8*cm,16*cm)
# content.append(p16)#021
list_data[1][4]=p16
t=Table(list_data,style=sty, rowHeights=50,colWidths=65)
content.append(t)
# print(k['img_path'])
content.append(Graphs.draw_text_3('<i> </i><br/>'))
sty2=[ ('SPAN', (0, 0), (7, 0)),
('SPAN', (0, 1), (7, 11)) ,
('FONTNAME', (0, 0), (-1, -1), 'SimSun'), # 字体
('FONTSIZE', (0, 0), (-1, 0), 15), # 第一行的字体大小
('FONTSIZE', (0, 1), (-1, -1), 15), # 第二行到最后一行的字体大小
#('BACKGROUND', (0, 0), (-1, 0), '#d5dae6'), # 设置第一行背景颜色
('ALIGN', (0, 0), (-1, -1), 'CENTER'), # 第一行水平居中
('ALIGN', (0, 1), (-1, -1), 'CENTER'), # 第二行到最后一行左右左对齐
('VALIGN', (0, 0), (-1, -1), 'MIDDLE'), # 所有表格上下居中对齐
('TEXTCOLOR', (0, 0), (-1, -1), colors.darkslategray), # 设置表格内文字颜色
('GRID', (0, 0), (-1, -1), 0.1, colors.black), # 设置表格框线为grey色,线宽为0.5
] # 合并第一列二三行,]#('GRID',(0,0),(-1,-1),2,colors.white)
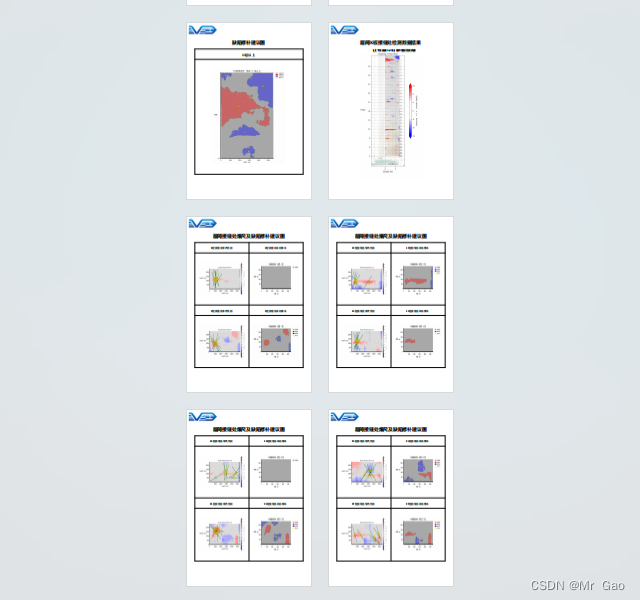
list_z=res_summary['flatness_secs_info']['defect_map_infos']
for i in range(0,len(list_z),2):
content.append(Graphs.draw_title("缺陷修补建议图"))
list_data=z
list_data[0][0]=str(list_z[i]['floors_num'][0])+"-"+str(list_z[i]['floors_num'][1])+"层区间"
p16=Image(list_z[i]['img_path'],8*cm,16*cm)
list_data[1][0]=p16
try:
list_data[0][4]=str(list_z[i+1]['floors_num'][0])+"-"+str(list_z[i+1]['floors_num'][1])+"层区间"
p16=Image(list_z[i+1]['img_path'],8*cm,16*cm)
list_data[1][4]=p16
t=Table(list_data,style=sty, rowHeights=50,colWidths=65)
content.append(t)
content.append(Graphs.draw_text_3('<i> </i><br/>'))
i=i+1
except:
#list_data[0][4]=''
#list_data[1][4]=''
list_data[0][0]=str(list_z[i]['floors_num'][0])+"层以上"
p16=Image(list_z[i]['img_path'],12*cm,16*cm)
list_data[1][0]=p16
t=Table(list_data,style=sty2, rowHeights=50,colWidths=65)
content.append(t)
content.append(Graphs.draw_text_3('<i> </i><br/>'))
i=i+1
content.append(Graphs.draw_title("层间K板接缝处检测数据结果"))
content.append(Graphs.draw_text_23("(上下各延展1.2米)客户定制检测内容"))
# p16=Image(res_summary['sec_heat_info']['heat_map_path'],300,600)
print(res_summary['sec_heat_info']['heat_map_path'])
p_z(res_summary['sec_heat_info']['heat_map_path'])
p15=Image(patz,300,600)
content.append(p15)#024
styz=[ ('SPAN', (0, 0), (3, 0)),
('SPAN', (4, 0), (7, 0)) ,
('SPAN', (0, 1), (3, 5)) ,
('SPAN', (4, 1), (7, 5)) ,
('SPAN', (0, 6), (3, 6)),
('SPAN', (4, 6), (7, 6)) ,
('SPAN', (0, 7), (3, 11)) ,
('SPAN', (4, 7), (7, 11)) ,
('FONTNAME', (0, 0), (-1, -1), 'SimSun'), # 字体
('FONTSIZE', (0, 0), (-1, 0), 12), # 第一行的字体大小
('FONTSIZE', (0, 1), (-1, -1), 12), # 第二行到最后一行的字体大小
#('BACKGROUND', (0, 0), (-1, 0), '#d5dae6'), # 设置第一行背景颜色
('ALIGN', (0, 0), (-1, -1), 'CENTER'), # 第一行水平居中
('ALIGN', (0, 1), (-1, -1), 'CENTER'), # 第二行到最后一行左右左对齐
('VALIGN', (0, 0), (-1, -1), 'MIDDLE'), # 所有表格上下居中对齐
('TEXTCOLOR', (0, 0), (-1, -1), colors.darkslategray), # 设置表格内文字颜色
('GRID', (0, 0), (-1, -1), 0.1, colors.black), # 设置表格框线为grey色,线宽为0.5
] # 合并第一列二三行,]#('GRID',(0,0),(-1,-1),2,colors.white)
# res_summary['flatness_gaps_info']['worst_se_map_infos'][*]['floors_num']
# 和
# res_summary['flatness_gaps_info']['defect_map_infos'][*]['floors_num']
lsiz= res_summary['flatness_gaps_info']['defect_map_infos']
piz=0
for key in res_summary['flatness_gaps_info']['worst_se_map_infos']:
list_data=z
if piz%2==0:
piz=piz+1
content.append(Graphs.draw_title("层间接缝处爆尺及缺陷修补建议图"))
# print("fdsfds")
list_data[0][0]=str(key['floors_num'][0])+'层接缝处爆尺数据'
list_data[0][4]=str(key['floors_num'][0])+'层接缝处缺陷修补'
p16=Image(key['img_path'],212,160)
list_data[1][0]=p16
# content.append(Graphs.draw_img(key['img_path']))#026
for k in lsiz:
# print(k)
if(k['floors_num']==key['floors_num']) :
p16=Image(k['img_path'],212,160)
list_data[1][4]=p16
# content.append(Graphs.draw_img(k['img_path']))#027
else:
piz=piz+1
list_data[6][0]=str(key['floors_num'][0])+'层接缝处爆尺数据'
list_data[6][4]=str(key['floors_num'][0])+'层接缝处缺陷修补'
p16=Image(key['img_path'],212,160)
list_data[7][0]=p16
for k in lsiz:
# print(k)
if(k['floors_num']==key['floors_num']) :
p16=Image(k['img_path'],212,160)
list_data[7][4]=p16
# content.append(Graphs.draw_img(k['img_path']))#027
t=Table(list_data,style=styz, rowHeights=50,colWidths=65)
content.append(t)
content.append(Graphs.draw_text_3('<i> </i><br/>'))
# # res_summary['flatness_gaps_info']['worst_se_map_infos'][*]['floors_num']
# # 和
# # res_summary['flatness_gaps_info']['defect_map_infos'][*]['floors_num']
# lsiz= res_summary['flatness_gaps_info']['defect_map_infos']
# for key in res_summary['flatness_gaps_info']['worst_se_map_infos']:
# # print(key['floors_num'])
# content.append(Graphs.draw_text(key['floors_num']))#025
# content.append(Graphs.draw_img(key['img_path']))#026
# for k in lsiz:
# # print(k)
# if(k['floors_num']==key['floors_num']) :
# content.append(Graphs.draw_img(k['img_path']))#027
# print(k['img_path'])
#print("fdsfdsa",res_summary['project_bird_view_path'])
#content.append(Graphs.draw_img(contentz['sec_heat_info']['heat_map_path']))
#other/MD_logo.png
# for key in contentz.keys():
# path=contentz[key]
# if isinstance(path,dict):
# for keyp in path.keys():
# print(path[keyp])
# else:
# print(path)
# if path.endwith("png"):
#
# 添加段落文字
# content.append(Graphs.draw_text('众所周知,大数据分析师岗位是香饽饽,近几年数据分析热席卷了整个互联网行业,与数据分析的相关的岗位招聘、培训数不胜数。很多人前赴后继,想要参与到这波红利当中。那么数据分析师就业前景到底怎么样呢?'))
# # 添加小标题
# content.append(Graphs.draw_title(''))
# content.append(Graphs.draw_little_title('不同级别的平均薪资'))
# # 添加表格
# data = [
# ('职位名称', '平均薪资', '较上年增长率'),
# ('数据分析师', '18.5K', '25%'),
# ('高级数据分析师', '25.5K', '14%'),
# ('资深数据分析师', '29.3K', '10%')
# ]
# content.append(Graphs.draw_table(*data))
# # 生成图表
# content.append(Graphs.draw_title(''))
# content.append(Graphs.draw_little_title('热门城市的就业情况'))
# b_data = [(25400, 12900, 20100, 20300, 20300, 17400), (15800, 9700, 12982, 9283, 13900, 7623)]
# ax_data = ['BeiJing', 'ChengDu', 'ShenZhen', 'ShangHai', 'HangZhou', 'NanJing']
# leg_items = [(colors.red, '平均薪资'), (colors.green, '招聘量')]
# content.append(Graphs.draw_bar(b_data, ax_data, leg_items))
# 生成pdf文件
doc = SimpleDocTemplate(r'D:\work\latex\data\report.pdf', pagesize=A4)
doc.build(content,onFirstPage=myFirstPage, onLaterPages=myFirstPage)