目录
帕累托图基本构成
绘制帕累托图的步骤
帕累托图(Pareto chart)是将出现的质量问题和质量改进项目按照重要程度依次排列而采用的一种图表。以意大利经济学家V.Pareto的名字而命名的。帕累托图又叫排列图、主次图,是按照发生频率大小顺序绘制的直方图,表示有多少结果是由已确认类型或范畴的原因所造成。
帕累托图基本构成
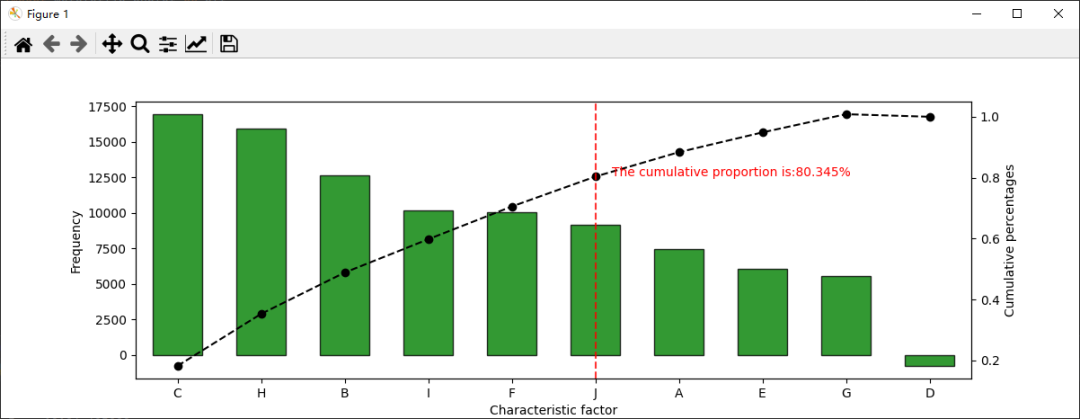
(1)双y轴图,左侧y轴表示频数,右侧y轴表示频率百分比,x轴表示特征因素
(2)左侧y轴数据对应柱状图,右侧y轴数据对应点线图
(3)点线图中超过80%的第一个因素进行标记,左侧就为核心特征因素
绘制帕累托图的步骤
帕累托图是一种直方图,用于显示按重要性递减排列的因素的贡献。它基于帕累托法则,该法则表明80%的问题通常来自于20%的原因。绘制帕累托图的步骤包括:
(1)收集数据: 收集与问题或现象相关的数据,确保数据是可度量和可分类的。
(2)分类和排序: 将数据按照其贡献的重要性进行分类和排序。通常,这是按照贡献的大小进行的。
(3)绘制条形图: 使用条形图表示每个类别的贡献。类别按照重要性递减的顺序排列。
(4)添加累积百分比线: 添加一条表示累积百分比的线,以显示贡献的累积效果。
(5)分析结果: 通过帕累托图,可以清晰地看到哪些因素对整体有重大影响,使决策者能够更有针对性地解决问题。
import numpy as np
import pandas as pd
import matplotlib.pyplot as plt
data = pd.Series(np.random.randn(10)*5000 + 10000,index = list('ABCDEFGHIJ'))
def Pareto_analysis(data):
data.sort_values(ascending=False,inplace = True)
p = data.cumsum()/data.sum()
key = p[p>0.8].index[0]
key_num = data.index.tolist().index(key)
print('More than 80% of the node values are indexed as:',key)
print('More than 80% of the node values index position is:',key_num)
key_product = data.loc[:key]
print('The key factors are:')
print(key_product)
plt.figure(figsize=(12,4))
data.plot(kind = 'bar', color = 'g',edgecolor = 'black', alpha = 0.8, width = 0.6,rot=0)
plt.ylabel('Frequency')
plt.xlabel('Characteristic factor')
p.plot(style = '--ko',secondary_y = True)
plt.axvline(key_num,color='r',linestyle="--",alpha=0.8)
plt.text(key_num+0.2,p[key],"The cumulative proportion is:%.3f%%" % (p[key]*100), color = 'r')
plt.ylabel('Cumulative percentages')
plt.xlim(-0.5,len(data)-0.5)
plt.show()
Pareto_analysis(data)More than 80% of the node values are indexed as: J
More than 80% of the node values index position is: 5
The key factors are:
C 16942.988165
H 15908.169490
B 12639.514649
I 10184.483882
F 10019.403608
J 9145.875791
dtype: float64
