前端开发之在vue项目中使用openLayers
- 前言
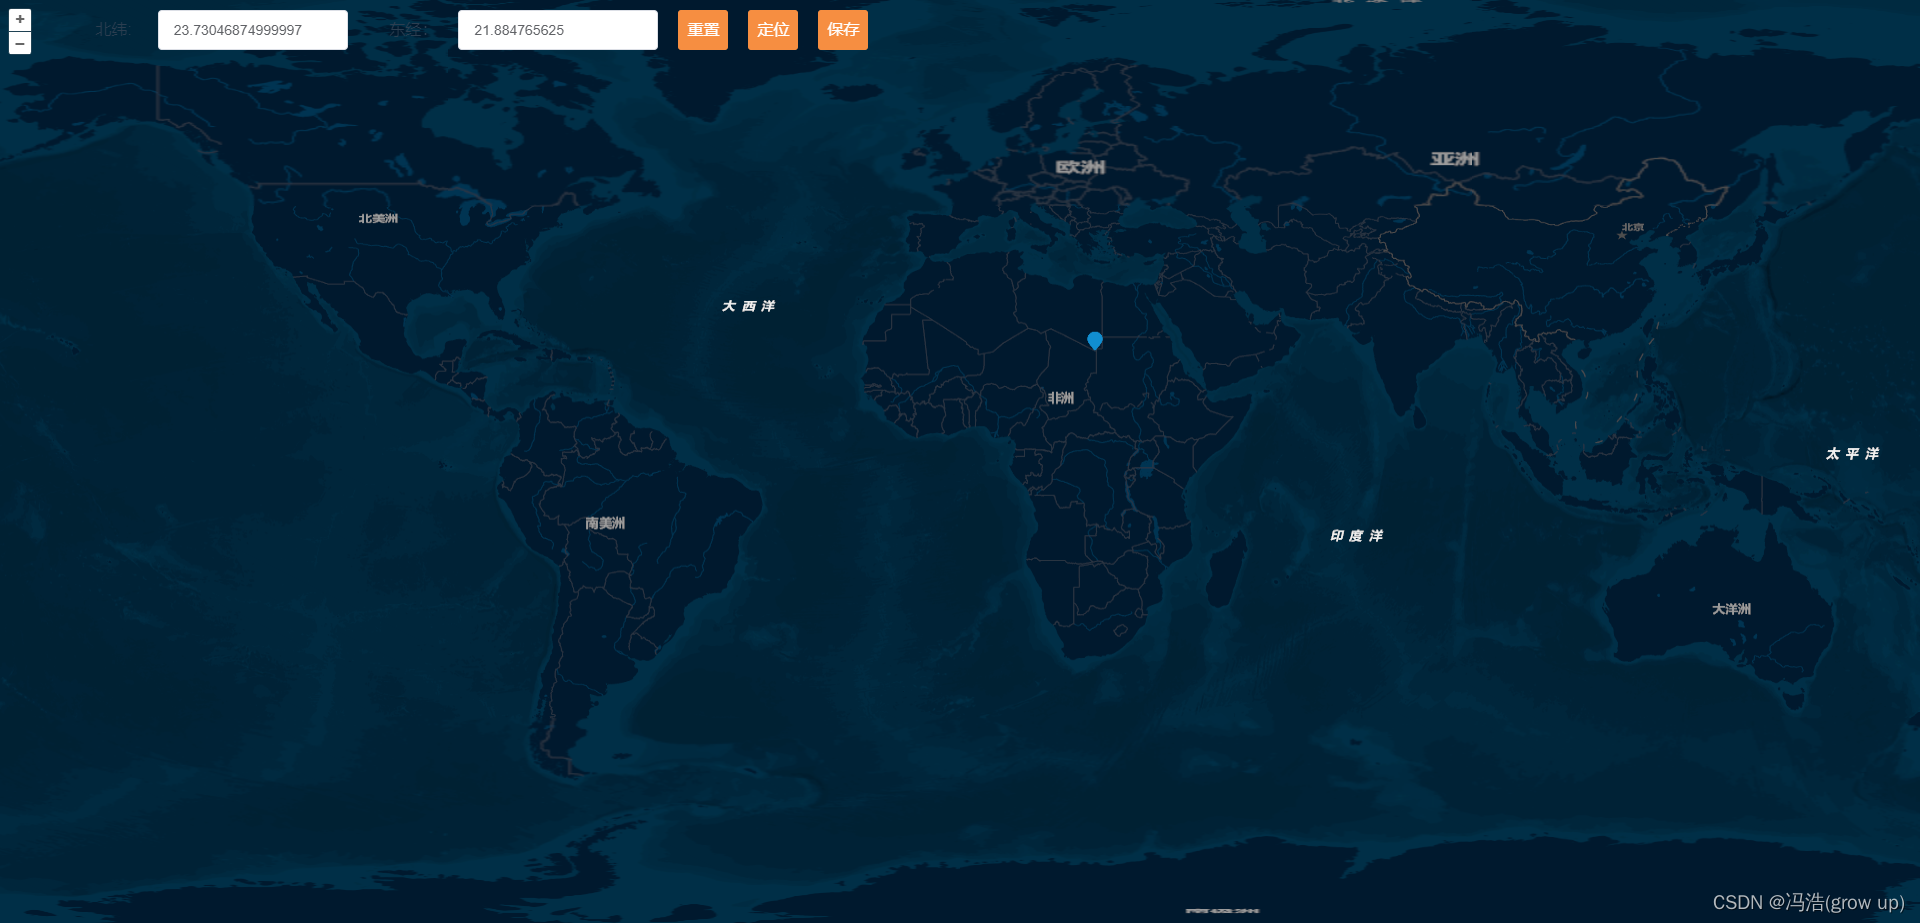
- 效果图
- 在vue中渲染地图
- 安装ol插件
- 1、调用插件
- 2、 初始话地图
- 3、地图点击事件
- 4、重置坐标
- 5、通过坐标改变视图
- 6、保存坐标点
- vue中使用的源码
前言
本篇文章主要讲解openLayers的初步使用,包括渲染地图、获取点坐标、标记点、中心位置的调整、以及获取到经纬度向后台发送请求
演示地址
官网
gitee链接
效果图
在vue中渲染地图
安装ol插件
npm install ol
1、调用插件
import “ol/ol.css”;
import { Map, View, ol } from “ol”;
import TileLayer from “ol/layer/Tile”;
2、 初始话地图
/**
     * 初始化地图
     */
    initMap () {
      var that = this
      // 创建地图中心点坐标
      const centerCoordinate = [0, 0];

      // 初始化视图对象
      const view = new View({
        center: centerCoordinate,
        zoom: 3,
        projection: "EPSG:4326",
      });

      // 创建ArcGIS World Street Map图层
      const arcGISLayer = new TileLayer({
        source: new XYZ({
          // url: "https://server.arcgisonline.com/ArcGIS/rest/services/World_Street_Map/MapServer/tile/{z}/{y}/{x}"
          url: "http://map.geoq.cn/ArcGIS/rest/services/ChinaOnlineStreetPurplishBlue/MapServer/tile/{z}/{y}/{x}"

        })
      });
      // 初始化地图对象
      this.map = new Map({
        target: this.$refs.mapContainer,
        layers: [
          arcGISLayer
        ],
        view: view
      });
      //鼠标单击事件
      this.map.on('singleclick', function (e) {
        that.mapX = e.coordinate[0]
        that.mapY = e.coordinate[1]
        that.addVectorLabel(e.coordinate)
      });

      return this.map
    },
3、地图点击事件
// 定义点
    createLabelStyle (feature) {
      return new Style({
        /**{olx.style.IconOptions}类型*/
        image: new Icon(
          ({
            anchor: [0.5, 60],
            anchorOrigin: 'top-right',
            anchorXUnits: 'fraction',
            anchorYUnits: 'pixels',
            offsetOrigin: 'top-right',
            // offset:[0,10],
            //图标缩放比例
            scale: 0.1,
            //透明度
            opacity: 0.75,
            //图标的url
            src: require("../assets/gd.png")
          })
        )
      });
    },

    // 添加坐标点
    addVectorLabel (coordinate) {
      if (this.vectorSource) {
        this.vectorSource.clear()
      } else {
        //矢量标注的数据源
        this.vectorSource = new VectorSource({
          features: []
        })
      }

      // //矢量标注图层
      this.vectorLayer = new VectorLayer({
        source: this.vectorSource
      });
      this.map.addLayer(this.vectorLayer);
      //新建一个要素
      var newFeature = new Feature({
        //几何信息
        geometry: new Point(coordinate)
      });
      //设置要素的样式
      newFeature.setStyle(this.createLabelStyle(newFeature));
      this.vectorSource.addFeature(newFeature);
    }
4、重置坐标
CZ () {
      this.vectorSource.clear()
      this.mapX = ''
      this.mapY = ''
    },
5、通过坐标改变视图
DW () {
var view = this.map.getView();
var py = ([parseInt(this.mapX), parseInt(this.mapY)]);
//平移地图
view.setCenter(py);
this.addVectorLabel([this.mapX, this.mapY])
view.setZoom(9);
},
6、保存坐标点
BC () {
      var parpms = {
        mapX: this.mapX,
        mapY: this.mapY
      }
      const instance = axios.create({
        baseURL: 'https://127.0.0.1'
      });
      instance.post('/api/data', parpms)
        .then(response => {
          // response.data;//请求返回的数据
        })
        .catch(error => {
          console.log(error);
        });
    },
vue中使用的源码
<template>
  <div>
    <div id="map-container" ref="mapContainer" class="map-container"></div>
    <div class="formList">
      <div class="input">
        <div class="name">北纬:</div>
        <el-input v-model="mapX" placeholder="请输入内容"></el-input>
      </div>
      <div class="input">
        <div class="name">东经:</div>
        <el-input v-model="mapY" placeholder="请输入内容"></el-input>
      </div>
      <div class="button" @click='CZ'>重置</div>
      <div class="button" @click='DW'>定位</div>
      <div class="button" @click='BC'>保存</div>
    </div>
  </div>

</template>

<script>
import "ol/ol.css";

import { fromLonLat } from "ol/proj";
import { OSM, Vector as VectorSource, Raster as RasterSource } from "ol/source";
import { Vector as VectorLayer } from "ol/layer";
import { Fill, Style, Stroke, Icon, Circle as CircleStyle } from "ol/style";
import { Point } from "ol/geom"; //标点,画线
import Feature from "ol/Feature";
import { Map, View, ol } from "ol";
import TileLayer from "ol/layer/Tile";
import XYZ from "ol/source/XYZ";
import axios from 'axios';

export default {
  name: "MapComponent",
  data () {
    return {
      mapX: '',
      mapY: '',
    };
  },
  mounted () {
    this.map = this.initMap()
  },
  methods: {
    /**
     * 初始化地图
     */
    initMap () {
      var that = this
      // 创建地图中心点坐标
      const centerCoordinate = [0, 0];

      // 初始化视图对象
      const view = new View({
        center: centerCoordinate,
        zoom: 3,
        projection: "EPSG:4326",
      });

      // 创建ArcGIS World Street Map图层
      const arcGISLayer = new TileLayer({
        source: new XYZ({
          url: "http://map.geoq.cn/ArcGIS/rest/services/ChinaOnlineStreetPurplishBlue/MapServer/tile/{z}/{y}/{x}"

        })
      });
      // 初始化地图对象
      this.map = new Map({
        target: this.$refs.mapContainer,
        layers: [
          arcGISLayer
        ],
        view: view
      });
      //鼠标单击事件
      this.map.on('singleclick', function (e) {
        that.mapX = e.coordinate[0]
        that.mapY = e.coordinate[1]
        that.addVectorLabel(e.coordinate)
      });

      return this.map
    },

    CZ () {
      this.vectorSource.clear()
      this.mapX = ''
      this.mapY = ''
    },

    DW () {
      var view = this.map.getView();
      var py = ([parseInt(this.mapX), parseInt(this.mapY)]);
      //平移地图
      view.setCenter(py);
      this.addVectorLabel([this.mapX, this.mapY])
      view.setZoom(9);
    },
    BC () {
      var parpms = {
        mapX: this.mapX,
        mapY: this.mapY
      }
      const instance = axios.create({
        baseURL: 'https://127.0.0.1'
      });
      instance.post('/api/data', parpms)
        .then(response => {
          // response.data;//请求返回的数据
        })
        .catch(error => {
          console.log(error);
        });
    },


    // 定义点
    createLabelStyle (feature) {
      return new Style({
        /**{olx.style.IconOptions}类型*/
        image: new Icon(
          ({
            anchor: [0.5, 60],
            anchorOrigin: 'top-right',
            anchorXUnits: 'fraction',
            anchorYUnits: 'pixels',
            offsetOrigin: 'top-right',
            // offset:[0,10],
            //图标缩放比例
            scale: 0.1,
            //透明度
            opacity: 0.75,
            //图标的url
            src: require("../assets/gd.png")
          })
        )
      });
    },

    // 添加坐标点
    addVectorLabel (coordinate) {
      if (this.vectorSource) {
        this.vectorSource.clear()
      } else {
        //矢量标注的数据源
        this.vectorSource = new VectorSource({
          features: []
        })
      }

      // //矢量标注图层
      this.vectorLayer = new VectorLayer({
        source: this.vectorSource
      });
      this.map.addLayer(this.vectorLayer);
      //新建一个要素
      var newFeature = new Feature({
        //几何信息
        geometry: new Point(coordinate)
      });
      //设置要素的样式
      newFeature.setStyle(this.createLabelStyle(newFeature));
      this.vectorSource.addFeature(newFeature);
    }
  }
};
</script>

<style>
.map-container {
  width: 100%;
  height: 100vh;
  margin: 0;
  padding: 0;
}

.formList {
  position: fixed;
  top: 10px;
  left: 50px;
  display: flex;
}

.formList div {
  margin-left: 20px;
}

.button {
  width: 50px;
  line-height: 40px;
  background-color: #f68e41;
  border-radius: 3px;
  color: #fff;
}

.input {
  display: flex;
}

.input .name {
  line-height: 40px;
  width: 25%;
}
</style>


![buuctf_练[安洵杯 2019]easy_web](https://img-blog.csdnimg.cn/img_convert/1201043fd1fb9dc76c4791209cdfeb59.png)