文章目录
- Data Analysis With Python
- Analyzing Numerical Data with NumPy
- Creating NumPy Array
- NumPy Array Slicing
- NumPy Array Broadcasting
- Analyzing Data Using Pandas
In this article, we will discuss how to do data analysis with Python. We will discuss all sorts of data analysis i.e. analyzing numerical data with NumPy, Tabular data with Pandas, data visualization Matplotlib, and Exploratory data analysis.
Data Analysis With Python
Data Analysis is the technique of collecting, transforming, and organizing data to make future predictions and informed data-driven decisions. It also helps to find possible solutions for a business problem. There are six steps for Data Analysis. They are:
- Ask or Specify Data Requirements
- Prepare or Collect Data
- Clean and Process
- Analyze
- Share
- Act or Report
Analyzing Numerical Data with NumPy
NumPy is an array processing package in Python and provides a high-performance multidimensional array object and tools for working with these arrays. It is the fundamental package for scientific computing with Python.
Creating NumPy Array
NumPy arrays can be created in multiple ways, with various ranks. It can also be created with the use of different data types like lists, tuples, etc. The type of the resultant array is deduced from the type of elements in the sequences. NumPy offers several functions to create arrays with initial placeholder content. These minimize the necessity of growing arrays, an expensive operation.
Create Array using numpy.empty(shape, dtype=float, order=’C’)
import numpy as np

b = np.empty(2, dtype = int)
print("Matrix b : \n", b)

a = np.empty([2, 2], dtype = int)
print("\nMatrix a : \n", a)

c = np.empty([3, 3])
print("\nMatrix c : \n", c)
NumPy Array Slicing
Consider the syntax x[obj] where x is the array and obj is the index. The slice object is the index in the case of basic slicing. Basic slicing occurs when obj is :
a slice object that is of the form start: stop: step
- an integer
- or a tuple of slice objects and integers
- All arrays generated by basic slicing are always the view in the original array.
# Python program for basic slicing.
import numpy as np

# Arrange elements from 0 to 19
a = np.arrange(20)
print("\n Array is:\n ",a)

# a[start:stop:step]
print("\n a[-8:17:1] = ",a[-8:17:1])

# The : operator means all elements till the end.
print("\n a[10:] = ",a[10:])
Ellipsis can also be used along with basic slicing. Ellipsis (…) is the number of : objects needed to make a selection tuple of the same length as the dimensions of the array.
# Python program for indexing using basic slicing with ellipsis
import numpy as np

# A 3 dimensional array.
b = np.array([[[1, 2, 3],[4, 5, 6]],
            [[7, 8, 9],[10, 11, 12]]])

print(b[...,1]) #Equivalent to b[: ,: ,1 ]
NumPy Array Broadcasting
The term broadcasting refers to how numpy treats arrays with different Dimensions during arithmetic operations which lead to certain constraints, the smaller array is broadcast across the larger array so that they have compatible shapes.
Let’s assume that we have a large data set, each datum is a list of parameters. In Numpy we have a 2-D array, where each row is a datum and the number of rows is the size of the data set. Suppose we want to apply some sort of scaling to all these data every parameter gets its own scaling factor or say Every parameter is multiplied by some factor.
Just to have a clear understanding, let’s count calories in foods using a macro-nutrient breakdown. Roughly put, the caloric parts of food are made of fats (9 calories per gram), protein (4 CPG), and carbs (4 CPG). So if we list some foods (our data), and for each food list its macro-nutrient breakdown (parameters), we can then multiply each nutrient by its caloric value (apply scaling) to compute the caloric breakdown of every food item.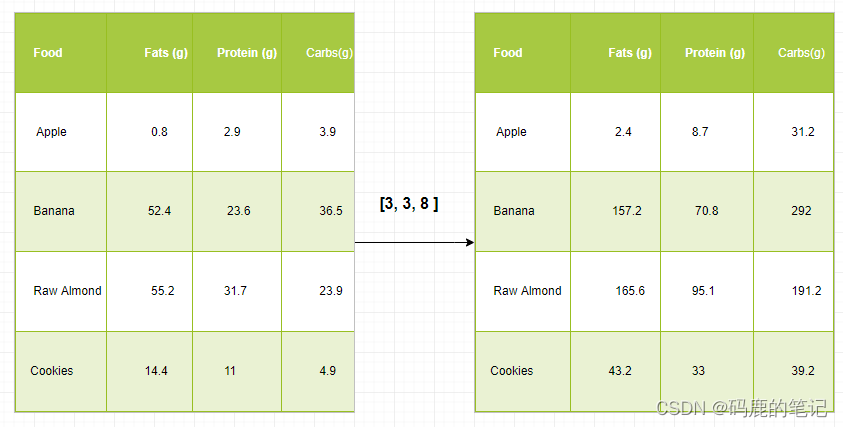
With this transformation, we can now compute all kinds of useful information. For example, what is the total number of calories present in some food or, given a breakdown of my dinner know how many calories did I get from protein and so on.
Let’s see a naive way of producing this computation with Numpy:
import numpy as np

macros = np.array([
[0.8, 2.9, 3.9],
[52.4, 23.6, 36.5],
[55.2, 31.7, 23.9],
[14.4, 11, 4.9]
])

# Create a new array filled with zeros,
# of the same shape as macros.
result = np.zeros_like(macros)

cal_per_macro = np.array([3, 3, 8])

# Now multiply each row of macros by
# cal_per_macro. In Numpy, `*` is
# element-wise multiplication between two arrays.
for i in range(macros.shape[0]):
    result[i, :] = macros[i, :] * cal_per_macro

result
Output:
array([[ 2.4, 8.7, 31.2],
[157.2, 70.8, 292. ],
[165.6, 95.1, 191.2],
[ 43.2, 33. , 39.2]])
Broadcasting Rules: Broadcasting two arrays together follow these rules:
- If the arrays don’t have the same rank then prepend the shape of the lower rank array with 1s until both shapes have the same length.
- The two arrays are compatible in a dimension if they have the same size in the dimension or if one of the arrays has size 1 in that dimension.
- The arrays can be broadcast together if they are compatible with all dimensions.
- After broadcasting, each array behaves as if it had a shape equal to the element-wise maximum of shapes of the two input arrays.
- In any dimension where one array had a size of 1 and the other array had a size greater than 1, the first array behaves as if it were copied along that dimension.
import numpy as np

v = np.array([12, 24, 36])
w = np.array([45, 55])

# To compute an outer product we first
# reshape v to a column vector of shape 3x1
# then broadcast it against w to yield an output
# of shape 3x2 which is the outer product of v and w
print(np.reshape(v, (3, 1)) * w)

X = np.array([[12, 22, 33], [45, 55, 66]])

# x has shape 2x3 and v has shape (3, )
# so they broadcast to 2x3,
print(X + v)

# Add a vector to each column of a matrix X has
# shape 2x3 and w has shape (2, ) If we transpose X
# then it has shape 3x2 and can be broadcast against w
# to yield a result of shape 3x2.

# Transposing this yields the final result
# of shape 2x3 which is the matrix.
print((X.T + w).T)

# Another solution is to reshape w to be a column
# vector of shape 2X1 we can then broadcast it
# directly against X to produce the same output.
print(X + np.reshape(w, (2, 1)))

# Multiply a matrix by a constant, X has shape 2x3.
# Numpy treats scalars as arrays of shape();
# these can be broadcast together to shape 2x3.
print(X * 2)
Note: For more information, refer to our Python NumPy Tutorial.
Analyzing Data Using Pandas
Python Pandas Is used for relational or labeled data and provides various data structures for manipulating such data and time series. This library is built on top of the NumPy library. This module is generally imported as:
import pandas as pd
Here, pd is referred to as an alias to the Pandas. However, it is not necessary to import the library using the alias, it just helps in writing less amount code every time a method or property is called. Pandas generally provide two data structures for manipulating data, They are:
- Series
- Dataframe
Series:
Pandas Series is a one-dimensional labeled array capable of holding data of any type (integer, string, float, python objects, etc.). The axis labels are collectively called indexes. Pandas Series is nothing but a column in an excel sheet. Labels need not be unique but must be a hashable type. The object supports both integer and label-based indexing and provides a host of methods for performing operations involving the index.

It can be created using the Series() function by loading the dataset from the existing storage like SQL, Database, CSV Files, Excel Files, etc., or from data structures like lists, dictionaries, etc.
Python Pandas Creating Series
import pandas as pd
import numpy as np


# Creating empty series
ser = pd.Series()

print(ser)

# simple array
data = np.array(['g', 'e', 'e', 'k', 's'])

ser = pd.Series(data)
print(ser)
Dataframe:
Pandas DataFrame is a two-dimensional size-mutable, potentially heterogeneous tabular data structure with labeled axes (rows and columns). A Data frame is a two-dimensional data structure, i.e., data is aligned in a tabular fashion in rows and columns. Pandas DataFrame consists of three principal components, the data, rows, and columns.

It can be created using the Dataframe() method and just like a series, it can also be from different file types and data structures.
Python Pandas Creating Dataframe
import pandas as pd

# Calling DataFrame constructor
df = pd.DataFrame()
print(df)

# list of strings
lst = ['Geeks', 'For', 'Geeks', 'is',
            'portal', 'for', 'Geeks']

# Calling DataFrame constructor on list
df = pd.DataFrame(lst)
Creating Dataframe from CSV
We can create a dataframe from the CSV files using the read_csv() function.
Note: This dataset can be downloaded from here.
Python Pandas read CSV
import pandas as pd

# Reading the CSV file
df = pd.read_csv("Iris.csv")

# Printing top 5 rows
df.head()
Filtering DataFrame
Pandas dataframe.filter() function is used to Subset rows or columns of dataframe according to labels in the specified index. Note that this routine does not filter a dataframe on its contents. The filter is applied to the labels of the index.
Python Pandas Filter Dataframe
import pandas as pd

# Reading the CSV file
df = pd.read_csv("Iris.csv")

# applying filter function
df.filter(["Species", "SepalLengthCm", "SepalLengthCm"]).head()
Sorting DataFrame
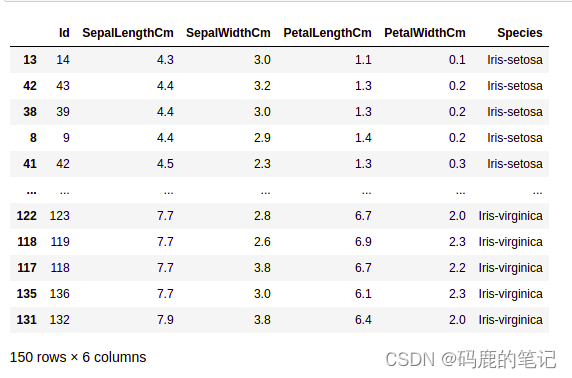
In order to sort the data frame in pandas, the function sort_values() is used. Pandas sort_values() can sort the data frame in Ascending or Descending order.
Python Pandas Sorting Dataframe in Ascending Order
Pandas GroupBy
Groupby is a pretty simple concept. We can create a grouping of categories and apply a function to the categories. In real data science projects, you’ll be dealing with large amounts of data and trying things over and over, so for efficiency, we use the Groupby concept. Groupby mainly refers to a process involving one or more of the following steps they are:
…
→More


![buuctf_练[安洵杯 2019]easy_web](https://img-blog.csdnimg.cn/img_convert/1201043fd1fb9dc76c4791209cdfeb59.png)