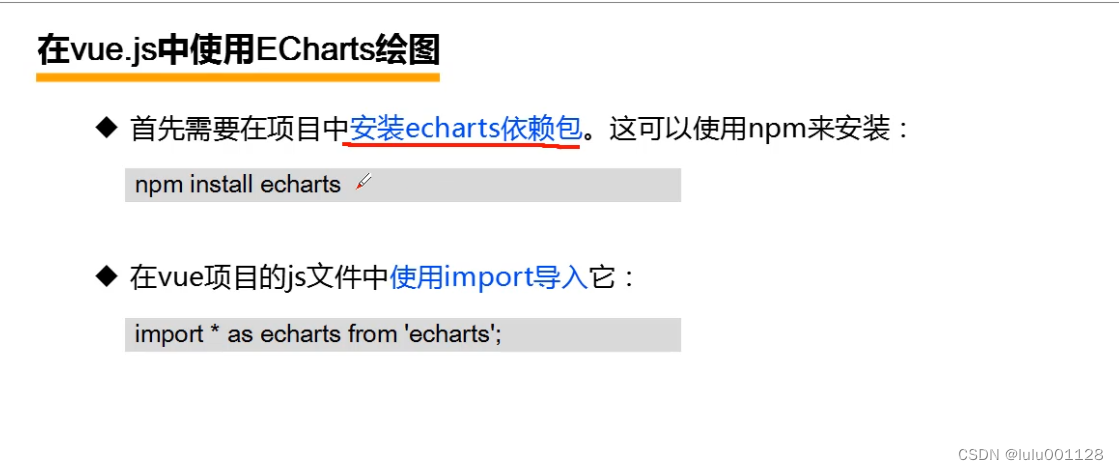

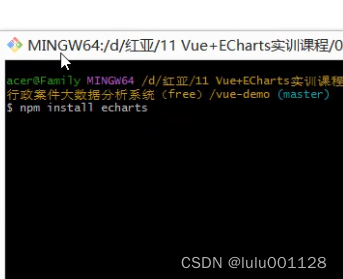
安装echarts时,需进入到vue-demo的目录下

与第二章操作步骤相同
删除全部默认效果

将上述60像素删除,设置整个背景宽,高等

设置标题


设置图表结构(左右两个盒子)

设置图表边框,宽,高,样式,幅度

绘制图表前提,导入echarts
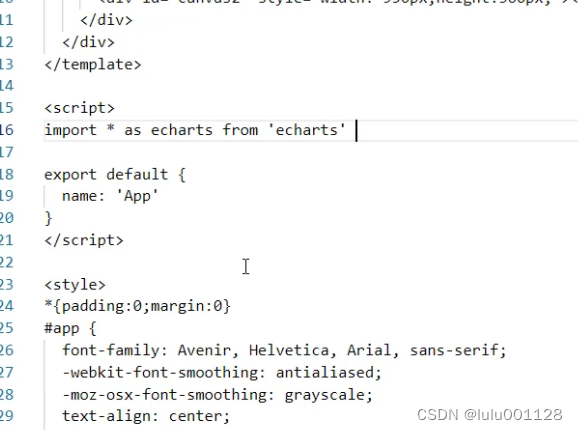
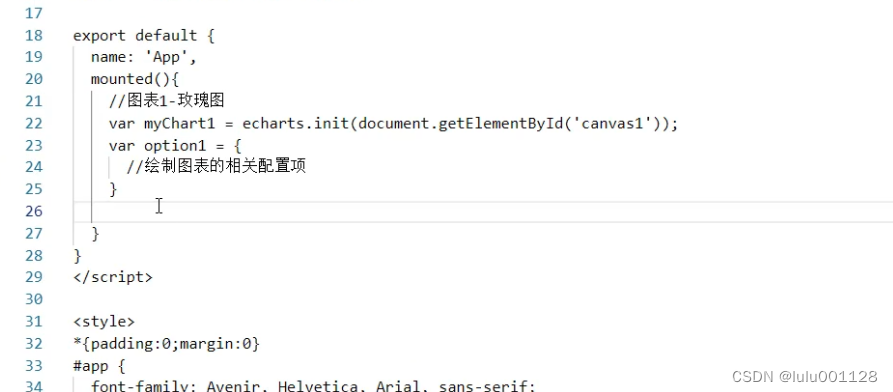
准备开始编写代码,所有代码(什么柱折图,玫瑰图)都写在mounted(){}里面

初始化echarts实例
后在option中编写代码
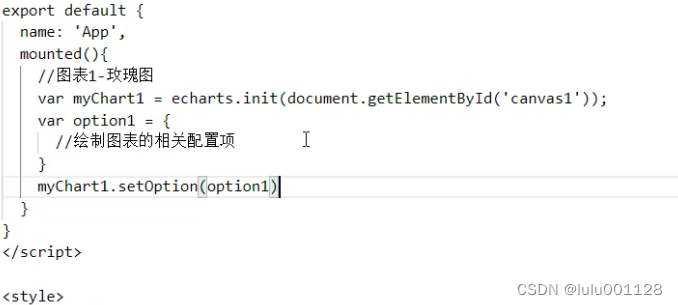
如何将图表展示出来
上述代码
html
<template>
  <h2>法院行政案件大数据分析系统</h2>
  <div>
    <div class="container1">

    </div>
    <div class="container2">

    </div>
  </div>
</template>
css
*{
  padding:0;
  margin:0;
}
#app {
  font-family: Avenir, Helvetica, Arial, sans-serif;
  -webkit-font-smoothing: antialiased;
  -moz-osx-font-smoothing: grayscale;
  text-align: center;
  color: #2c3e50;
  width:100%;
  height:760px;
  background:url(./assets/bg.webp) no-repeat;
  background-size: contain;
}
h2{
  color:#fff;
  line-height:60px;
}
.container1{
  width:330px;
  height:660px;
  border:1px solid #0043A0;
  float:left;
  margin-left:15px;
  padding:10px;
}
.container2{
  width:930px;
  height:660px;
  border:1px solid #0043A0;
  float:right;
  margin-right:15px;
  padding:10px;
}
编写图表

在series中设置图表类型

添加对应数据和数据值
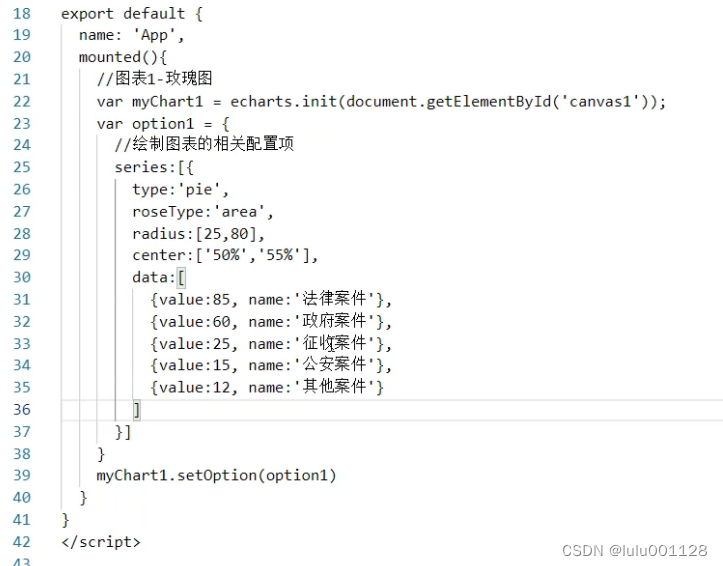
修改图表字体颜色,字体大小,使用itemStyle

图表标题

提示信息tooltip,还需加上name

html
<div id="canvas1" style="width: 340px;height:200px;"></div>
js
import * as echarts from 'echarts'
export default {
  name: 'App',
  mounted () {
    //图表1-玫瑰图
    // 根据准备好的dom初始化echarts实例
    var myChart1 = echarts.init(document.getElementById('canvas1'));
    var option1={
        title : {
        text: '案件类型领域分布',
        textStyle:{
          color:'#EDEDED',
          fontSize:14
        }
      },
      tooltip : {
        trigger: 'item',
        formatter: "{a} <br/>{b} : {c} ({d}%)"
      },
      series : [{
        name:'案件类型',
        type:'pie',
        radius : [25, 80], // 图表内外半径大小
        center : ['50%', '55%'], // 图表位置
        roseType : 'area',
        // 修改字体颜色的代码begin
        itemStyle: {
          normal: {
            label: {
              textStyle: {
                color:'#EDEDED',
                fontSize: 12
              }
            }
          }
        },
        data:[
          {value:85, name:'法律案件'},
          {value:60, name:'政府案件'},
          {value:25, name:'征收案件'},
          {value:15, name:'公安案件'},
          {value:12, name:'其他案件'}
        ]
      }]
    }
    myChart1.setOption(option1);
  }
}
柱折混合图
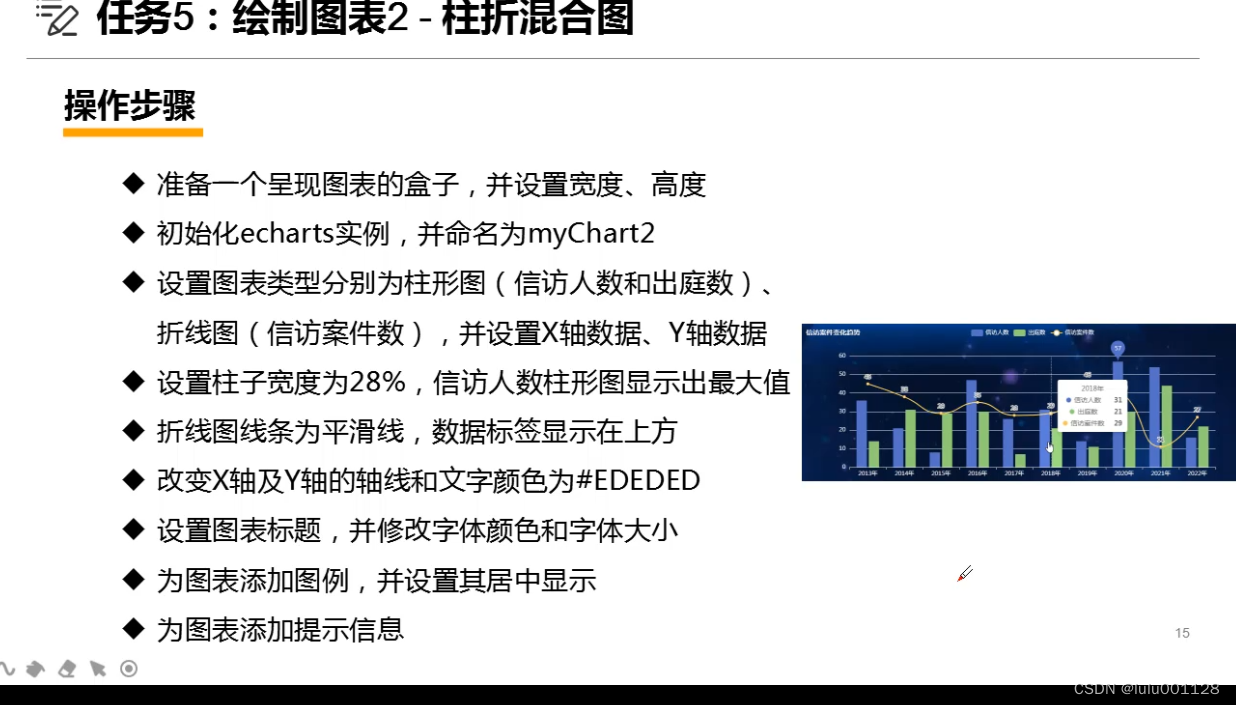


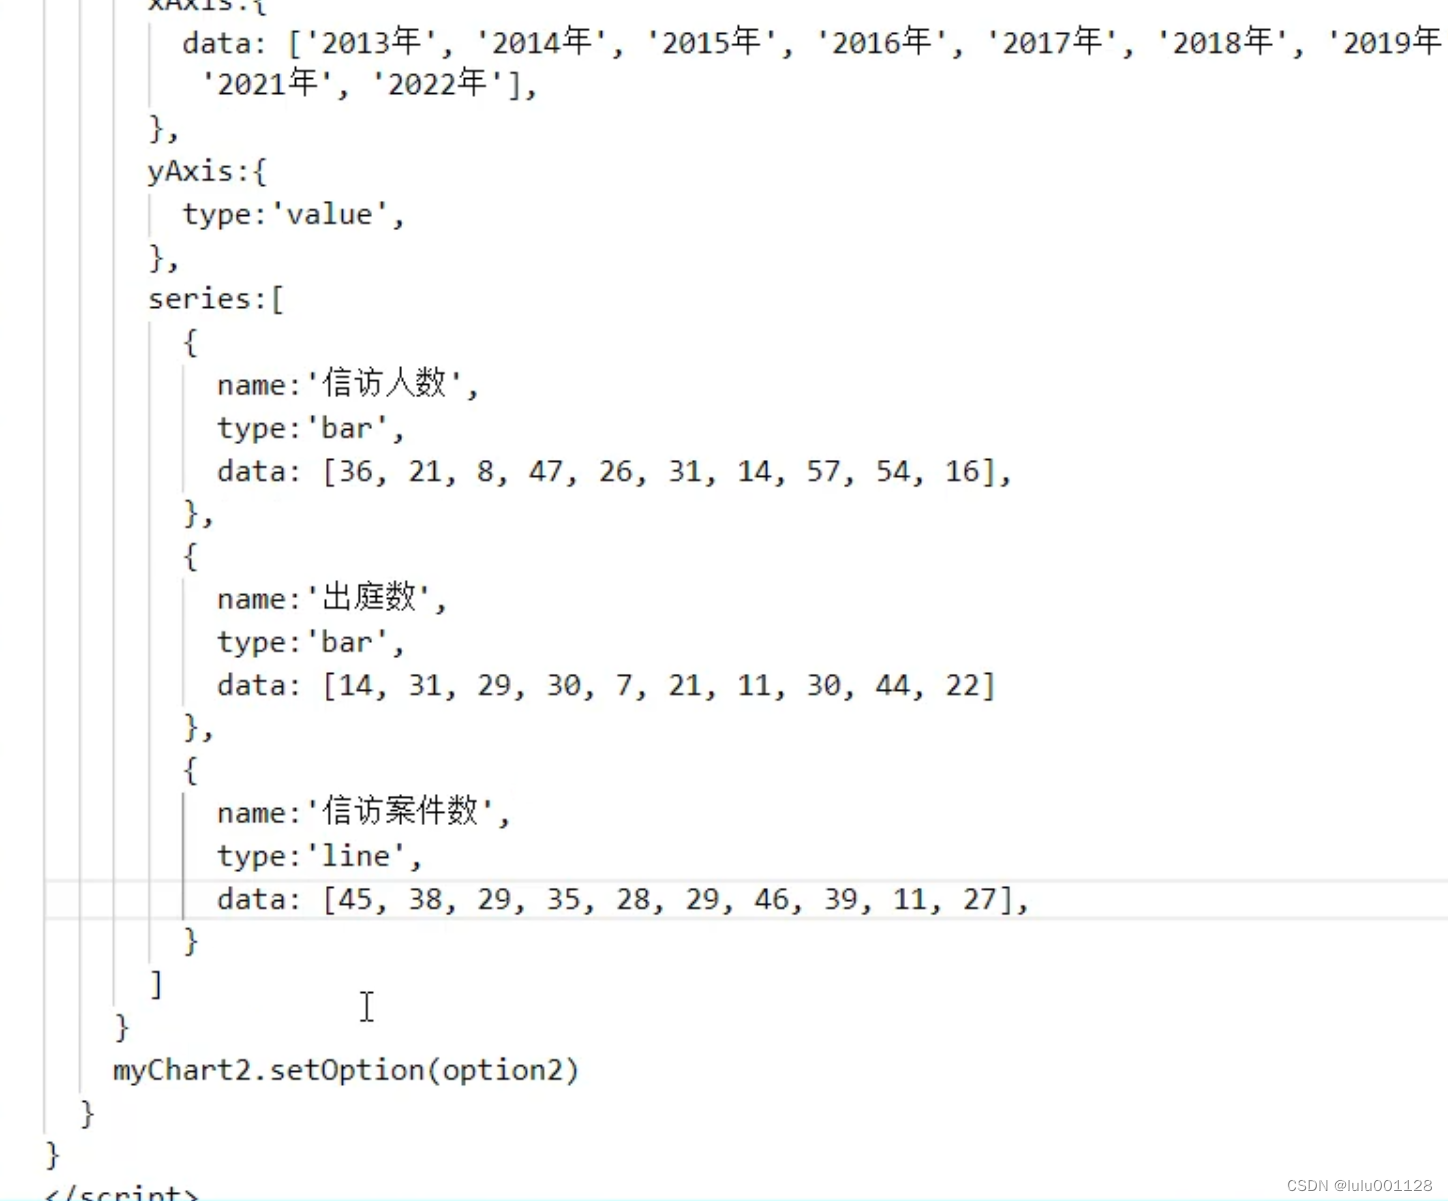
设置图表类型,有几个图形就需要在series中有几个花括号{}
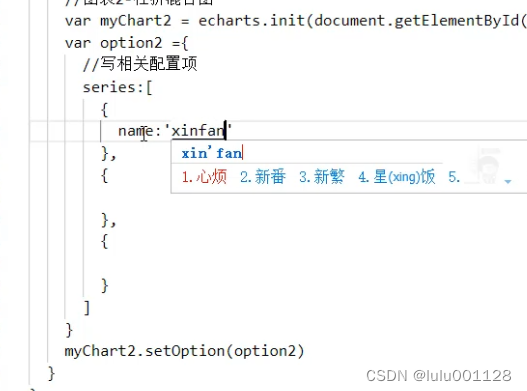
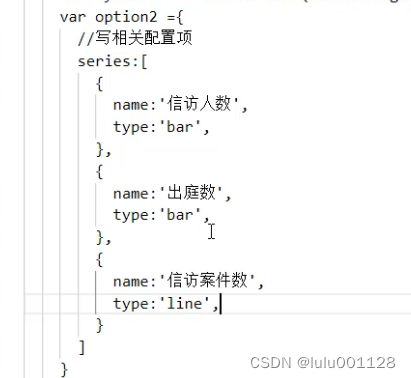
添加X轴Y轴数据,将把type设置为value时就可以在series中找对应的数据

设置柱子宽度 barwidth
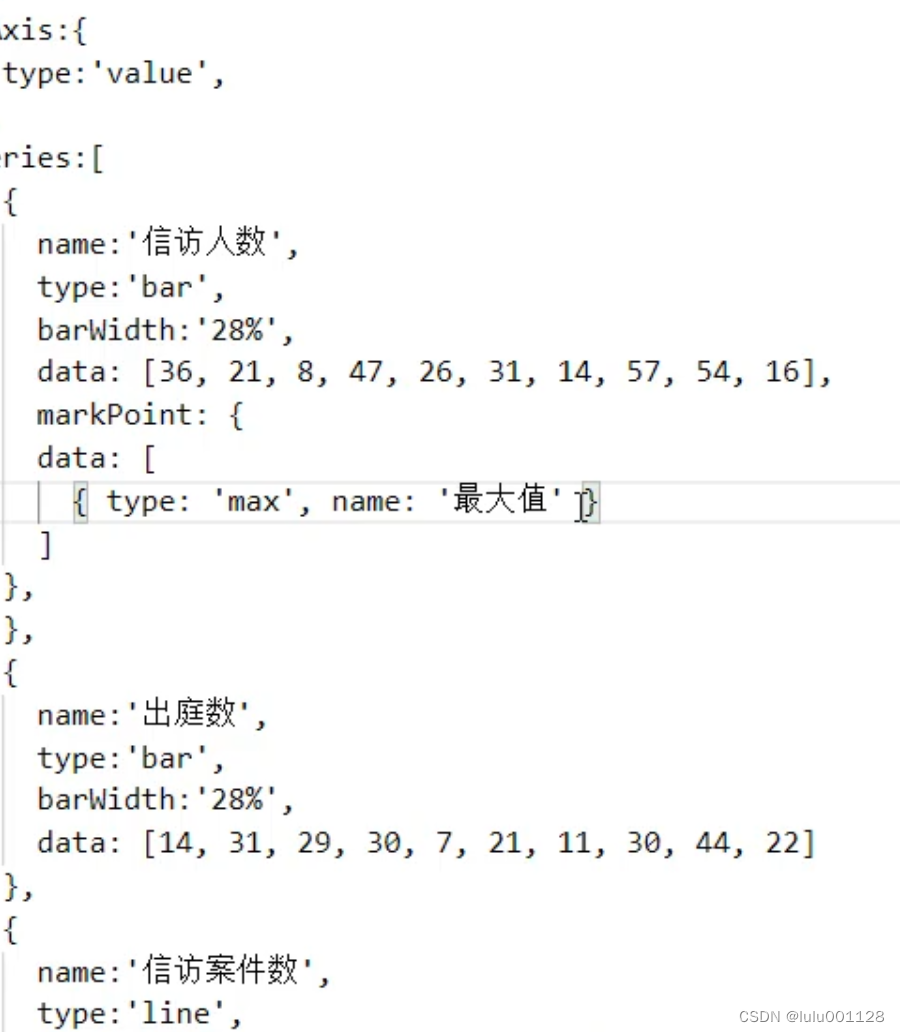
折线图
改变X,Y轴颜色
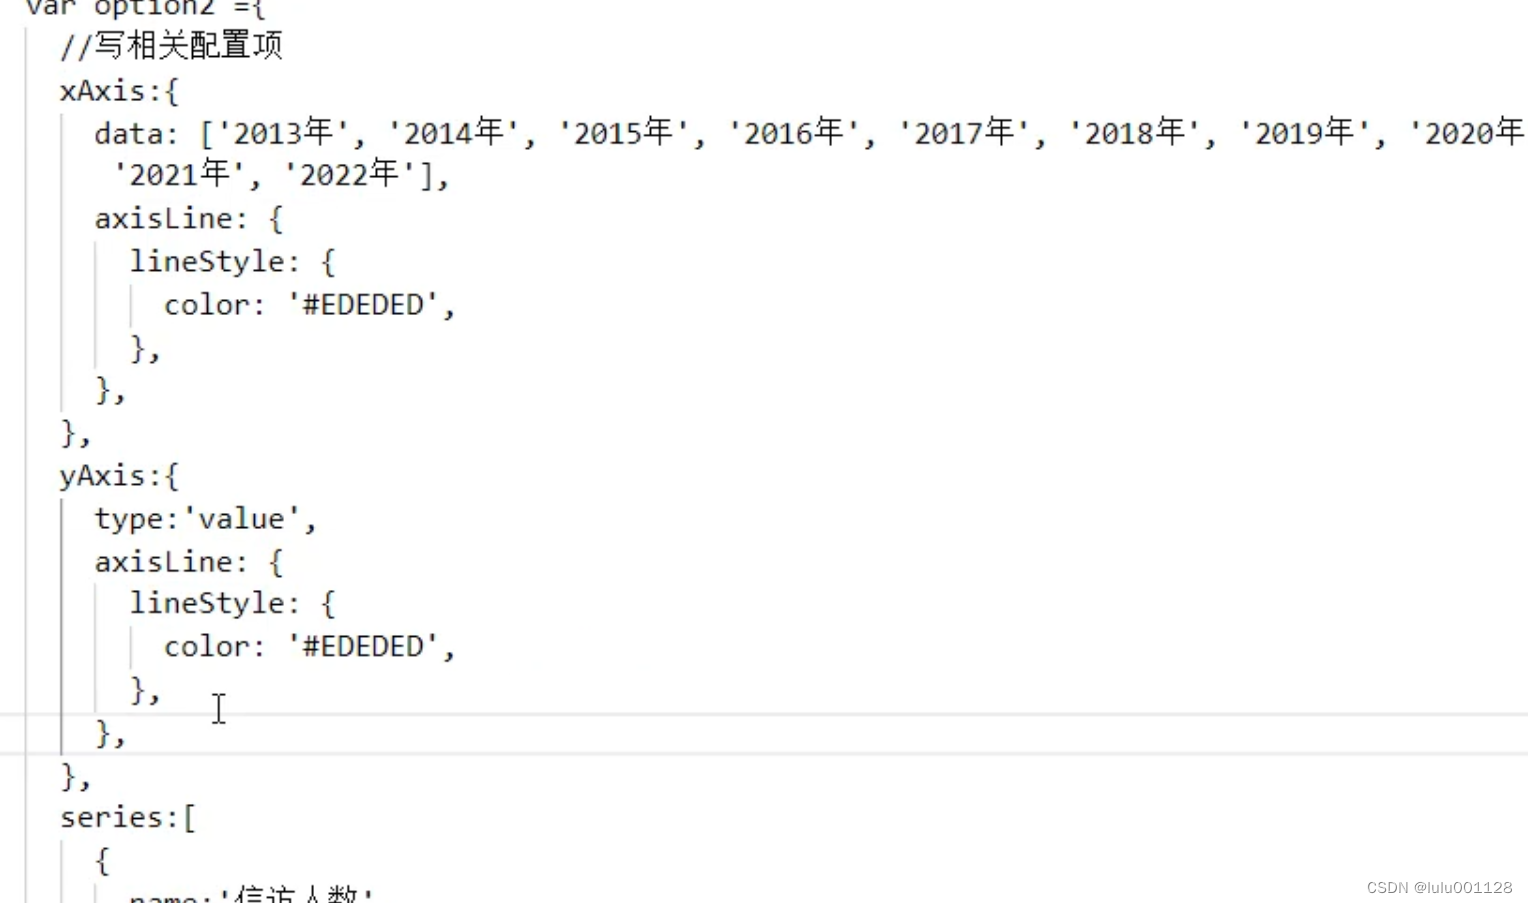
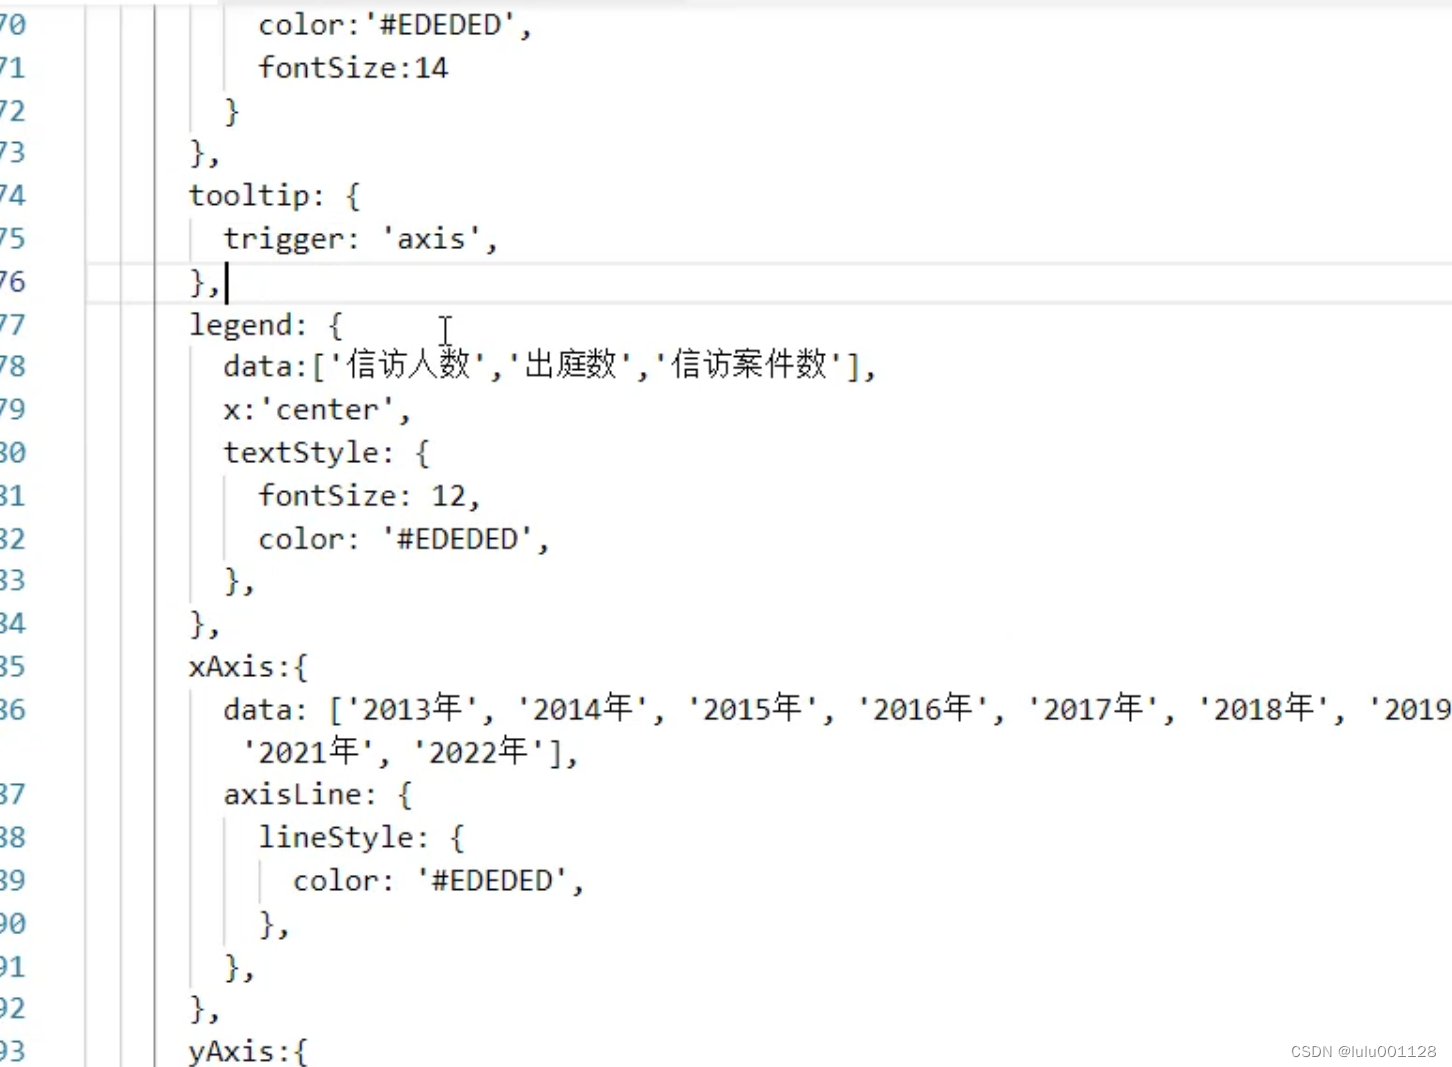
标题

图例

提示信息
html
<div id="canvas2" style="width: 950px;height:360px;"></div>
js
//图表4-折柱混合图
    // 根据准备好的dom初始化echarts实例
    var myChart2= echarts.init(document.getElementById('canvas2'));
    var option2={
      title:{
        text:'信访案件变化趋势',
        textStyle:{
          color:'#EDEDED',
          fontSize:14
        }
      },
      tooltip: {
        trigger: 'axis',
      },
      legend: {
        data:['信访人数','出庭数','信访案件数'],
        x:'center',
        textStyle: {
          fontSize: 12,
          color: '#EDEDED',
        },
      },
      xAxis: {
        data: ['2013年', '2014年', '2015年', '2016年', '2017年', '2018年', '2019年', '2020年', '2021年', '2022年'],
        axisLine: {
          lineStyle: {
            color: '#EDEDED',
          },
        },
      },
      yAxis: {
        type: 'value',
        axisLine: {
          lineStyle: {
            color: '#EDEDED',
          },
        },
      },
      series: [{
        name: '信访人数',
        type: 'bar',
        barWidth : '28%',
        data: [36, 21, 8, 47, 26, 31, 14, 57, 54, 16],
        markPoint: {
            data: [
                { type: 'max', name: '最大值' }
            ]
        },
      },{
        name: '出庭数',
        type: 'bar',
        barWidth : '28%',
        data: [14, 31, 29, 30, 7, 21, 11, 30, 44, 22]
      },{
        name: '信访案件数',
        type: 'line',
        smooth:true,
        data: [45, 38, 29, 35, 28, 29, 46, 39, 11, 27],
        label: {
          show: true,
          position: 'top',
          textStyle: {
            fontSize: 12
          }
        }
      }]
    }
    myChart2.setOption(option2);






![[debug/main.o] Error 1 QtCreator编译报错](https://img-blog.csdnimg.cn/bd62bd66eb324255b8ec066a12cbeab3.gif)
