前言
- tig对应的服务是influxdb grafana telegraf
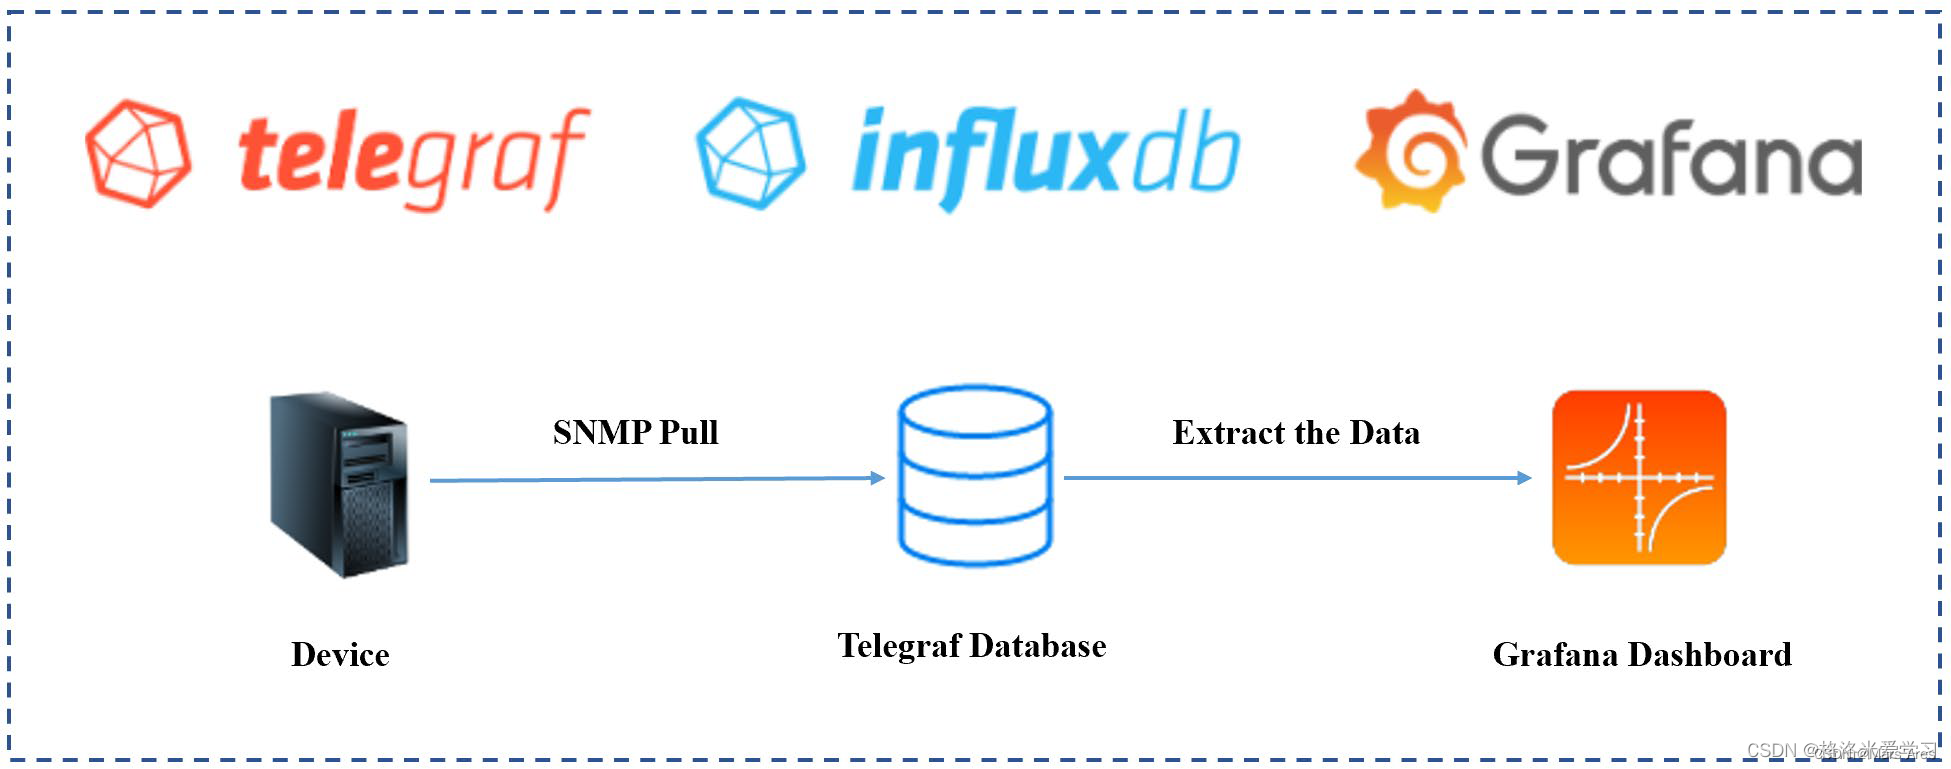
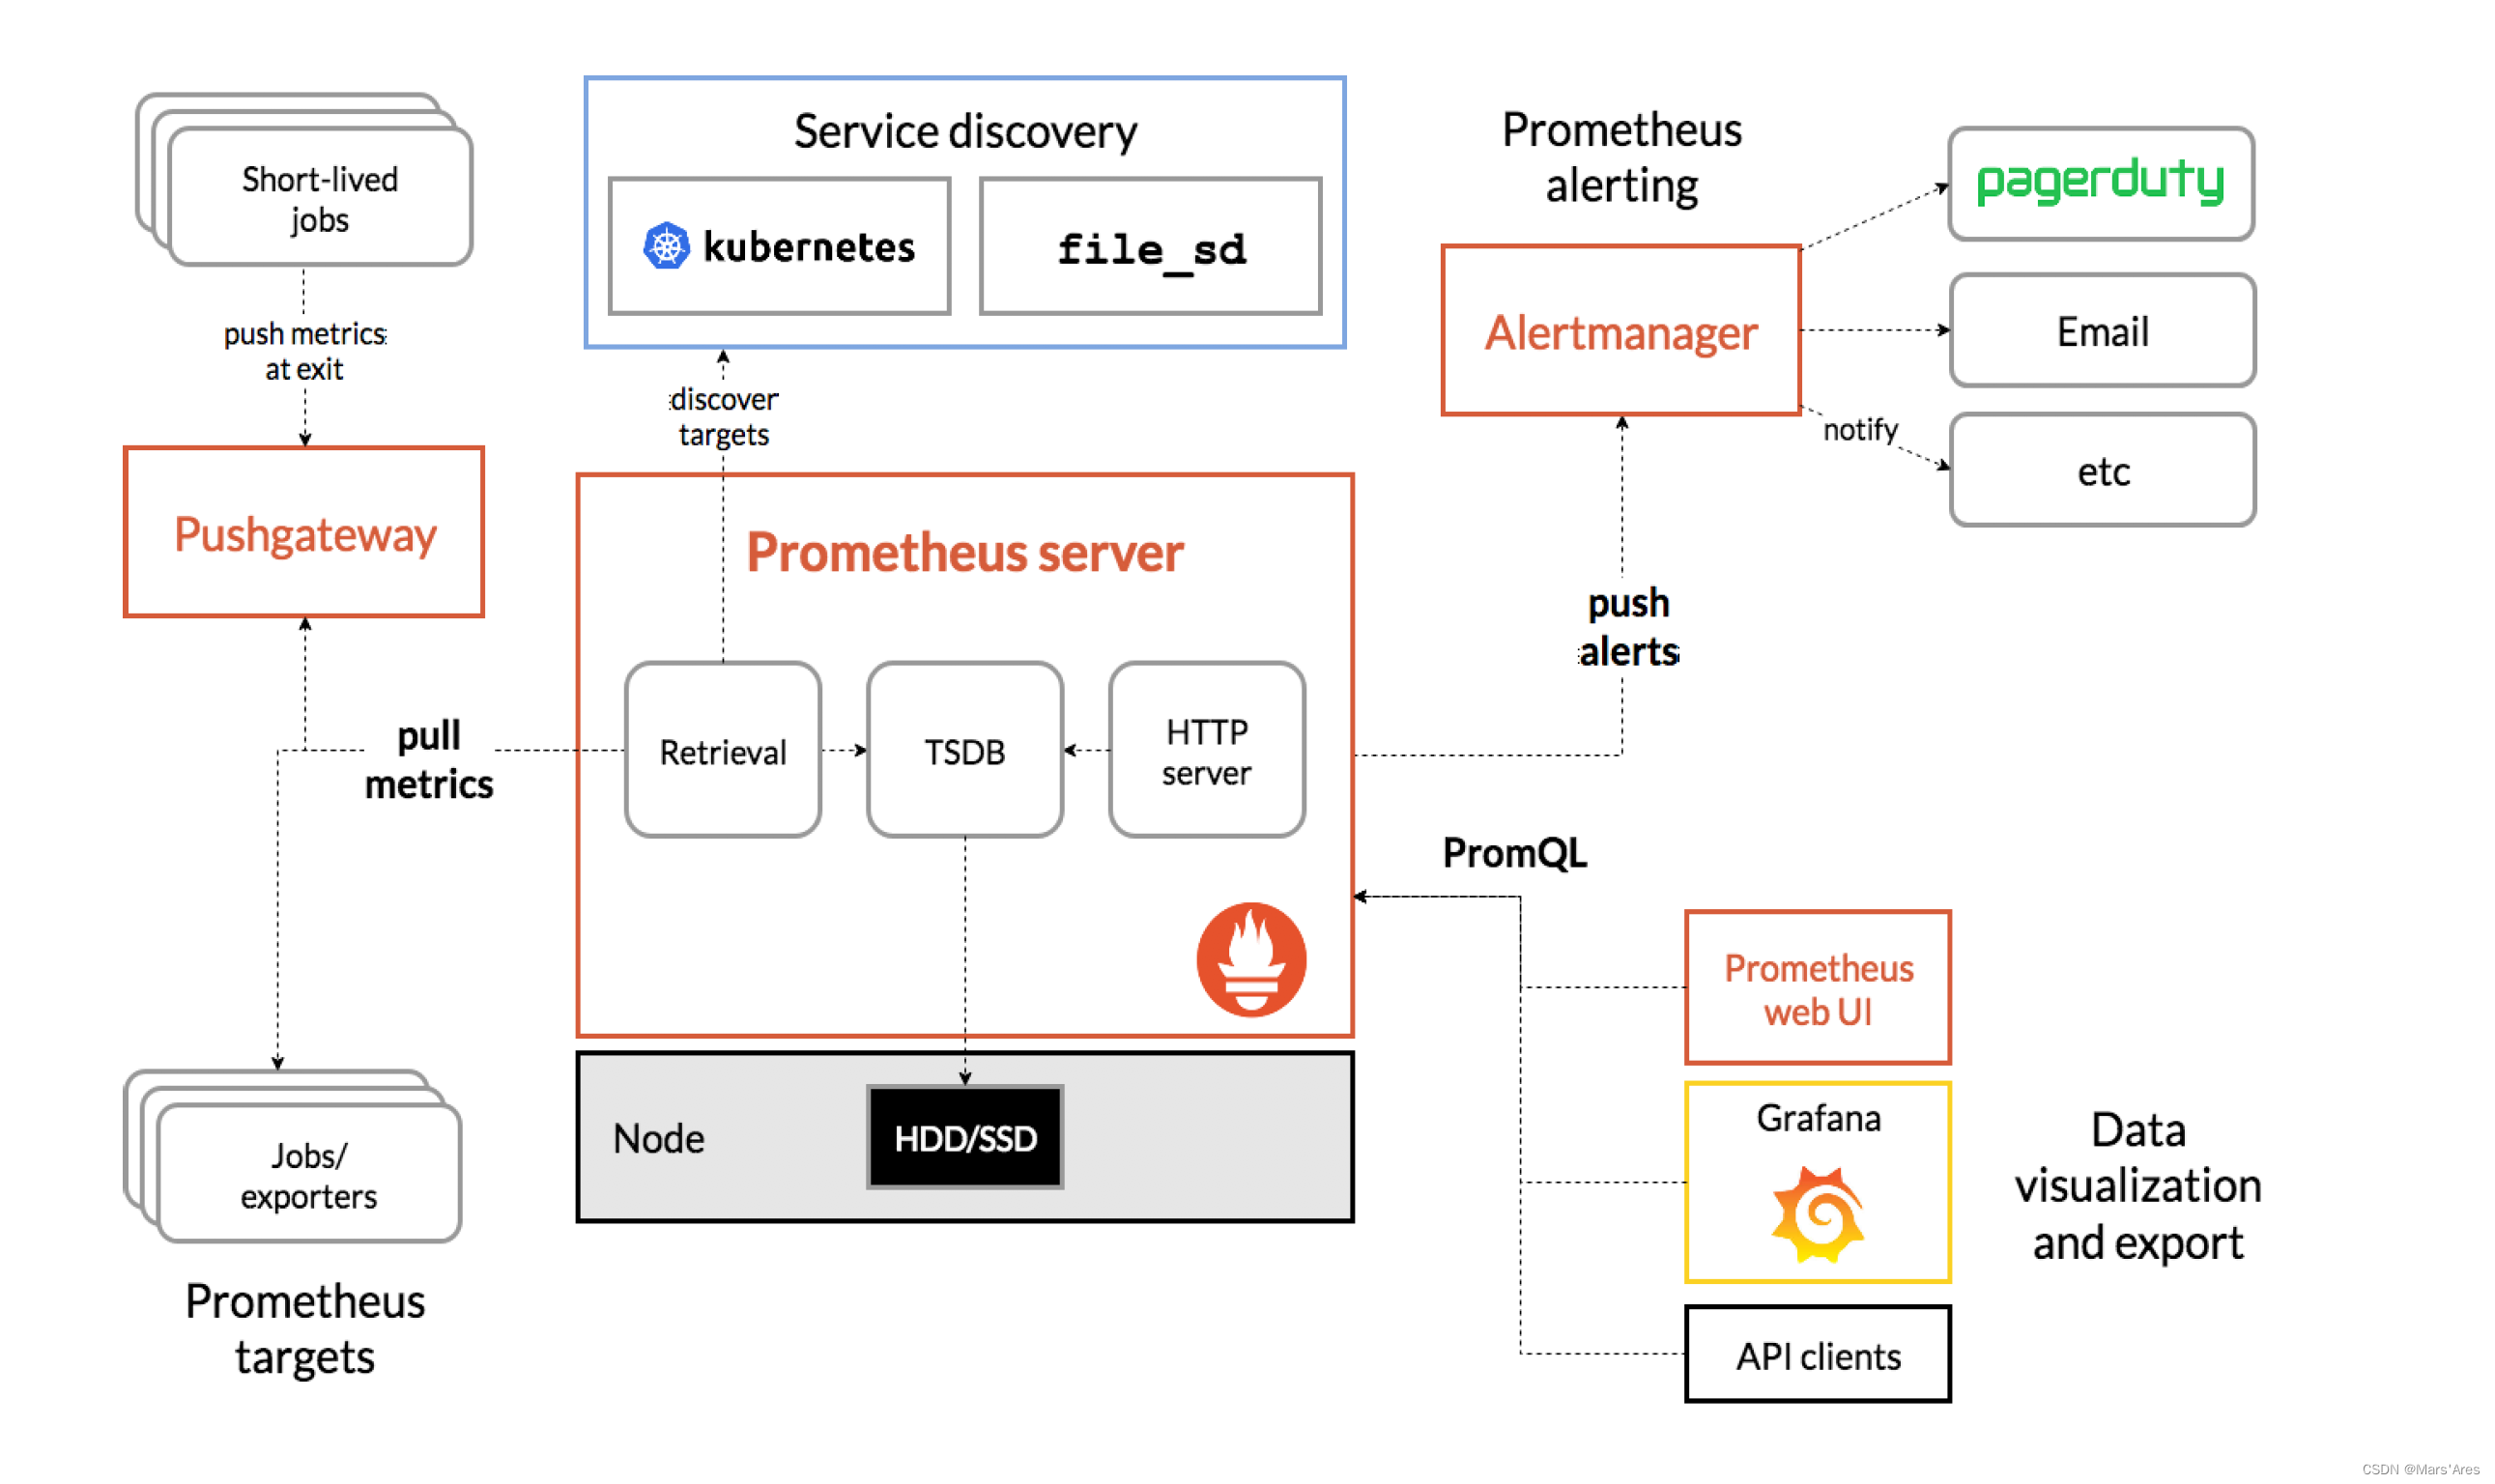
- 此架构比传统的promethus架构更为简洁,虽然influxdb开源方案没有集群部署,但是对于中小型服务监控需求该方案简单高效
- 本文以docker-compose来演示这套监控体系的快速搭建和效果。
部署
docker-compose.yaml
version: '3'
networks:
  monitor:
    driver: bridge
#配置应用
services:
  #grafana 报警推送
  #账号密码 prometheusalert prometheusalert
  prometheusalert:
    image: feiyu563/prometheus-alert
    container_name:   prometheusalert
    hostname:   prometheusalert
    restart: always
    ports:
      - 8087:8080
    networks:
      - monitor
    volumes:
      - ./docker/prometheusalert/conf:/app/conf
      - ./docker/prometheusalert/db:/app/db
    environment:
      - PA_LOGIN_USER=prometheusalert
      - PA_LOGIN_PASSWORD=prometheusalert
      - PA_TITLE=PrometheusAlert
      - PA_OPEN_FEISHU=1
  #界面展示 默认账号密码 admin admin
  grafana:
    image: grafana/grafana
    container_name: grafana
    hostname: grafana
    restart: always
    volumes:
      - ./docker/grafana/data/grafana:/var/lib/grafana
    ports:
      - "3000:3000"
    networks:
      - monitor

  #influxdb数据库v2自带管理端
  #账号密码 root root
  influxdb:
    image: influxdb
    container_name: influxdb
    environment:
      INFLUX_DB: test                   # 可能无效
      INFLUXDB_USER: root               # 可能无效
      INFLUXDB_USER_PASSWORD: root      # 可能无效
    ports:
      - "8086:8086"
    restart: always
    volumes:
      - ./docker/influxdb/:/var/lib/influxdb
    networks:
      - monitor
  #indluxdb数据库v1
  #influxdb1x:
  #  image: influxdb:1.8
  #  container_name: influxdb1.8
  #  environment:
  #    INFLUXDB_DB: test
  #    INFLUXDB_ADMIN_ENABLED: true
  #    INFLUXDB_ADMIN_USER: root
  #    INFLUXDB_ADMIN_PASSWORD: root
  #  ports:
  #    - "8098:8086"
  #  restart: always
  #  volumes:
  #    - ./docker/influxdb1x/influxdb1x.conf:/etc/influxdb/influxdb.conf
  #    - ./docker/influxdb1x/:/var/lib/influxdb
  #  networks:
  #    - monitor
telegraf 安装 官方文档
# telegraf是采集端,部署于监控数据的源头,详细的部署教程可以通过官网,下面以linux服务器为例子
# 编写源
cat <<EOF | sudo tee /etc/yum.repos.d/influxdb.repo
[influxdb]
name = InfluxData Repository - Stable
baseurl = https://repos.influxdata.com/stable/\$basearch/main
enabled = 1
gpgcheck = 1
gpgkey = https://repos.influxdata.com/influxdata-archive_compat.key
EOF

# 安装
sudo yum install telegraf

# 校验
telegraf --help
使用
- 登陆influxdb http://localhost:8086.
- 首次登陆会创建账号
- org是分区意思
- buk是库的概念


- 配置telegraf采集etl流程 官方telegraf采集插件介绍
- 配置influxdb数据的访问的token
- 配置telegraf采集的配置文件
- 采集端启动telegraf采集etl
a. 配置token b. 可以通过平台生成配置文件,也可以自己保存配置文件。平台生成配置则提供http接口远程提供配置下载
以nginx文件为例提供配置
telegraf.conf
# Configuration for telegraf agent
# telegraf 采集端配置都是默认配置
[agent]
  ## Default data collection interval for all inputs
  interval = "10s"
  ## Rounds collection interval to 'interval'
  ## ie, if interval="10s" then always collect on :00, :10, :20, etc.
  round_interval = true

  ## Telegraf will send metrics to outputs in batches of at most
  ## metric_batch_size metrics.
  ## This controls the size of writes that Telegraf sends to output plugins.
  metric_batch_size = 1000

  ## Maximum number of unwritten metrics per output.  Increasing this value
  ## allows for longer periods of output downtime without dropping metrics at the
  ## cost of higher maximum memory usage.
  metric_buffer_limit = 10000

  ## Collection jitter is used to jitter the collection by a random amount.
  ## Each plugin will sleep for a random time within jitter before collecting.
  ## This can be used to avoid many plugins querying things like sysfs at the
  ## same time, which can have a measurable effect on the system.
  collection_jitter = "0s"

  ## Default flushing interval for all outputs. Maximum flush_interval will be
  ## flush_interval + flush_jitter
  flush_interval = "10s"
  ## Jitter the flush interval by a random amount. This is primarily to avoid
  ## large write spikes for users running a large number of telegraf instances.
  ## ie, a jitter of 5s and interval 10s means flushes will happen every 10-15s
  flush_jitter = "0s"

  ## By default or when set to "0s", precision will be set to the same
  ## timestamp order as the collection interval, with the maximum being 1s.
  ##   ie, when interval = "10s", precision will be "1s"
  ##       when interval = "250ms", precision will be "1ms"
  ## Precision will NOT be used for service inputs. It is up to each individual
  ## service input to set the timestamp at the appropriate precision.
  ## Valid time units are "ns", "us" (or "µs"), "ms", "s".
  precision = ""

  ## Log at debug level.
  # debug = false
  ## Log only error level messages.
  # quiet = false

  ## Log target controls the destination for logs and can be one of "file",
  ## "stderr" or, on Windows, "eventlog".  When set to "file", the output file
  ## is determined by the "logfile" setting.
  # logtarget = "file"

  ## Name of the file to be logged to when using the "file" logtarget.  If set to
  ## the empty string then logs are written to stderr.
  # logfile = ""

  ## The logfile will be rotated after the time interval specified.  When set
  ## to 0 no time based rotation is performed.  Logs are rotated only when
  ## written to, if there is no log activity rotation may be delayed.
  # logfile_rotation_interval = "0d"

  ## The logfile will be rotated when it becomes larger than the specified
  ## size.  When set to 0 no size based rotation is performed.
  # logfile_rotation_max_size = "0MB"

  ## Maximum number of rotated archives to keep, any older logs are deleted.
  ## If set to -1, no archives are removed.
  # logfile_rotation_max_archives = 5

  ## Pick a timezone to use when logging or type 'local' for local time.
  ## Example: America/Chicago
  # log_with_timezone = ""

  ## Override default hostname, if empty use os.Hostname()
  hostname = ""
  ## If set to true, do no set the "host" tag in the telegraf agent.
  omit_hostname = false

# influxdb_v2 输出插件配置 这里需要配置的
# 数据库地址:urls 分区:organization 库:bucket 授权token:token
[[outputs.influxdb_v2]]
  ## The URLs of the InfluxDB cluster nodes.
  ##
  ## Multiple URLs can be specified for a single cluster, only ONE of the
  ## urls will be written to each interval.
  ##   ex: urls = ["https://us-west-2-1.aws.cloud2.influxdata.com"]
  urls = ["http://localhost:8086"]

  ## Token for authentication.
  token = "上一步创建的token"

  ## Organization is the name of the organization you wish to write to; must exist.
  organization = "创建的分区 这里是test"

  ## Destination bucket to write into.
  bucket = "创建的表 这里是test"

  ## The value of this tag will be used to determine the bucket.  If this
  ## tag is not set the 'bucket' option is used as the default.
  # bucket_tag = ""

  ## If true, the bucket tag will not be added to the metric.
  # exclude_bucket_tag = false

  ## Timeout for HTTP messages.
  # timeout = "5s"

  ## Additional HTTP headers
  # http_headers = {"X-Special-Header" = "Special-Value"}

  ## HTTP Proxy override, if unset values the standard proxy environment
  ## variables are consulted to determine which proxy, if any, should be used.
  # http_proxy = "http://corporate.proxy:3128"

  ## HTTP User-Agent
  # user_agent = "telegraf"

  ## Content-Encoding for write request body, can be set to "gzip" to
  ## compress body or "identity" to apply no encoding.
  # content_encoding = "gzip"

  ## Enable or disable uint support for writing uints influxdb 2.0.
  # influx_uint_support = false

  ## Optional TLS Config for use on HTTP connections.
  # tls_ca = "/etc/telegraf/ca.pem"
  # tls_cert = "/etc/telegraf/cert.pem"
  # tls_key = "/etc/telegraf/key.pem"
  ## Use TLS but skip chain & host verification
  # insecure_skip_verify = false

# Parse the new lines appended to a file
# tail 输入插件配置,以监听nginx日志为例 需要配置
# 监听文件位置 files
# nginx行数据解析表达式 grok_patterns 提取监控字段,gork表达式不单独说明了
# nginx监控数据存储表名 name_override
[[inputs.tail]]
  ## File names or a pattern to tail.
  ## These accept standard unix glob matching rules, but with the addition of
  ## ** as a "super asterisk". ie:
  ##   "/var/log/**.log"  -> recursively find all .log files in /var/log
  ##   "/var/log/*/*.log" -> find all .log files with a parent dir in /var/log
  ##   "/var/log/apache.log" -> just tail the apache log file
  ##   "/var/log/log[!1-2]*  -> tail files without 1-2
  ##   "/var/log/log[^1-2]*  -> identical behavior as above
  ## See https://github.com/gobwas/glob for more examples
  ##
  files = ["/logs/nginx/access_main.log"]

  ## Read file from beginning.
  #from_beginning = false

  ## Whether file is a named pipe
  # pipe = false

  ## Method used to watch for file updates.  Can be either "inotify" or "poll".
  # watch_method = "inotify"

  ## Maximum lines of the file to process that have not yet be written by the
  ## output.  For best throughput set based on the number of metrics on each
  ## line and the size of the output's metric_batch_size.
  # max_undelivered_lines = 1000

  ## Character encoding to use when interpreting the file contents.  Invalid
  ## characters are replaced using the unicode replacement character.  When set
  ## to the empty string the data is not decoded to text.
  ##   ex: character_encoding = "utf-8"
  ##       character_encoding = "utf-16le"
  ##       character_encoding = "utf-16be"
  ##       character_encoding = ""
  # character_encoding = ""

  ## Data format to consume.
  ## Each data format has its own unique set of configuration options, read
  ## more about them here:
  ## https://github.com/influxdata/telegraf/blob/master/docs/DATA_FORMATS_INPUT.md
  grok_patterns = ["%{NGINX_ACCESS_LOG}"]
  name_override = "nginx_access_log"
  #grok_custom_pattern_files = []
  #grok_custom_patterns = '''
  #NGINX_ACCESS_LOG %{IP:remote_addr} - (-|%{WORD:remote_user}) [%{HTTPDATE:time_local}] %{BASE10NUM:request_time:float} (-|%{BASE10NUM:upstream_response_time:float}) %{IPORHOST:host} %{QS:request} %{NUMBER:status:int} %{NUMBER:body_bytes_sent:int} %{QS:referrer} %{QS:agent} %{IPORHOST:xforwardedfor}
  #'''
  grok_custom_patterns = '''
  NGINX_ACCESS_LOG %{IP:remote_addr} - (-|%{WORD:remote_user:drop}) \[%{HTTPDATE:ts:ts}\] %{BASE10NUM:request_time:float} %{BASE10NUM:upstream_response_time:float} %{IPORHOST:host:tag} "(?:%{WORD:verb:drop} %{NOTSPACE:request:tag}(?: HTTP/%{NUMBER:http_version:drop})?|%{DATA:rawrequest})" %{NUMBER:status:tag} (?:%{NUMBER:resp_bytes}|-)  %{QS:referrer:drop} %{QS:agent:drop} %{QS:xforwardedfor:drop}
  '''

  grok_timezone = "Local"
  data_format = "grok"

  ## Set the tag that will contain the path of the tailed file. If you don't want this tag, set it to an empty string.
  # path_tag = "path"

  ## multiline parser/codec
  ## https://www.elastic.co/guide/en/logstash/2.4/plugins-filters-multiline.html
  #[inputs.tail.multiline]
    ## The pattern should be a regexp which matches what you believe to be an
	## indicator that the field is part of an event consisting of multiple lines of log data.
    #pattern = "^\s"

    ## This field must be either "previous" or "next".
	## If a line matches the pattern, "previous" indicates that it belongs to the previous line,
	## whereas "next" indicates that the line belongs to the next one.
    #match_which_line = "previous"

    ## The invert_match field can be true or false (defaults to false).
    ## If true, a message not matching the pattern will constitute a match of the multiline
	## filter and the what will be applied. (vice-versa is also true)
    #invert_match = false

    ## After the specified timeout, this plugin sends a multiline event even if no new pattern
	## is found to start a new event. The default timeout is 5s.
    #timeout = 5s
gork表达式举例
# nginx 日志格式
'$remote_addr - $remote_user [$time_local] $request_time $upstream_response_time $host "$request" '
                      '$status $body_bytes_sent  "$http_referer" '
                      '"$http_user_agent" "$http_x_forwarded_for"'
 # grok  解析格式
  NGINX_ACCESS_LOG %{IP:remote_addr} - (-|%{WORD:remote_user:drop}) \[%{HTTPDATE:ts:ts}\] %{BASE10NUM:request_time:float} %{BASE10NUM:upstream_response_time:float} %{IPORHOST:host:tag} "(?:%{WORD:verb:drop} %{NOTSPACE:request:tag}(?: HTTP/%{NUMBER:http_version:drop})?|%{DATA:rawrequest})" %{NUMBER:status:tag} (?:%{NUMBER:resp_bytes}|-)  %{QS:referrer:drop} %{QS:agent:drop} %{QS:xforwardedfor:drop}

# nginx 日志举例
1.1.1.2 - - [30/Jan/2023:02:27:24 +0000] 0.075 0.075 xxx.xxx.xxx "POST /api/xxx/xxx/xxx HTTP/1.1" 200 69  "https://xxx.xxx.xxx/" "Mozilla/5.0 (iPhone; CPU iPhone OS 16_3 like Mac OS X) AppleWebKit/605.1.15 (KHTML, like Gecko) Mobile/15E148" "1.1.1.1"

# grok 解析变量如下再取变量生成influxdb行协议
{
  "NGINX_ACCESS_LOG": [
    [
      "1.1.1.2 - - [30/Jan/2023:02:27:24 +0000] 0.075 0.075 prod.webcomicsapp.com "POST /api/xxx/xxx/xxx HTTP/1.1" 200 69  "https://xxx.xxx.xxx/" "Mozilla/5.0 (iPhone; CPU iPhone OS 16_3 like Mac OS X) AppleWebKit/605.1.15 (KHTML, like Gecko) Mobile/15E148" "1.46.138.190""
    ]
  ],
  "remote_addr": [
    [
      "1.1.1.2"
    ]
  ],
  "IPV6": [
    [
      null,
      null
    ]
  ],
  "IPV4": [
    [
      "1.1.1.2",
      null
    ]
  ],
  "remote_user": [
    [
      null
    ]
  ],
  "ts": [
    [
      "30/Jan/2023:02:27:24 +0000"
    ]
  ],
  "MONTHDAY": [
    [
      "30"
    ]
  ],
  "MONTH": [
    [
      "Jan"
    ]
  ],
  "YEAR": [
    [
      "2023"
    ]
  ],
  "TIME": [
    [
      "02:27:24"
    ]
  ],
  "HOUR": [
    [
      "02"
    ]
  ],
  "MINUTE": [
    [
      "27"
    ]
  ],
  "SECOND": [
    [
      "24"
    ]
  ],
  "INT": [
    [
      "+0000"
    ]
  ],
  "request_time": [
    [
      "0.075"
    ]
  ],
  "upstream_response_time": [
    [
      "0.075"
    ]
  ],
  "host": [
    [
      "xxx.xxx.xxx"
    ]
  ],
  "HOSTNAME": [
    [
      "xxx.xxx.xxx"
    ]
  ],
  "IP": [
    [
      null
    ]
  ],
  "verb": [
    [
      "POST"
    ]
  ],
  "request": [
    [
      "/api/xxx/xxx/xxx"
    ]
  ],
  "http_version": [
    [
      "1.1"
    ]
  ],
  "BASE10NUM": [
    [
      "1.1",
      "200",
      "69"
    ]
  ],
  "rawrequest": [
    [
      null
    ]
  ],
  "status": [
    [
      "200"
    ]
  ],
  "resp_bytes": [
    [
      "69"
    ]
  ],
  "referrer": [
    [
      ""https://xxx.xxx.xxx/""
    ]
  ],
  "QUOTEDSTRING": [
    [
      ""https://xxx.xxx.xxx/"",
      ""Mozilla/5.0 (iPhone; CPU iPhone OS 16_3 like Mac OS X) AppleWebKit/605.1.15 (KHTML, like Gecko) Mobile/15E148"",
      ""1.1.1.1""
    ]
  ],
  "agent": [
    [
      ""Mozilla/5.0 (iPhone; CPU iPhone OS 16_3 like Mac OS X) AppleWebKit/605.1.15 (KHTML, like Gecko) Mobile/15E148""
    ]
  ],
  "xforwardedfor": [
    [
      ""1.1.1.1""
    ]
  ]
}
启动telegraf
# 测试启动
nohup  telegraf --config telegraf.conf --debug
# 退出测试
ctl+c
# 后台进程开启
nohup  telegraf --config telegraf.conf >/dev/null 2>&1 &
# 关闭后台进程
ps -aux | grep telegraf
kill -9 '对应pid'
3.配置granfa
a. 登陆granfa http://localhost:3000/login admin admin。首次登陆需要改密码


b.添加数据源


至此tig流转全部完成