1. 安装
npm install echarts
npm install echarts-gl
2. vue组件
html部分
  <template>
  <section class="chartapp">
    <div class="map-chart" ref="mapChart"></div>
  </section>
</template>
JS引入
import * as Echarts from 'echarts'
import 'echarts-gl'
import shanghai from 'shanghai.json'
核心方法
mounted () {
	this.initChart()
},
methods: {
   initChart () {
	  const vue = this
	  let myChart = Echarts.init(this.$refs.mapChart)
	  myChart.onresize = myChart.resize
	  Echarts.registerMap('shanghai', shanghai)
	  const options = {
		series:{
			name: 'shanghai',
			type: 'map3D',
			map: shanghai,
			aspectScale: 0.9,
			selectedMode: false,
			shading: 'realistic'
			// 后面添加各个属性OBJ
		}
	  }
	  myChart.setOption(options)
  }
}
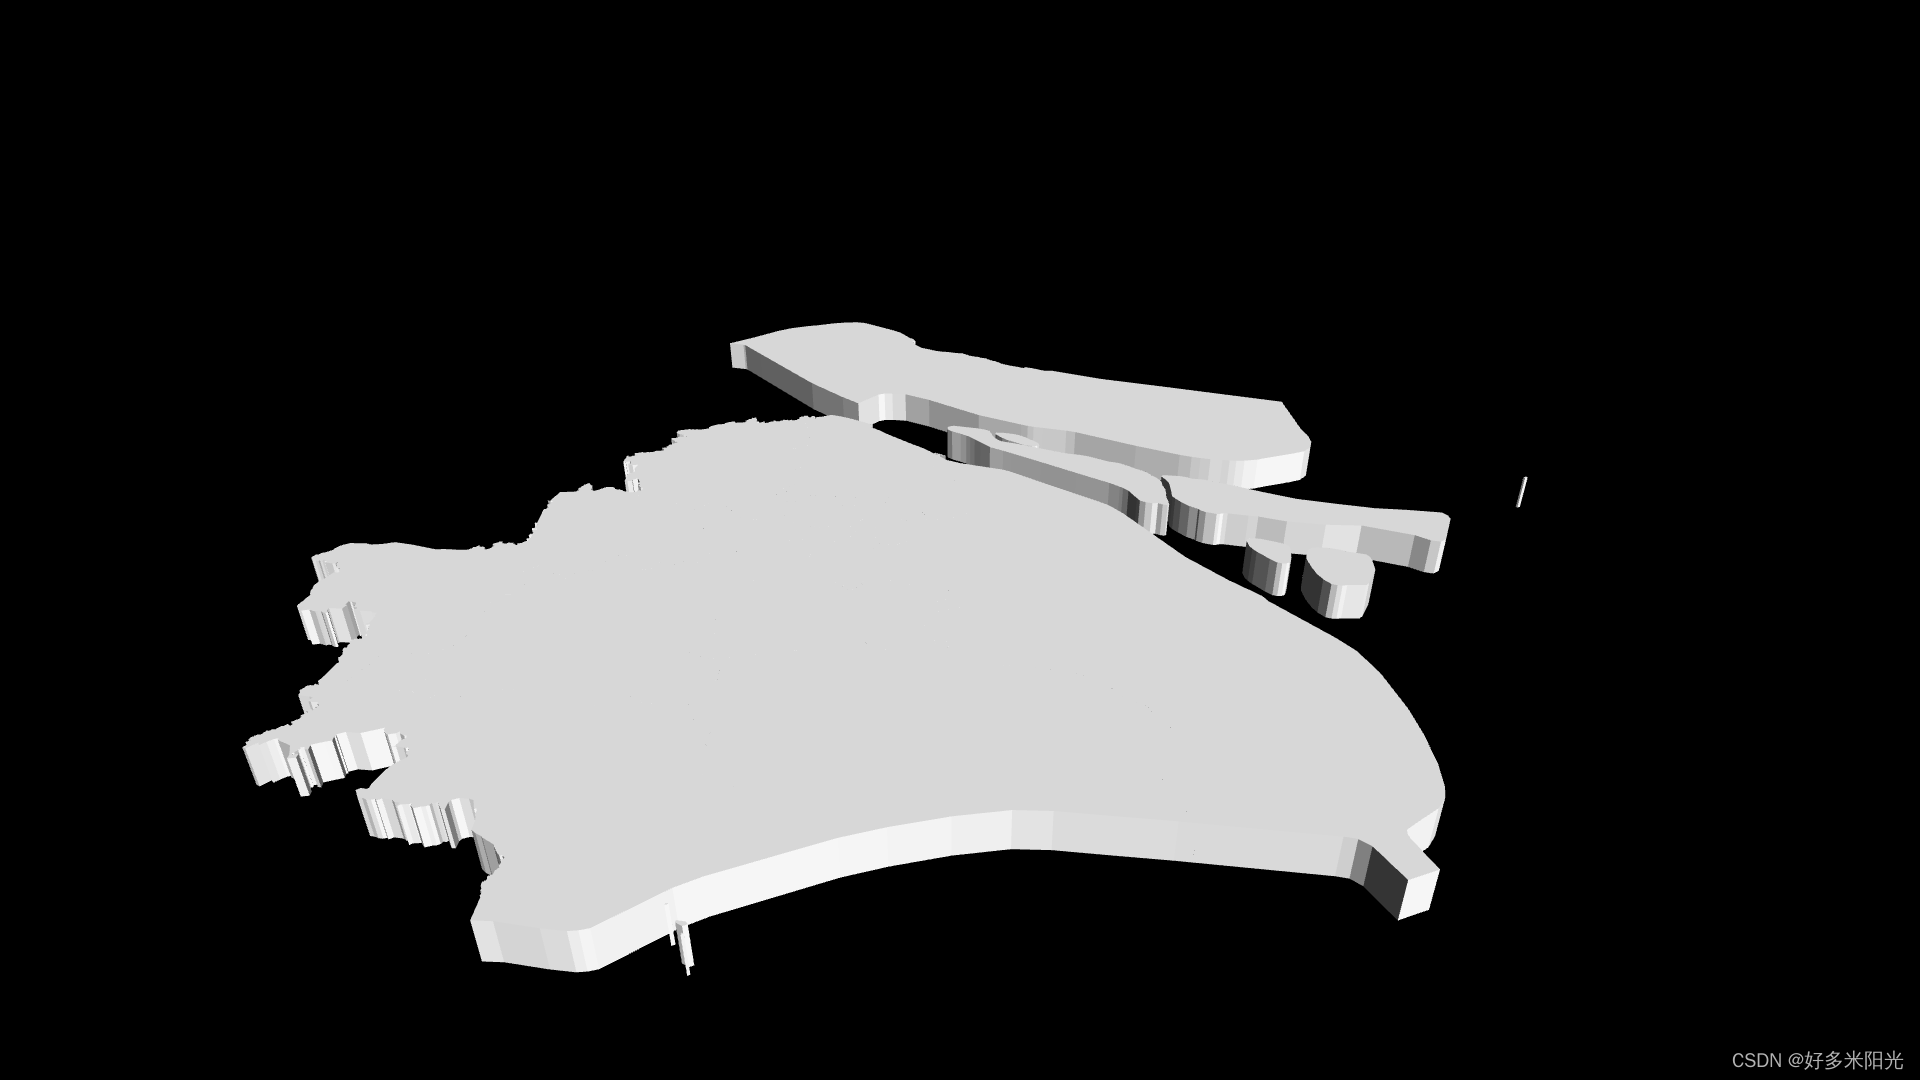
地图初显效果
添加描边
  const itemStyle = {
    opacity: 1,
    borderWidth: 2,
    borderColor: '#01CAF8',
    shadowColor: 'red'
  }
添加区域图片纹理
  const realisticMaterial = {
    detailTexture: '/1.png',
    textureTiling: 1, // 纹理平铺,1是拉伸,数字表示纹理平铺次数
    roughness: 1, // 材质粗糙度,0完全光滑,1完全粗糙
    metalness: 0, // 0材质是非金属 ,1金属
    roughnessAdjust: 0
  }
添加区域鼠标移入效果
  const emphasis = {
    label: {
      show: true,
      color: '#FFF',
      fontSize: 20
    },
    itemStyle: {
      borderColor: '#41EB26',
      borderWidth: 5,
      color: '#41EB26'
    }
  }
添加地级市的标签
  const label = {
    show: true,
    formatter: (params) => {
      name = params.data.name
      if (params.data.alias) name = params.data.alias
      return name
    },
    textStyle: {
      backgroundColor: 'transparent',
      color: '#FFF',
      fontSize: '20',
      padding: 0
    }
  }
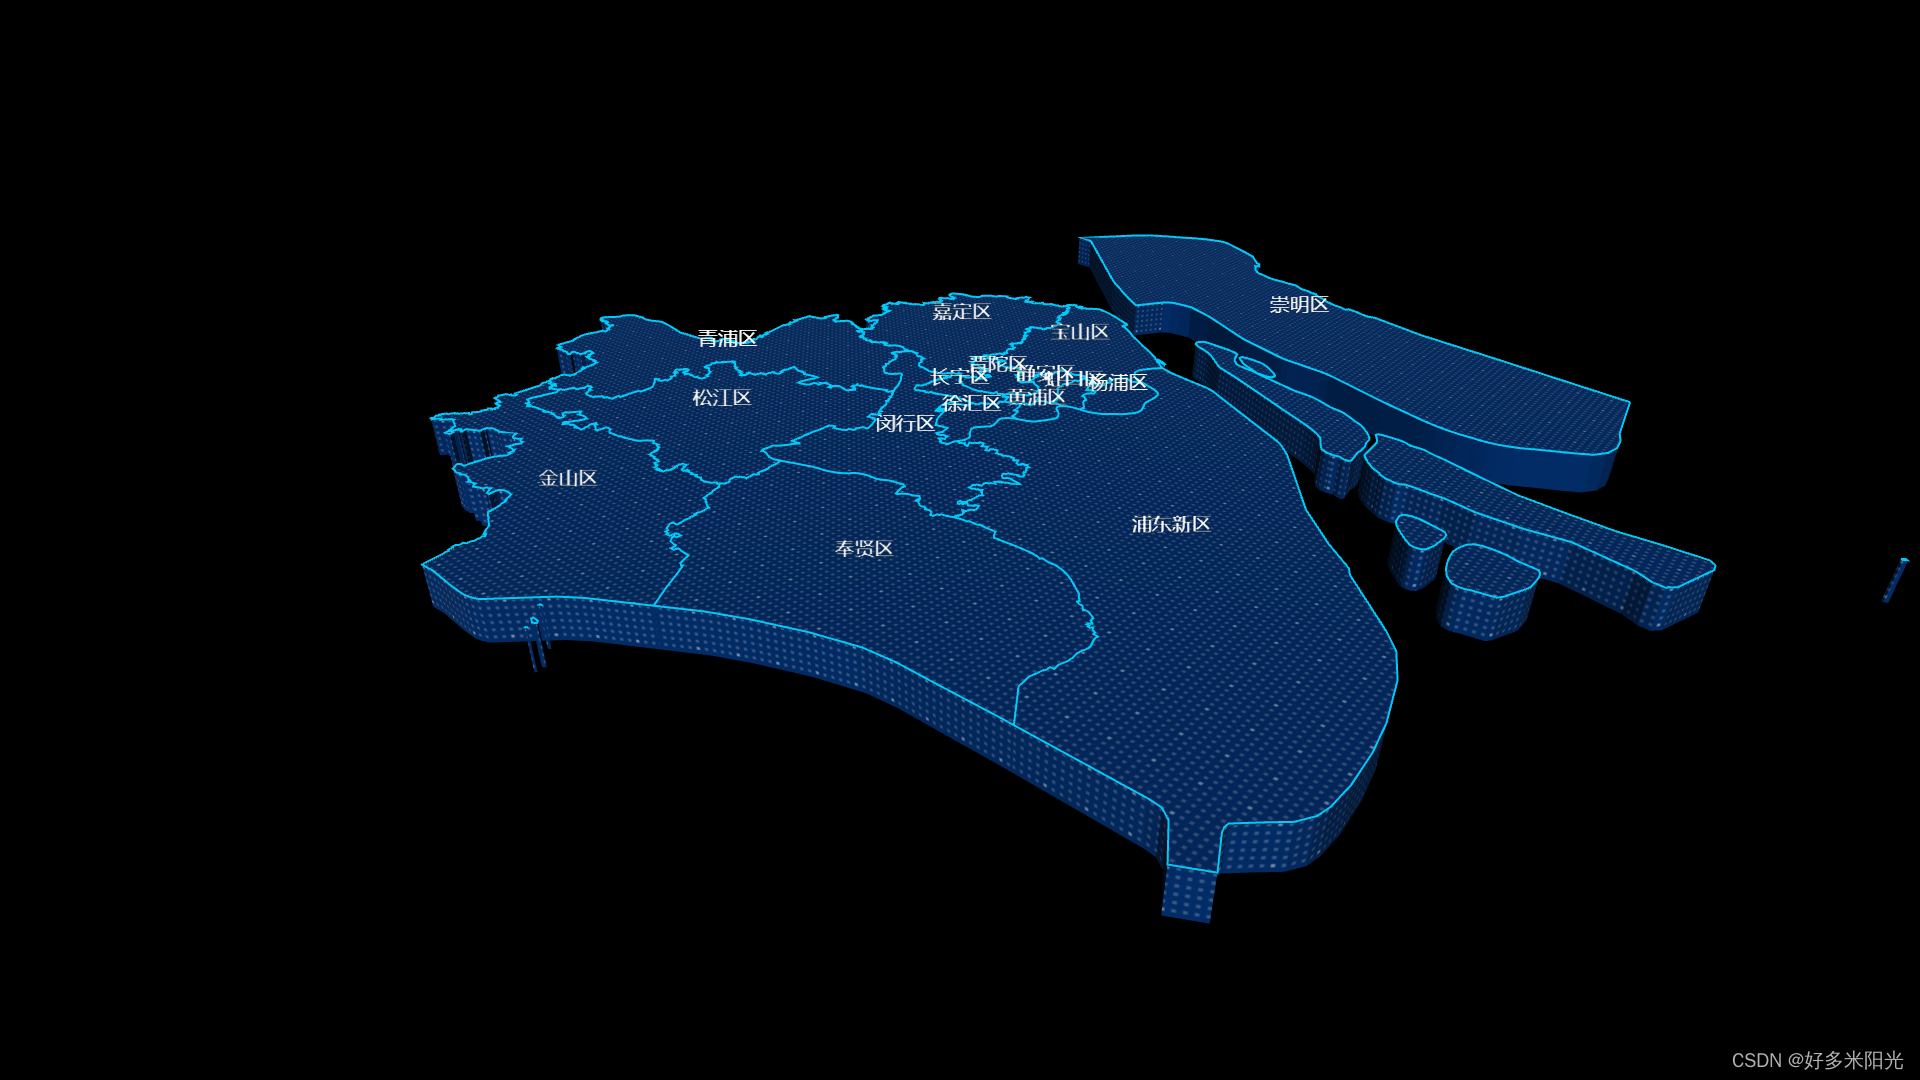
此时效果图
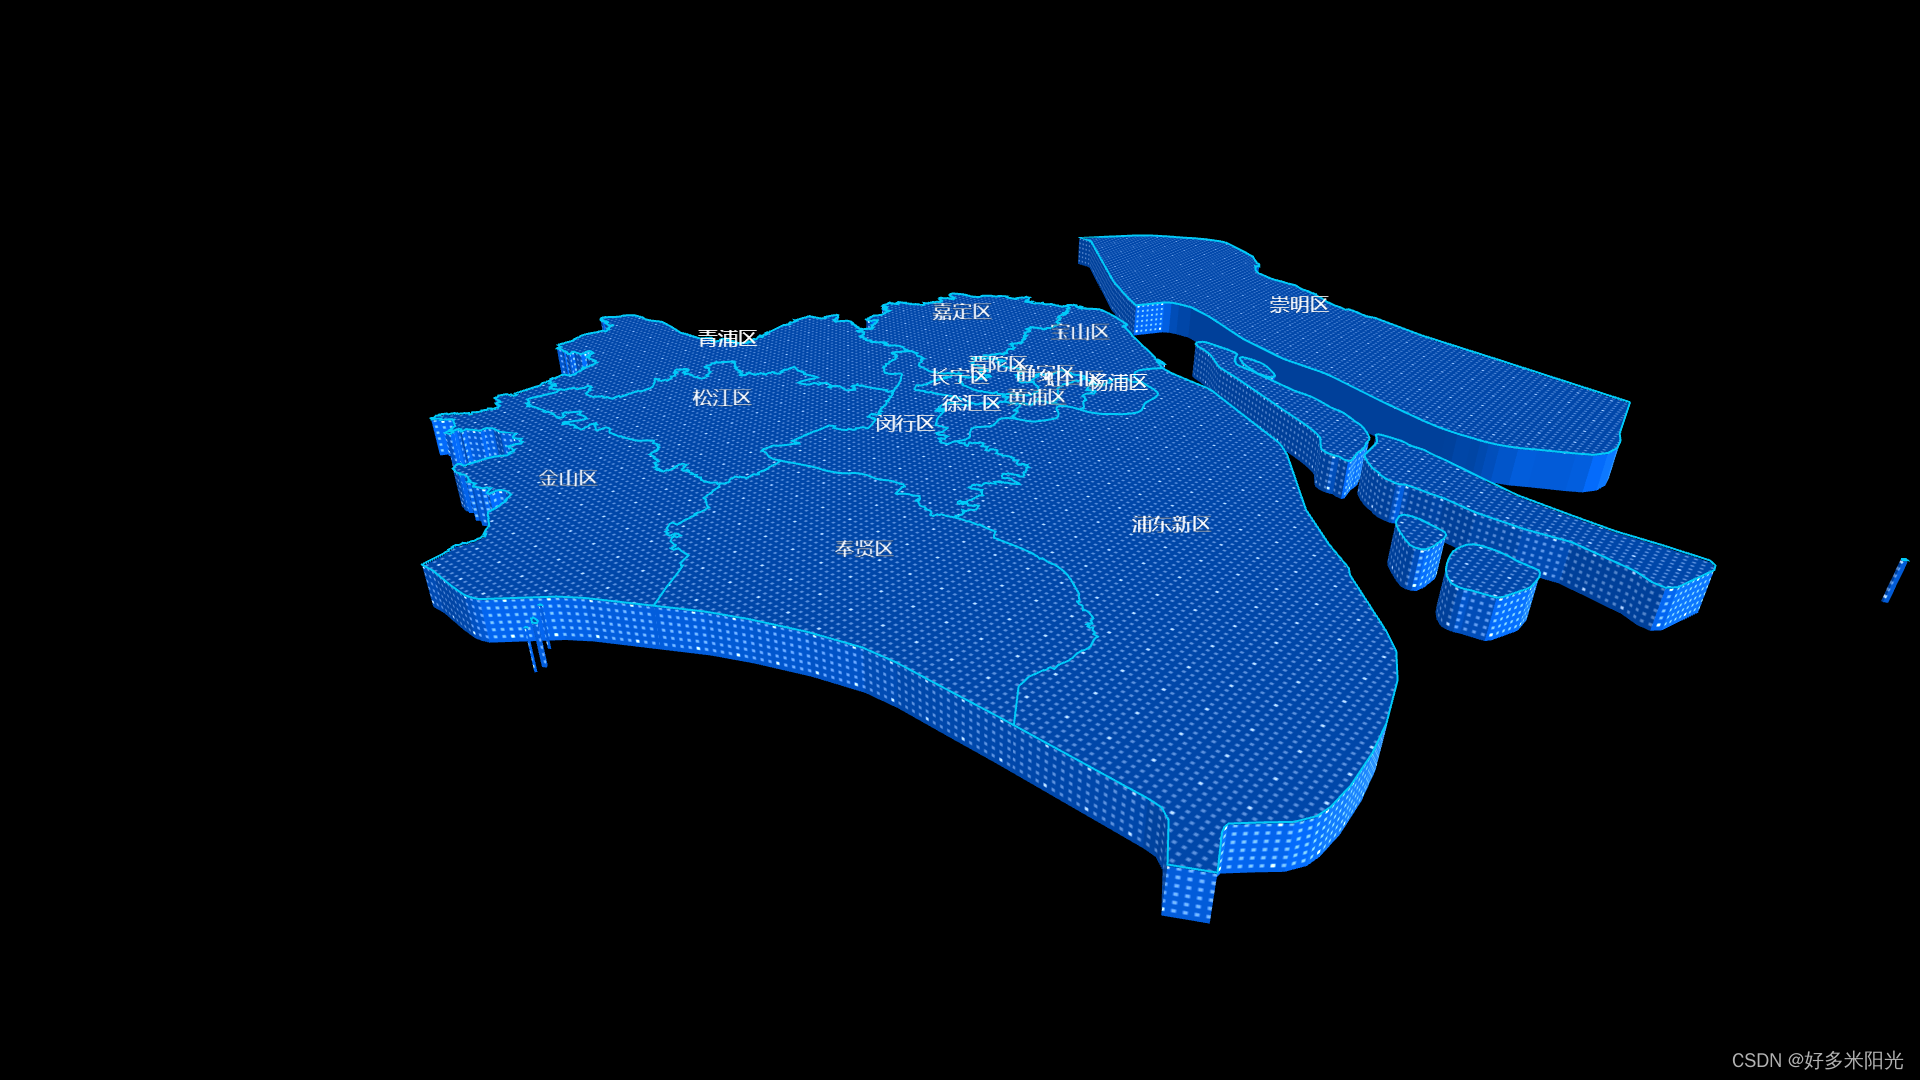
颜色有点暗对,添加光线(intensity:环境光强度,值越大,越亮)
  const light = {
    main: {
      color: '#fff',
      intensity: 1,
      shadow: false,
      shadowQuality: 'high',
      alpha: 8,
      beta: 80
    },
    ambient: {
      color: '#fff',
      intensity: 1
    }
  }
后续
点击事件(可用)
 myChart.off('click')
    myChart.on('click', function (params) {
 })
3. 总结
很对人遇到myChart.off(‘click’)不生效,是因为,你地图在geo上面的。series这儿就没问题了。


![2023年中国车载导航仪产量、销量及市场规模分析[图]](https://img-blog.csdnimg.cn/img_convert/7324d13d72e7d14cffdb8762145838f1.png)

