<div class="ybptx" ref="btryzb"></div>

 mounted() {
      this.getBtData();

    },


getBtData() {
        var chart = this.$echarts.init(this.$refs.btryzb);
        var data_czzf= 88;
        var option = {
            series: [
                {
                    name: '内层数据刻度',
                    type: 'gauge',
                    radius: '80%',
                    min: 0,
                    max: 100,
                    center: ['50%', '50%'],
                    pointer:{
                     show:false//是否显示指针
                    },
                    axisLine: {
                        lineStyle: {
                            width: 30,
                            color: [
                                [data_czzf/100, new this.$echarts.graphic.LinearGradient(
                                    0, 1, 0, 0,
                                    [{
                                        offset: 0,
                                        color: '#5185e5'
                                    }, {
                                        offset: 1,
                                        color: '#90b6fa'
                                    }]
                                )],
                                [1, '#FFFFFF']
                            ],
                        }
                    },
                    splitLine: {
                      show: false,
                      length: 15,
                      lineStyle: {
                          width: 2,
                          color: '#ffffff'
                      }
                    },
                    axisTick: {
                      show: false,
                      lineStyle: {
                          width: 1,
                          color: '#ffffff'
                      }
                    },
                    axisLabel: {
                      show: false,
                      color: '#0089fa',
                      distance: 20,
                      fontSize: 12,
                    },
                    detail: {
                        show: true,
                        offsetCenter: ['0','0'],
                        color: '#3469d1',
                        fontSize:52,
                        fontWeight: 'bold',
                        formatter: function (value) {
                            return value.toFixed(0);
                        },
                    },
                    itemStyle: {
                        normal: {
                            color: 'rgb(0,191,255)'
                        }
                    },
                    data: [{
                        value: data_czzf,
                        name:"成长总分数"
                    }],
                    silent: false,
                    title:{
                        offsetCenter : [0, '75%'],//设置在线率位置
                        color:'#333333',
                        fontSize: 20,
                        fontWeight: 'bold'
                    }
                },
            ]
        };
        // 绘制图表
        chart.setOption(option);
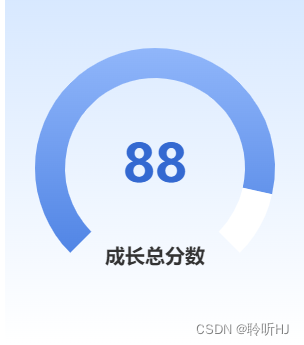
      },


![[硬件基础]-双稳态多谐振荡器配置](https://img-blog.csdnimg.cn/9133df2fcf5c43389d34eb1d9535e0d3.png#pic_center)


![[代码随想录]二叉树篇](https://img-blog.csdnimg.cn/d4219b2c993f482595477b43219d2ae9.png)
