R语言七天入门教程七:项目实战
在完成之前R语言基础知识的学习后,今天的内容是项目实战,通过完成一些小项目来巩固知识。
一、矩阵运算计算器(变量与运算符练习)
1、问题描述
给定矩阵A和B,计算矩阵相加、相减、相乘,如果无法进行相关运算,需要给出提示。
2、解决思路
对于矩阵相加、相减、相乘等操作,对矩阵的形状有特定的要求。因此我们可以先判断形状是否符合要求,如果符合,就返回计算结果;如果不符合,就给出相应提示。
3、代码
# 矩阵加法
mat_add<-function(mat_A, mat_B){
    # dim()函数用于获取矩阵的形状,返回值是一个长度为2的向量,分别表示矩阵的行数和列数
    size_A = dim(mat_A) # 获取矩阵A的形状
    size_B = dim(mat_B) # 获取矩阵B的形状
    if(size_A[1] == size_B[1] && size_A[2] == size_B[2]) # 如果形状相同,则可以相加
        return mat_A + mat_B
    else
        print('The dimensions of mat_A and mat_B are not equal.')
}


# 矩阵减法
mat_minus<-function(mat_A, mat_B){
    size_A = dim(mat_A) # 获取矩阵A的形状
    size_B = dim(mat_B) # 获取矩阵B的形状
    if(size_A[1] == size_B[1] && size_A[2] == size_B[2]) # 如果形状相同,则可以相减
        return mat_A - mat_B
    else
        print('The dimensions of mat_A and mat_B are not equal.')
}

# 矩阵元素乘法
mat_element_multiply<-function(mat_A, mat_B){
    size_A = dim(mat_A) # 获取矩阵A的形状
    size_B = dim(mat_B) # 获取矩阵B的形状
    if(size_A[1] == size_B[1] && size_A[2] == size_B[2]) # 如果形状相同,则可以元素相乘
        return mat_A * mat_B
    else
        print('The dimensions of mat_A and mat_B are not equal.')
}

# 矩阵乘法
mat_multiply<-function(mat_A, mat_B){
    size_A = dim(mat_A) # 获取矩阵A的形状
    size_B = dim(mat_B) # 获取矩阵B的形状
    if(size_A[1] == size_B[2] && size_A[2] == size_B[1]) # 如果形状匹配,则可以相乘
        return mat_A %*% mat_B
    else
        print('The dimensions of mat_A and mat_B do not match.')
}


# 先创建三个矩阵
mat_A = matrix(data=c(1:6), nrow=2, ncol=3, byrow = TRUE)
mat_B = matrix(data=c(7:12), nrow=2, ncol=3, byrow = TRUE)
mat_C = matrix(data=c(13:18), nrow=3, ncol=2, byrow = TRUE)
print(mat_A)
print(mat_B)
print(mat_C)

# 依次调用函数进行计算
mat_add(mat_A, mat_B)
mat_minus(mat_A, mat_B)
mat_element_multiply(mat_A, mat_B)
mat_multiply(mat_A, mat_C)

mat_add(mat_A, mat_C) # 无法计算,给出提示
4、结果
运行结果如下,可以看到由于mat_A和mat_C的形状并不一致,所以无法进行相加:

二、人机猜拳小游戏(程序控制结构练习)
1、问题描述
和电脑进行石头剪刀布的小游戏,由用户进行选择出拳,并统计电脑和用户的得分,用户可以选择是否退出。
2、解决思路
可以考虑一个死循环来监听用户的输入,根据用户不同的输入来进行猜拳或者退出游戏,每次猜拳后就打印游戏得分情况。
3、代码
rock_paper_scissors<-function(){
    win = 0 # 赢的分数
    lose = 0 # 输的分数
    draw = 0 # 平的分数
    while(TRUE){
       choice = readline(prompt='Please input your choice: 1-rock, 2-paper, 3-scissors, 4-quit.--') # 读取当前行用户的输入,并存储到choice变量中
        user_number = as.numeric(choice) # 将字符型的choice变量转换为数字型变量user_number
        # sample函数从给定向量中随机采样, size是采样的个数,此处用于生成随机数
       	pc_number = sample(1:3, size = 1) # 生成区间[1,3]内的一个随机整数
        if(is.na(user_number)){ # 输入无法转换为数字,说明输入有误,提示用户重新输入
            print('Please input one of "1, 2, 3, 4".')
             next # 直接开始下一次循环
        }else if(user_number == 4){ # 等于4,就退出游戏
            # cat函数用于将字符串和变量值进行拼接
            cat('you win:', win, 'lose:', lose, 'draw:', draw) # 游戏结果
            break
        }else if(user_number == 1){ # 玩家出石头
            if(pc_number == 1) { # 电脑出石头
                print('You choose rock, pc chooses rock.')
                draw = draw + 1 # 平局
            }
            else if(pc_number == 2){ # 电脑出布
                print('You choose rock, pc chooses paper.')
                lose = lose + 1 # 输了
            }
            else if(pc_number == 3) { # 电脑出剪刀
                print('You choose rock, pc chooses scissors.')
                win = win  + 1 # 赢了
            }
            cat('you win:', win, 'lose:', lose, 'draw:', draw)
        }else if(user_number == 2){ # 玩家出布
            if(pc_number == 1) { # 电脑出石头
                print('You choose paper, pc chooses rock.')
                win = win  + 1 # 赢了
            }
            else if(pc_number == 2){ # 电脑出布
                print('You choose paper, pc chooses paper.')
                draw = draw + 1 # 平局
            }
            else if(pc_number == 3) { # 电脑出剪刀
                print('You choose paper, pc chooses scissors.')
                lose = lose + 1 # 输了
            }
            cat('you win:', win, 'lose:', lose, 'draw:', draw)
        }else if(user_number == 3){ # 玩家出剪刀
            if(pc_number == 1) { # 电脑出石头
                print('You choose scissors, pc chooses rock.')
               	lose = lose + 1 # 输了
            }
            else if(pc_number == 2){ # 电脑出布
                print('You choose scissors, pc chooses paper.')
                 win = win  + 1 # 赢了
            }
            else if(pc_number == 3) { # 电脑出剪刀
                print('You choose scissors, pc chooses scissors.')
                draw = draw + 1 # 平局
            }
            cat('you win:', win, 'lose:', lose, 'draw:', draw)
        }else{ # 输入的不是1,2,3,4中的一个,应提示重新输入
            print('Please input one of "1, 2, 3, 4".')
        }
    }
}

# 调用函数,开始游戏
rock_paper_scissors()
4、结果
结果如下,可以看到,每次游戏后,都会显示当前的得分情况,并且对于异常输入也会有提示:

三、学生成绩分析(数据框和文件读写练习)
1、问题描述
给定一个csv文件,里面存放的是班级学生的某次考试成绩,试分析本次考试情况。(中位数、平均数、最高分、最低分、学生分数的区间分布等)
2、解决思路
读取csv文件为数据框,通过对数据框进行查询,获取每门课的成绩,通过因子类型可以更方便地统计学生成绩的区间分布。
3、代码
记录学生成绩的students.csv文件如下:
id,Chinese,Math,English
1,110,120,114
2,107,118,116
3,105,113,118
4,102,112,115
5,98,99,100
6,102,114,117
7,106,112,120
8,96,95,89
9,88,84,86
10,103,104,104
代码如下:
scores = read.csv('students.csv')
print(scores) # 查看成绩
# 我们可以使用summary()函数查看整体的综合信息
summary(scores) # 查看整体统计信息
# 如果要关注单个学科的成绩,以语文成绩为例
summary(scores$Chinese)

# 也可以按需求一项一项查看
mean(scores$Chinese) # 平均分
median(scores$Chinese) # 中位数
max(scores$Chinese) # 最高分
min(scores$Chinese) # 最低分
var(scores$Chinese) # 标准差
table(scores$Chinese) # 各个分数出现的频次
# names函数是获取列名,which.max找出频次最大的列
names(table(scores$Chinese))[which.max(table(scores$Chinese))] # 众数

# 统计图
plot(scores$Chinese,type='o') # 画散点图,type='o'表示把点连起来
chn_factor = factor(scores$Chinese) # 变成因子类型
plot(chn_factor) # 分数直方图
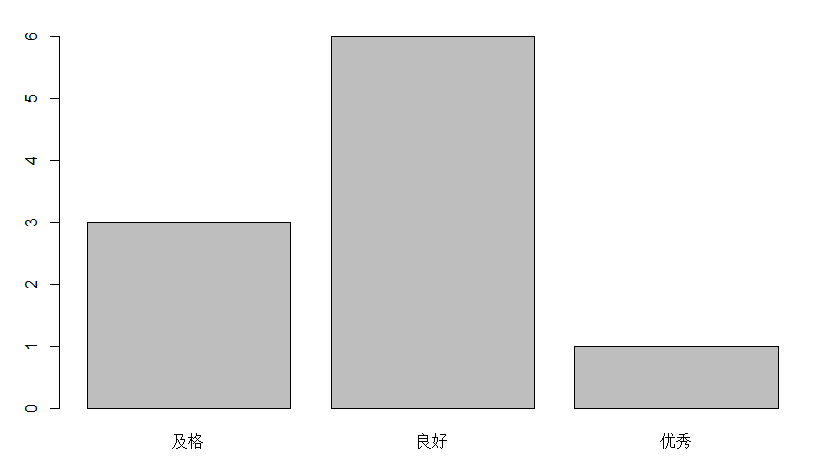
# 108分及以上为优秀,102-107分为良好,其余为及格
cut_factor = cut_factor = cut(scores$Chinese, breaks=c(88,101,107,120),labels=c('及格','良好','优秀'),include.lowest=TRUE)
plot(cut_factor) # 区间分布直方图

# 单个学生的成绩
scores[1,] # 查看第一位学生的成绩
sum(scores[1,2:4]) # 第一位学生的总分,列应只包括第2-4列,因为第一列为id,不是成绩
4、结果







![[附源码]java毕业设计基于技术的新电商助农平台](https://img-blog.csdnimg.cn/e7d114728606440bb9eb62e201e2a140.png)

