此文通过给大家设计一个全面的代码,帮助大家了解matplotlib库画图的全貌
代码解读,略。
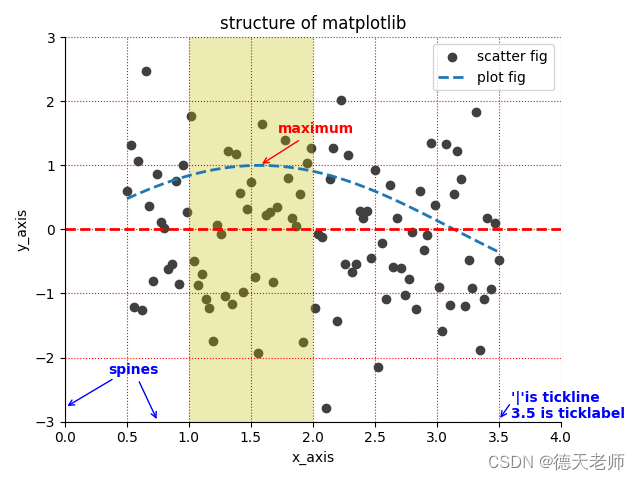
图示解读:
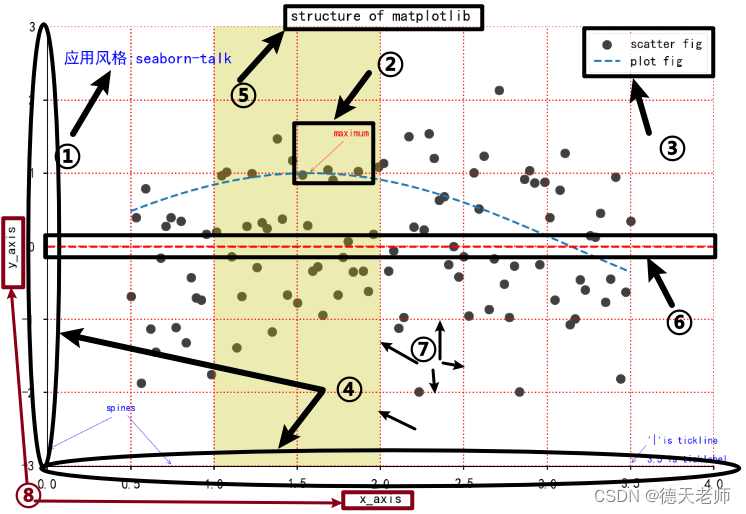
对照上图序号和下面序号看代码解释:
1.应用风格使用代码:plt.style.use(sty)
2.文本注释 plt.annotate(‘maximum’,xy=(np.pi/2,1.0),
xytext=((np.pi/2)+0.15,1.5),weight=‘bold’,color=‘r’,
arrowprops=dict(arrowstyle=‘->’,connectionstyle=‘arc3’,color=‘r’))
3.线标注:plt.legend()
4.坐标数据范围 plt.xlim(0.0,4)
plt.ylim(-3.0,3.0)
5.图形标题:plt.title(‘structure of matplotlib’)
6.图形y轴上的分割线: plt.axhline(y=0.0,c=‘r’,ls=‘–’,lw=2)
7.背景网格线:plt.grid(True,ls=‘:’,color=‘r’)
8. x,y轴文本标题 plt.ylabel(‘y_axis’)
plt.xlabel(‘x_axis’)
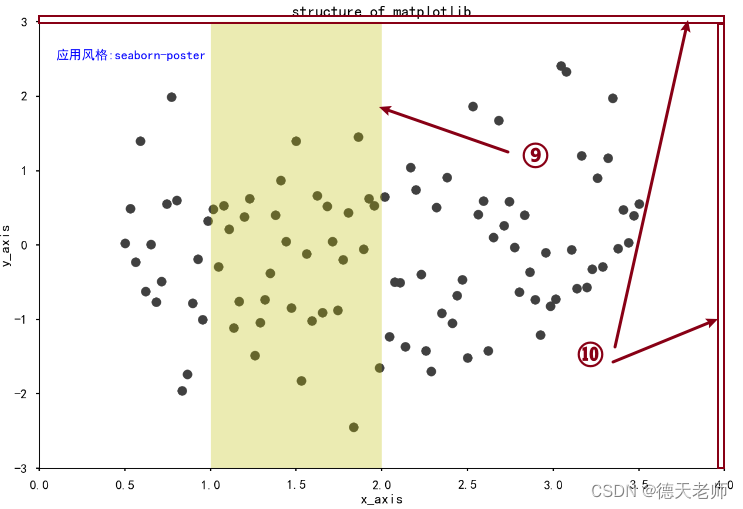
9.竖直方向位于x轴分割条 plt.axvspan(xmin=1.0,xmax=2.0,facecolor=‘y’,alpha=.3)
10.隐藏的top,right框线
       for spine in plt.gca().spines.keys():
    if spine != 'bottom' and spine != 'left':
        plt.gca().spines[spine].set_color('none')
    print(spine)
以下为完整的代码展示
import matplotlib.pyplot as plt
import numpy as np
from matplotlib import cm as cm
#define data
"""
['bmh', 'classic', 'dark_background', 'fast',
'fivethirtyeight', 'ggplot', 'grayscale', 'seaborn-bright',
'seaborn-colorblind', 'seaborn-dark-palette', 'seaborn-dark', 'seaborn-darkgrid',
 'seaborn-deep', 'seaborn-muted', 'seaborn-notebook', 'seaborn-paper',
'seaborn-pastel', 'seaborn-poster', 'seaborn-talk', 'seaborn-ticks',
 'seaborn-white', 'seaborn-whitegrid', 'seaborn', 'Solarize_Light2',
'tableau-colorblind10', '_classic_test']
"""
plt.rcParams['font.family']='SimHei' # 用来正常显示中文标签
plt.rcParams['axes.unicode_minus']=False # 用来正常显示负号
sty = 'seaborn-talk'
plt.style.use(sty)
x = np.linspace(0.5,3.5,100)
y = np.sin(x)
y1 = np.random.randn(100)

# scatter figure
plt.scatter(x,y1,c='0.25',label='scatter fig')
# plot fig
plt.plot(x,y,ls='--',lw=2,label='plot fig')
for spine in plt.gca().spines.keys():
    if spine != 'bottom' and spine != 'left':
        plt.gca().spines[spine].set_color('none')
    print(spine)
plt.gca().xaxis.set_ticks_position('bottom')
#leave left ticks for y-axis on
plt.gca().yaxis.set_ticks_position('left')
#set tick_line position of left
plt.xlim(0.0,4)
plt.ylim(-3.0,3.0)
#set axes labels
plt.ylabel('y_axis')
plt.xlabel('x_axis')
#set x,yaxis grid
plt.grid(True,ls=':',color='r')
#add a horizontal line across the axis
plt.axhline(y=0.0,c='r',ls='--',lw=2)
#add a vertical span across the axis
plt.axvspan(xmin=1.0,xmax=2.0,facecolor='y',alpha=.3)
#set annotating info,注意箭头信息使用dict
plt.annotate('maximum',xy=(np.pi/2,1.0),
             xytext=((np.pi/2)+0.15,1.5),weight='bold',color='r',
             arrowprops=dict(arrowstyle='->',connectionstyle='arc3',color='r'))
plt.annotate('spines',xy=(0.75,-3),
             xytext=(0.35,-2.25),weight='bold',color='b',
             arrowprops=dict(arrowstyle='->',connectionstyle='arc3',color='b'))
plt.annotate('',xy=(0,-2.78),
             xytext=(0.4,-2.32),
             arrowprops=dict(arrowstyle='->',connectionstyle='arc3',color='b'))
plt.annotate('',xy=(3.5,-2.98),
             xytext=(3.6,-2.70),
             arrowprops=dict(arrowstyle='->',connectionstyle='arc3',color='b'))
plt.text(3.6,-2.70,"'|'is tickline",weight="bold",color="b")
plt.text(3.6,-2.95,"3.5 is ticklabel",weight="bold",color="b")
plt.text(0.1,2.5,f"应用风格:{sty}",weight="bold",fontsize=16,color="b")

#set title
plt.title('structure of matplotlib')
#set legend
plt.legend()

plt.show()
效果图输出:
反思感悟:
- 学习编程是需要分解内容,加深理解的过程,还需要把部分合并成整体,以完整的思想体系输出的过程,分解是为了简化内容,更好的记忆,合并是为了应用知识,连续成文章,便于出作品的过程。
- 尽管需要花费时间,但是找到好的方法,你不经意间就做出了自己都感觉到惊讶的作品,那种快乐和开心,只有深入其中的你才能感受无比的快乐!
