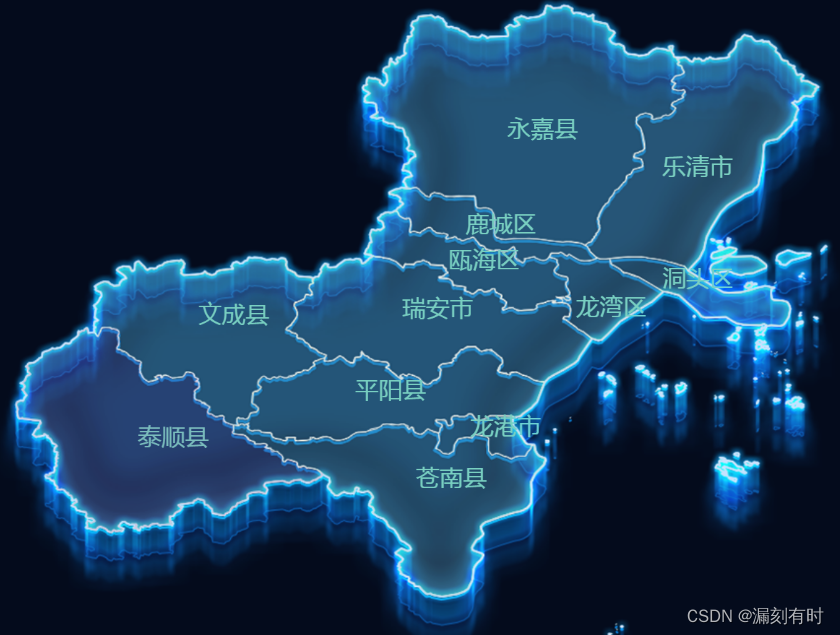
1.定义SVG文件
var svg = ``;
2.注册地图函数
Echarts.registerMap是Echarts图表库中用于注册地图的函数。它可以将第三方地图或自定义地图数据与Echarts进行集成,使用Echarts的API进行绘制。使用方法如下:
echarts.registerMap(mapName, geoJson) 参数mapName是地图的名称,geoJson是地图的数据。注册后可以使用这个地图名称在Echarts中使用这个地图。如有需要,建议咨询Echarts官方网站或者查询专业书籍。
echarts.registerMap("organ_diagram", { svg: svg });
3.核心代码
const datas = {
  from: [300, 400],
  to: [
    {
      name: "永嘉",
      value: 2,
      coord: [600, 100],
    },
    {
      name: "乐清",
      value: 5,
      coord: [700, 150],
    },
    {
      name: "瑞安",
      value: 8,
      coord: [400, 300],
    },
    {
      name: "瓯海",
      value: 10,
      coord: [550, 300],
    },
  ],
};

option = {
  backgroundColor: "#040b1c",
  title: {
    text: "Visit Route",
    left: "center",
    bottom: 10,
  },
  tooltip: {
    trigger: "item",
    backgroundColor: "rgba(166, 200, 76, 0.82)",
    borderColor: "#FFFFCC",
    showDelay: 0,
    hideDelay: 0,
    enterable: true,
    transitionDuration: 0,
    extraCssText: "z-index:100",
    formatter: function (params, ticket, callback) {
      console.log(params);
      //根据业务自己拓展要显示的内容
      var res = "";
      var name = params.name;
      var value = params.value[params.seriesIndex + 1] || params.value;
      res = "<span style='color:#fff;'>" + name + "</span><br/>数据:" + value;
      return res;
    },
  },
  visualMap: {
    //图例值控制
    min: 0,
    max: 10,
    calculable: true,
    show: false,
    color: ["#f44336", "#fc9700", "#ffde00", "#ffde00", "#00eaff"],
    textStyle: {
      color: "#fff",
    },
  },
  geo: {
    left: 10,
    right: 10,
    map: "organ_diagram",
    itemStyle: {
      borderWidth: 0,
    },
    emphasis: {
      focus: "none",
      itemStyle: {
        areaColor: "#ff0000",
      },
      label: {
        show: false,
      },
    },
    regions: [
      {
        name: "map12",
        itemStyle: {
          areaColor: "red",
          color: "red",
        },
      },
    ],
  },
  series: [],
};

myChart.setOption(option);

myChart.on("click", function (event) {
  console.log(event);
  myChart.dispatchAction({
    type: "highlight",
    geoIndex: 0,
    name: event.name,
  });
});
参见: makeAPie
@漏刻有时

